Direkt zum Inhalt Direkt zum Hauptmenü Direkt zur Fußzeile

Figure 3: Spatial distribution of the area-specific emissions of polycyclic aromatic hydrocarbons

Figure 3: Spatial distribution of the area-specific emissions of polycyclic aromatic hydrocarbons (here sum of the 16 EPA PAHs) into surface waters in Germany (average value 2012 to 2016

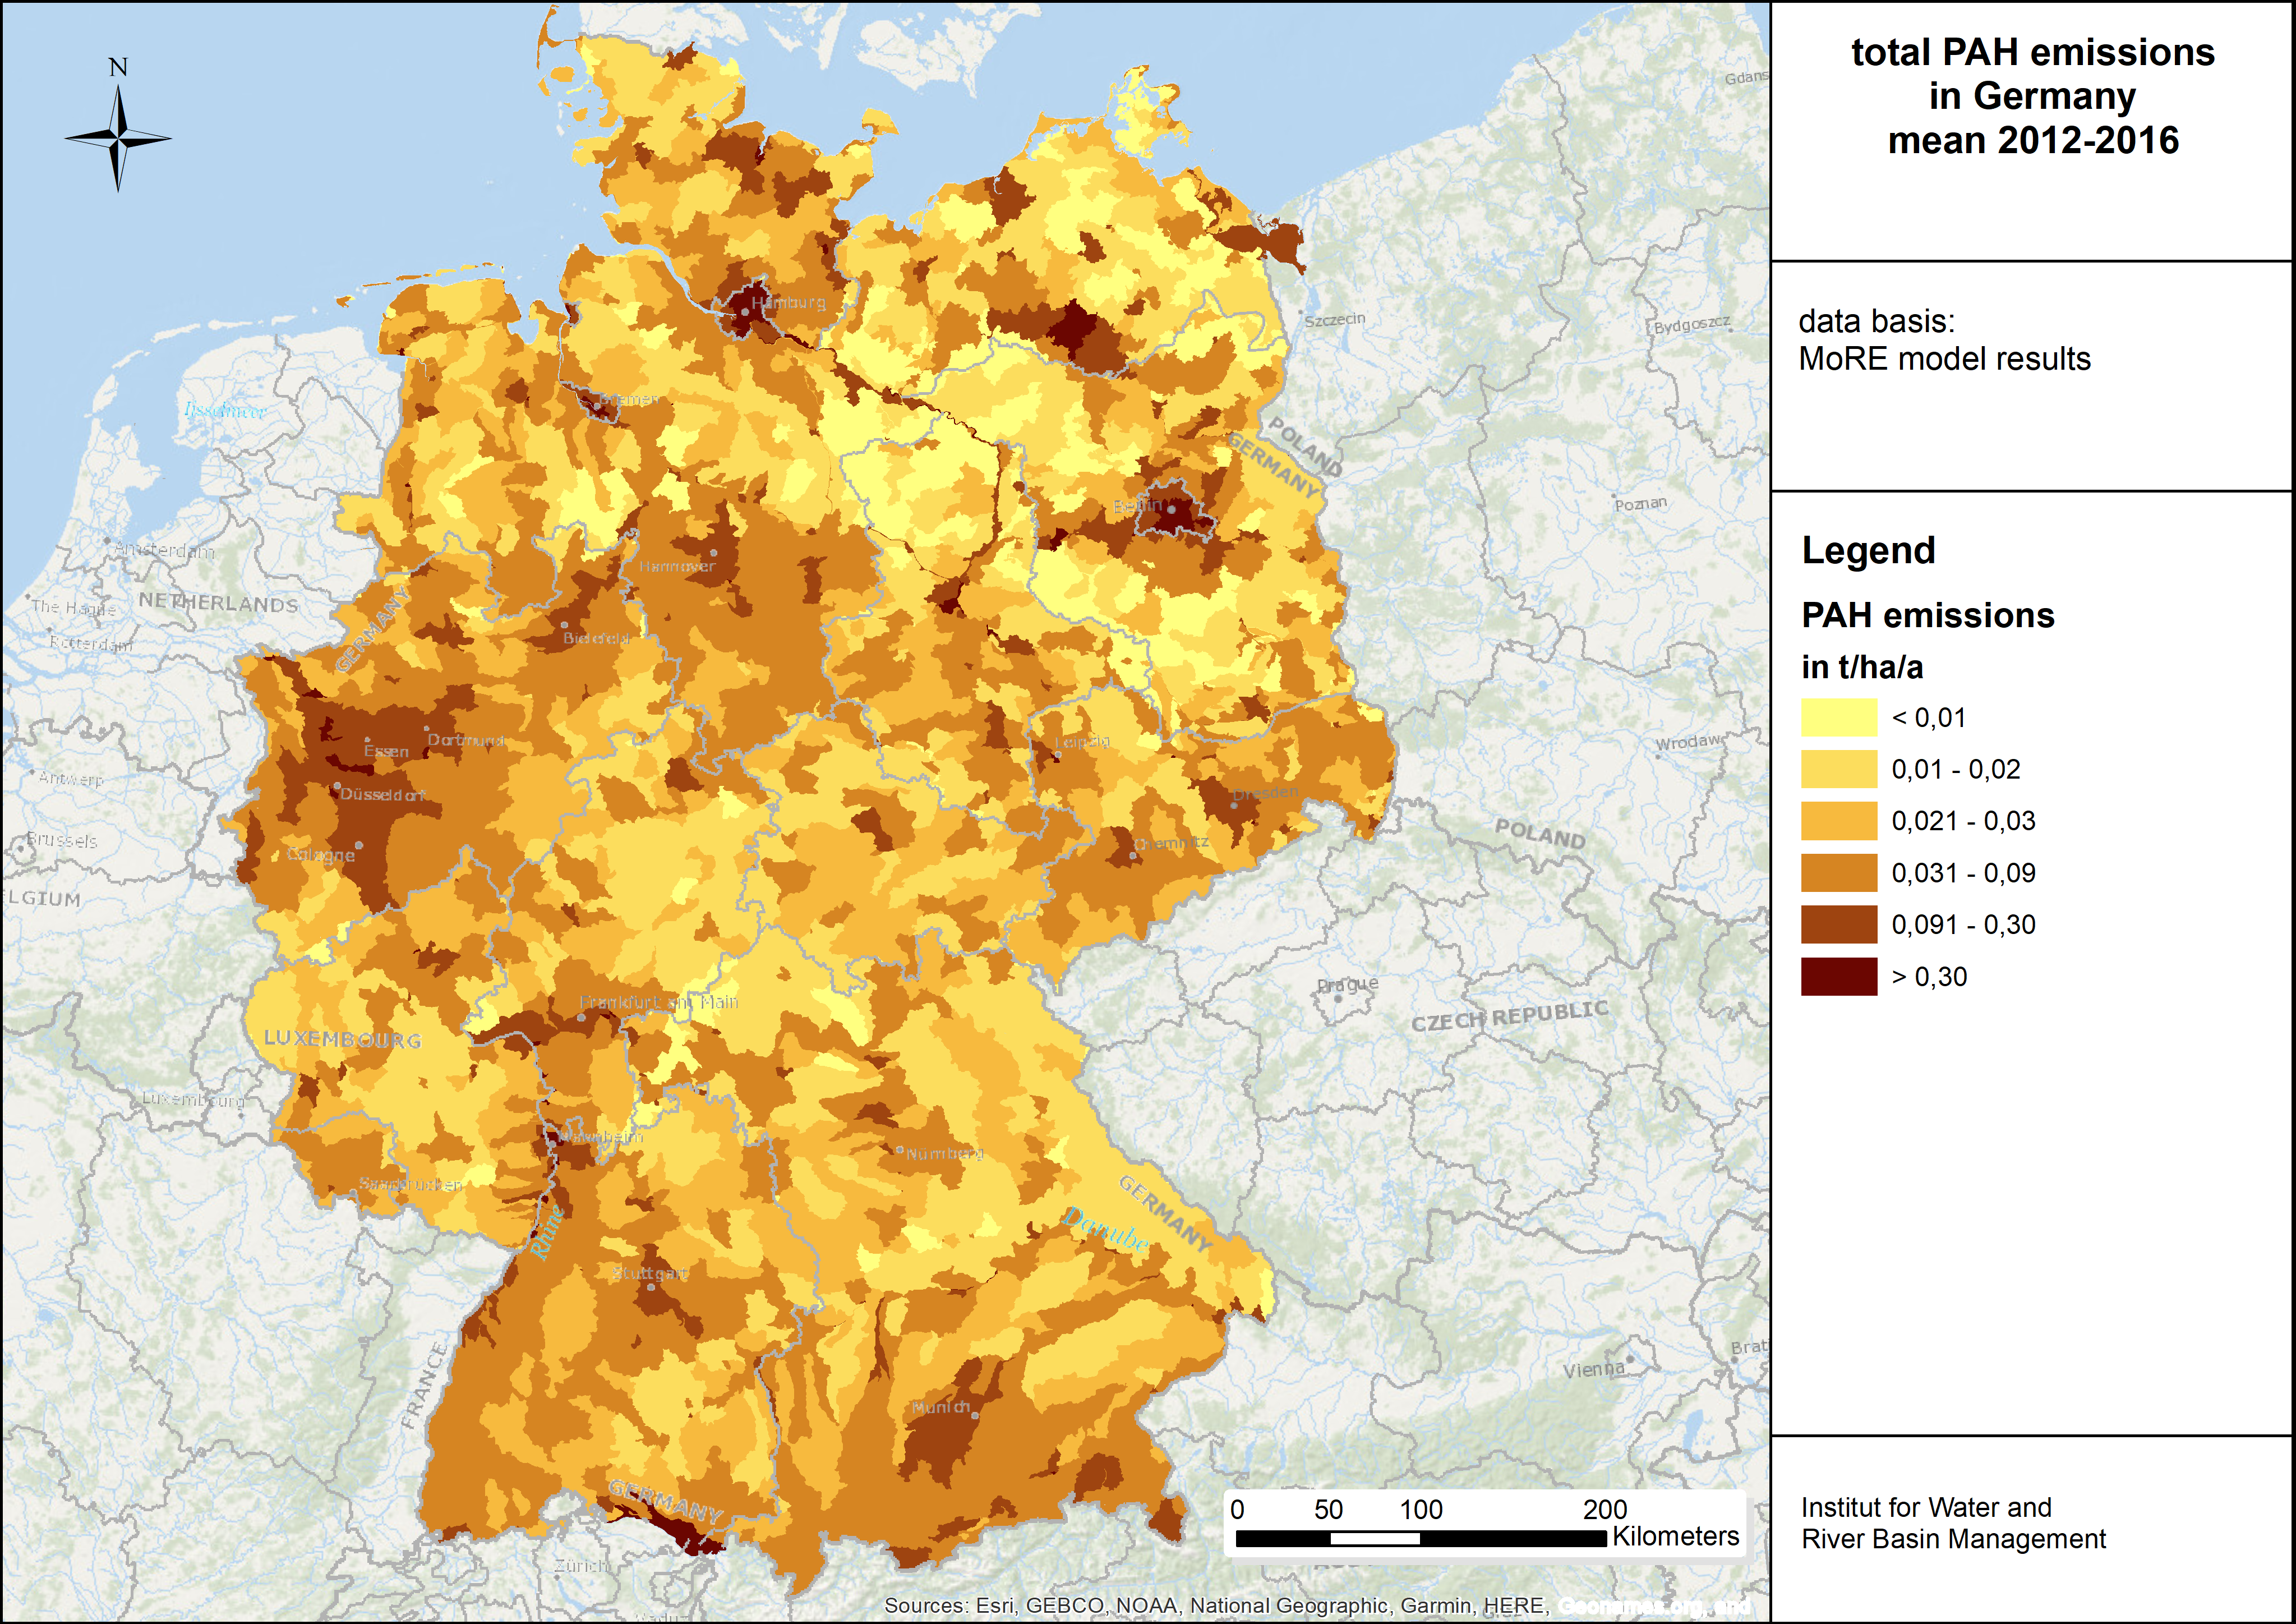
(here sum of the 16 EPA PAHs) into surface waters in Germany (average value 2012 to 2016)

Quelle: UBA

Die folgenden Inhalte enthalten dieses Medium:

Kurzlink: www.uba.de/m96988de