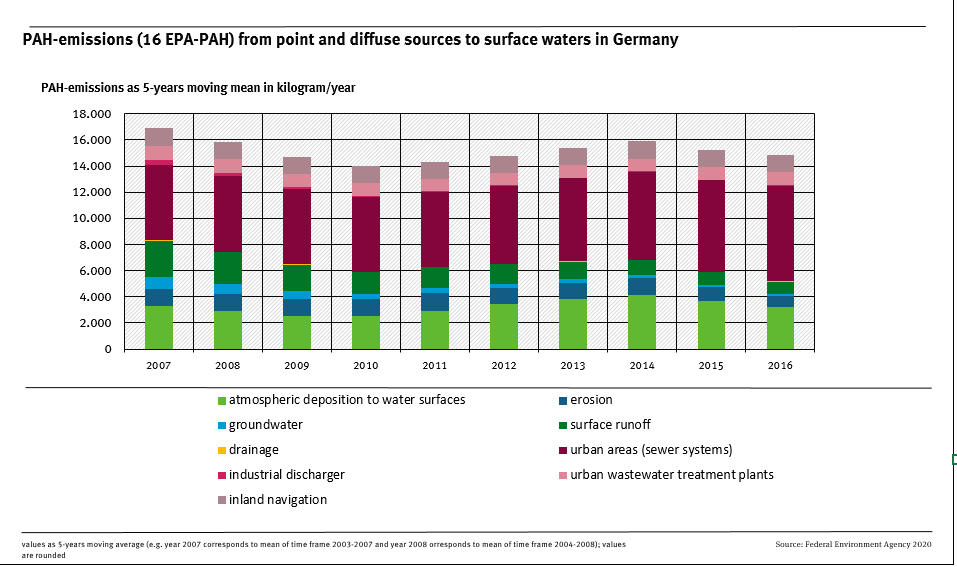
(here sum of the 16 PAHs of the US Environmental Protection Agency (EPA)) into surface waters in Germany (2003 to 2016); shown as 5-year moving averages
Quelle: UBA
Bild herunterladen (108,82 kB)
(here sum of the 16 PAHs of the US Environmental Protection Agency (EPA)) into surface waters in Germany (2003 to 2016); shown as 5-year moving averages