Direkt zum Inhalt Direkt zum Hauptmenü Direkt zur Fußzeile

BO-I-3: Rainfall erosivity

The illustration contains an XY scatter diagram which indicates the mean annual R-factor in Newton per hour. The illustration covers the period 1962 to 2021.
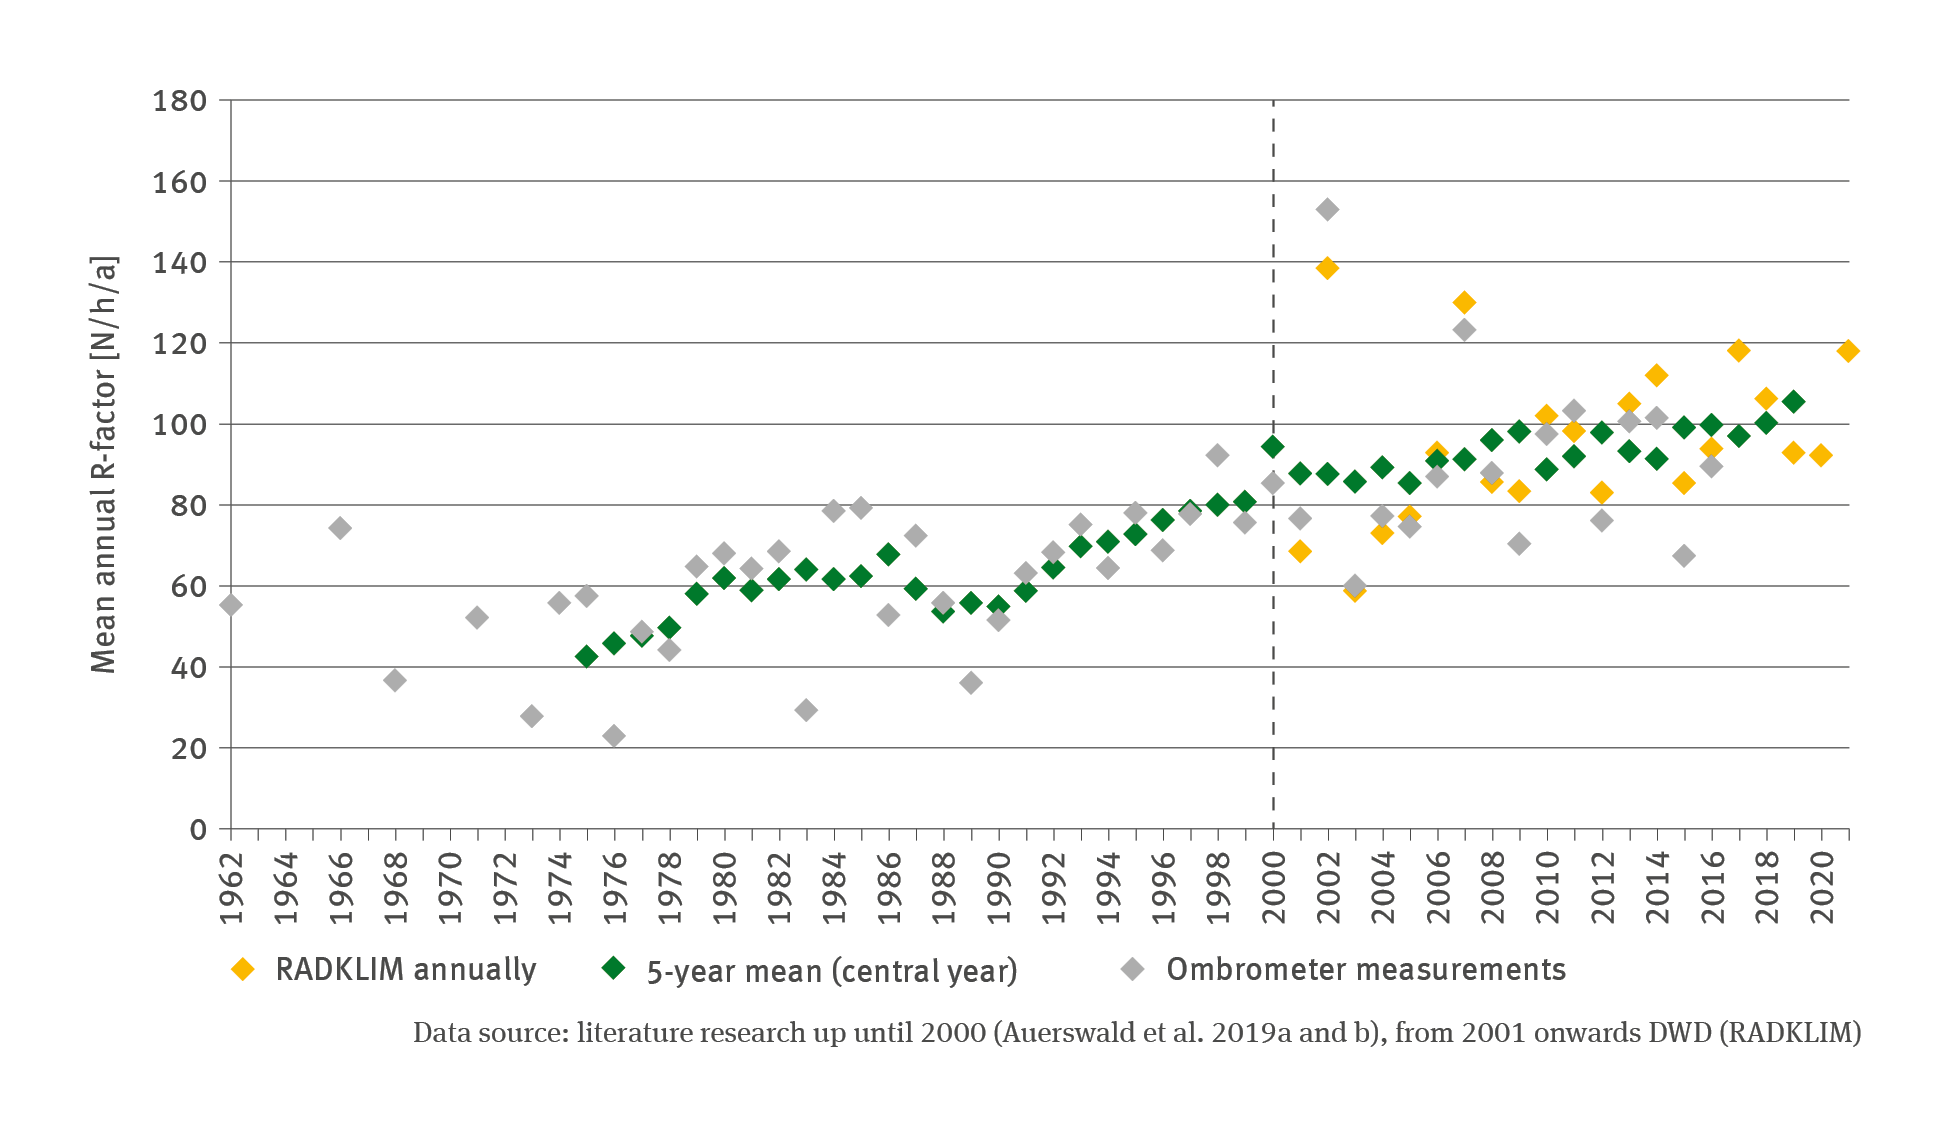
Quelle: literature research up until 2000 (Auerswald et al. 2019a and b); from 2001 onwards DWD (RADKLIM)
Bild herunterladen (106,16 kB)

Die folgenden Inhalte enthalten dieses Medium:

Schlagworte

Kurzlink: www.uba.de/m111705de