Direkt zum Inhalt Direkt zum Hauptmenü Direkt zur Fußzeile

BAU-I-2: Summer-related heat island effect – case study

The illustration BAU-I-2 ’Summer-related heat island effect – case study’ shows a biaxial diagram. In one axis, the frequency of heat island situations is illustrated by means of stacked columns for the months of May to September on the basis of data for Berlin. In the other axis, the medium and maximum heat island intensity is illustrated in a comparison of Berlin and its urban fringe. All time series covered in the illustration range from 2008 to 2021.
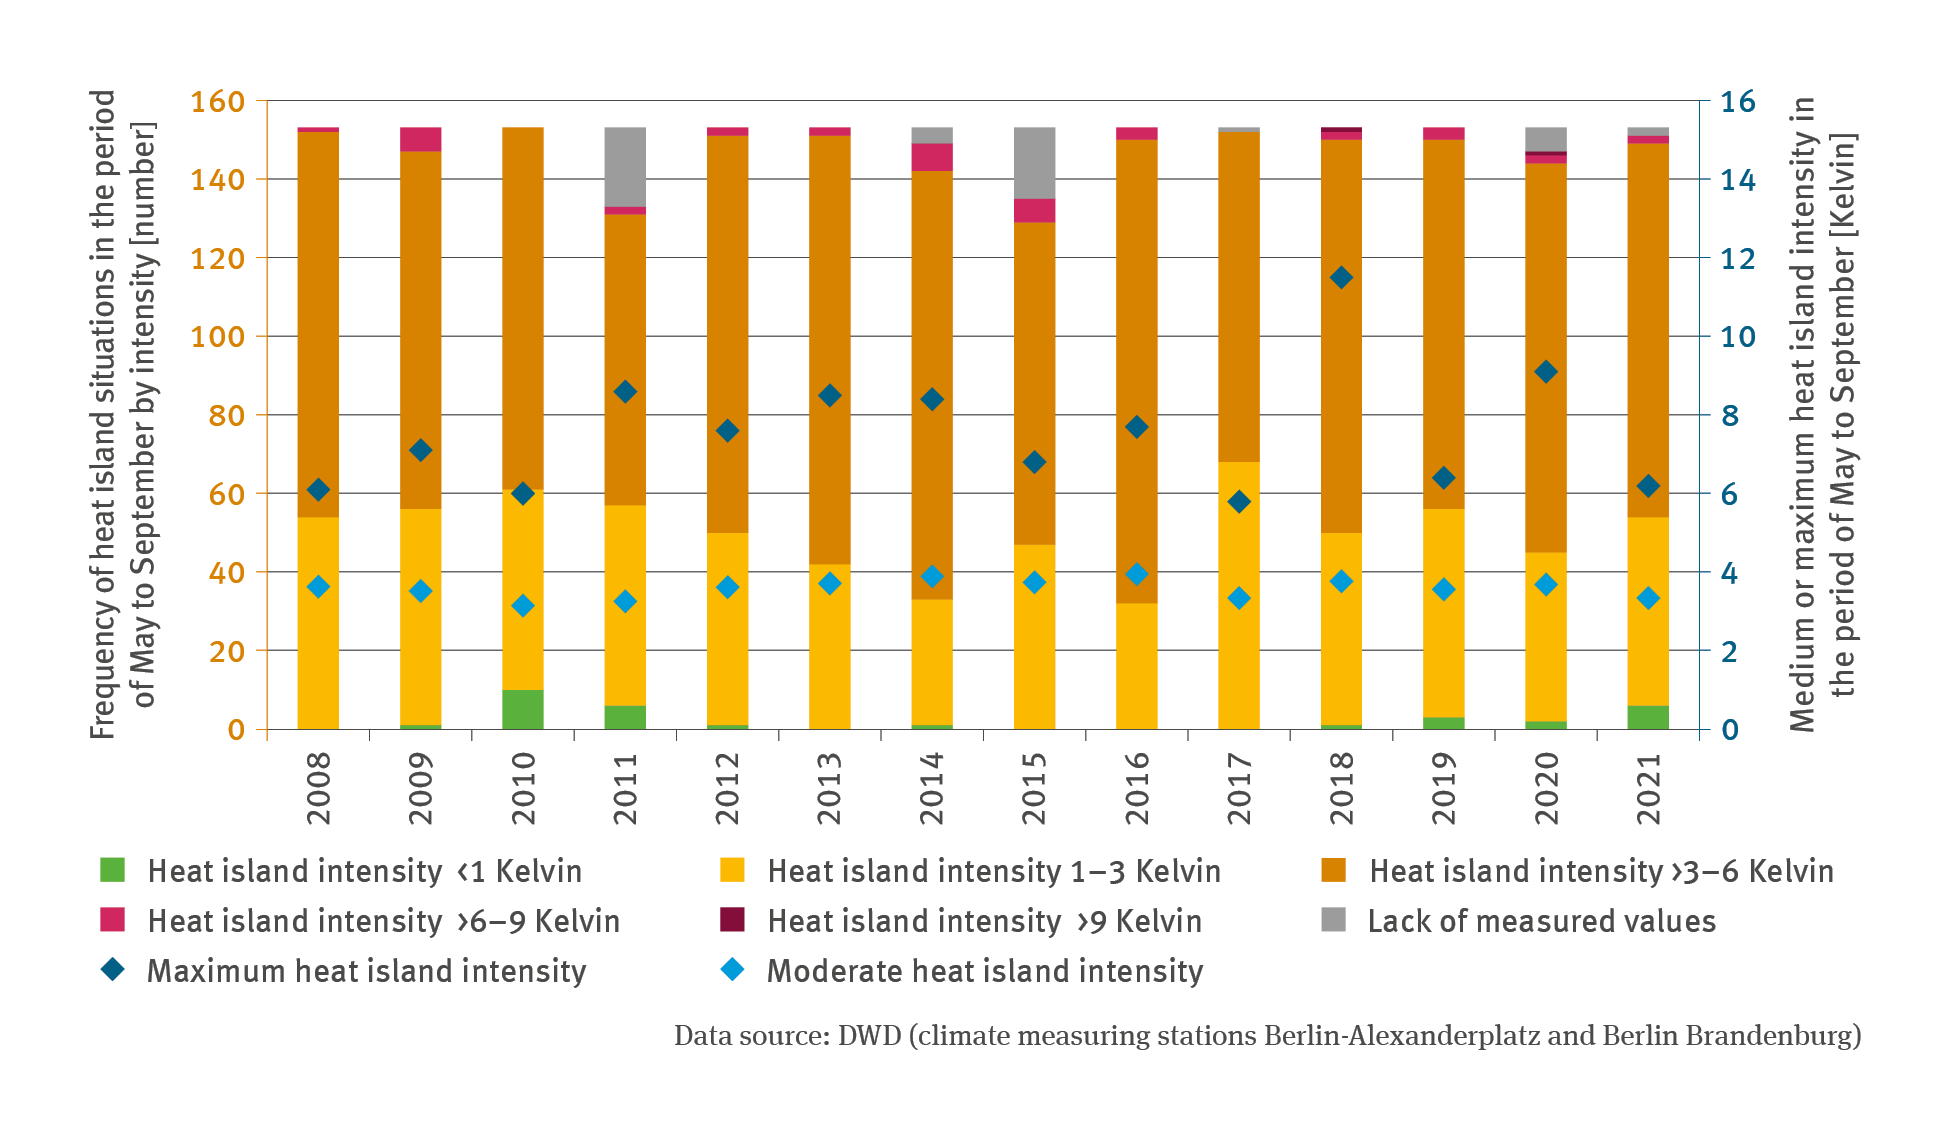
Quelle: DWD (climate measuring stations Berlin-Alexanderplatz and Berlin Brandenburg)
Bild herunterladen (123,92 kB)

Die folgenden Inhalte enthalten dieses Medium:

Kurzlink: www.uba.de/m111742de