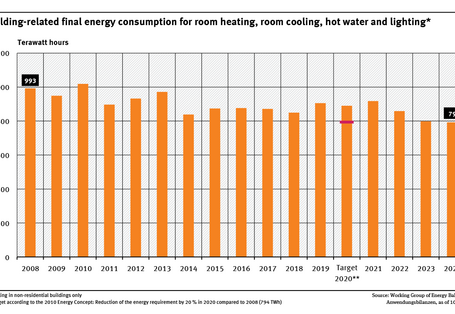
Indicator: Final energy consumption


The environmental and health impacts associated with products – from the pre-manufacturing stages through to production itself, distribution, use and disposal – are becoming more and more important on the path to sustainable development.

The UBA had already introduced an environmental management system in the late 1990s, which was then validated in 2001 according to the most stringent requirements worldwide under the EU Eco-Management and Audit Scheme (EMAS). In the meantime 14 UBA sites – including all air quality monitoring stations – have been validated according to EMAS. In 2017, UBA decided to become greenhouse gas-neutral.

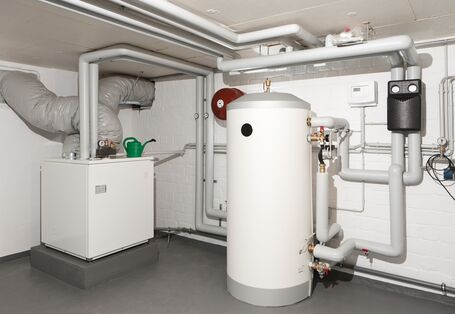
Heat pumps are coming into increasing use for heating of buildings and for hot water production in commercial as well as industrial applications. Heat pumps use natural heat in a very energy-efficient way.
Efficiency increase oftentimes reduces product or service costs, which can in turn ramp up consumption (due to reduced prices), thus partly canceling out the original savings. This is known as the rebound effect.