Data Search

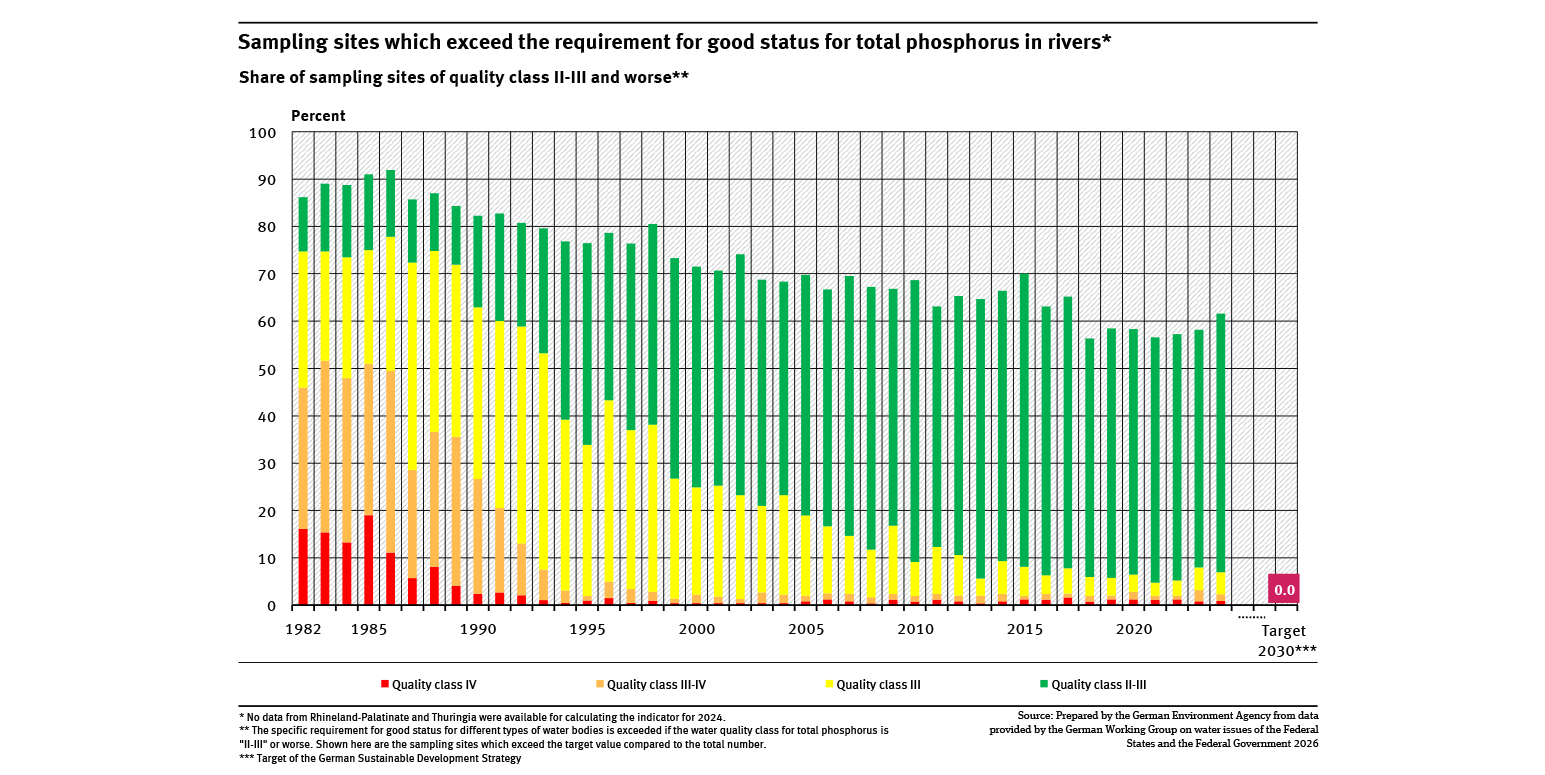
Sampling sites which exceed the requirement for good status for total phosphorus in rivers
- Wasser
- Diagramme
- Umwelt-Indikatoren
- Daten und Tabellen

Time series for the development of renewable energy sources based on statistical data from the Working Group on Renewable Energy-Statistics (AGEE-Stat) in Germany (XLSX-file)
- Klima
- Energie
- Diagramme
- Infografiken
- Daten und Tabellen
Export data
Time series for the development of renewable energy sources based on statistical data from the Working Group on Renewable Energy-Statistics (AGEE-Stat) in Germany (PDF-file)
- Diagramme
- Infografiken
- Daten und Tabellen
Export data

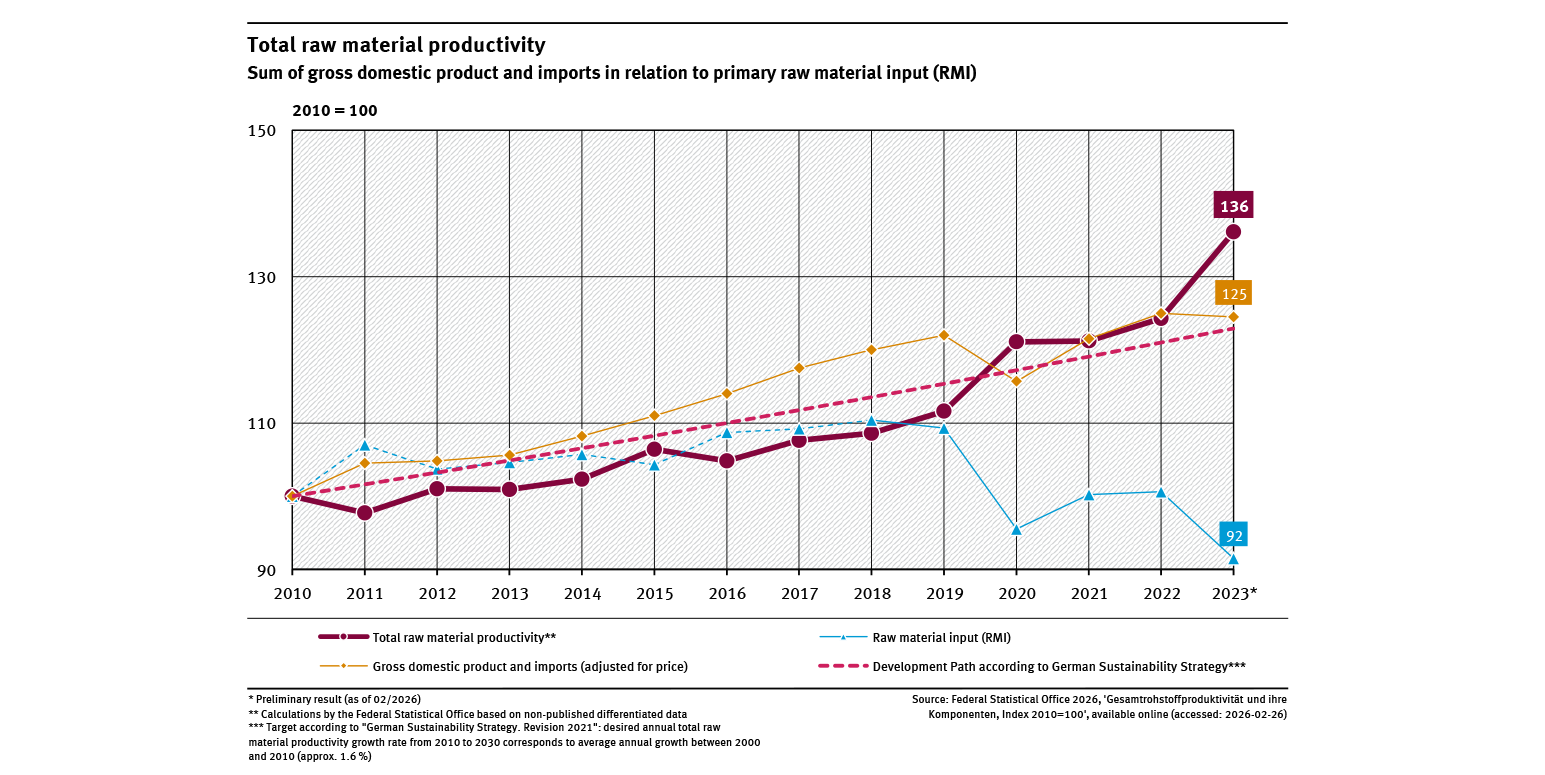
Total raw material productivity
- Ressourcen und Abfall
- Diagramme
- Umwelt-Indikatoren
- Daten und Tabellen

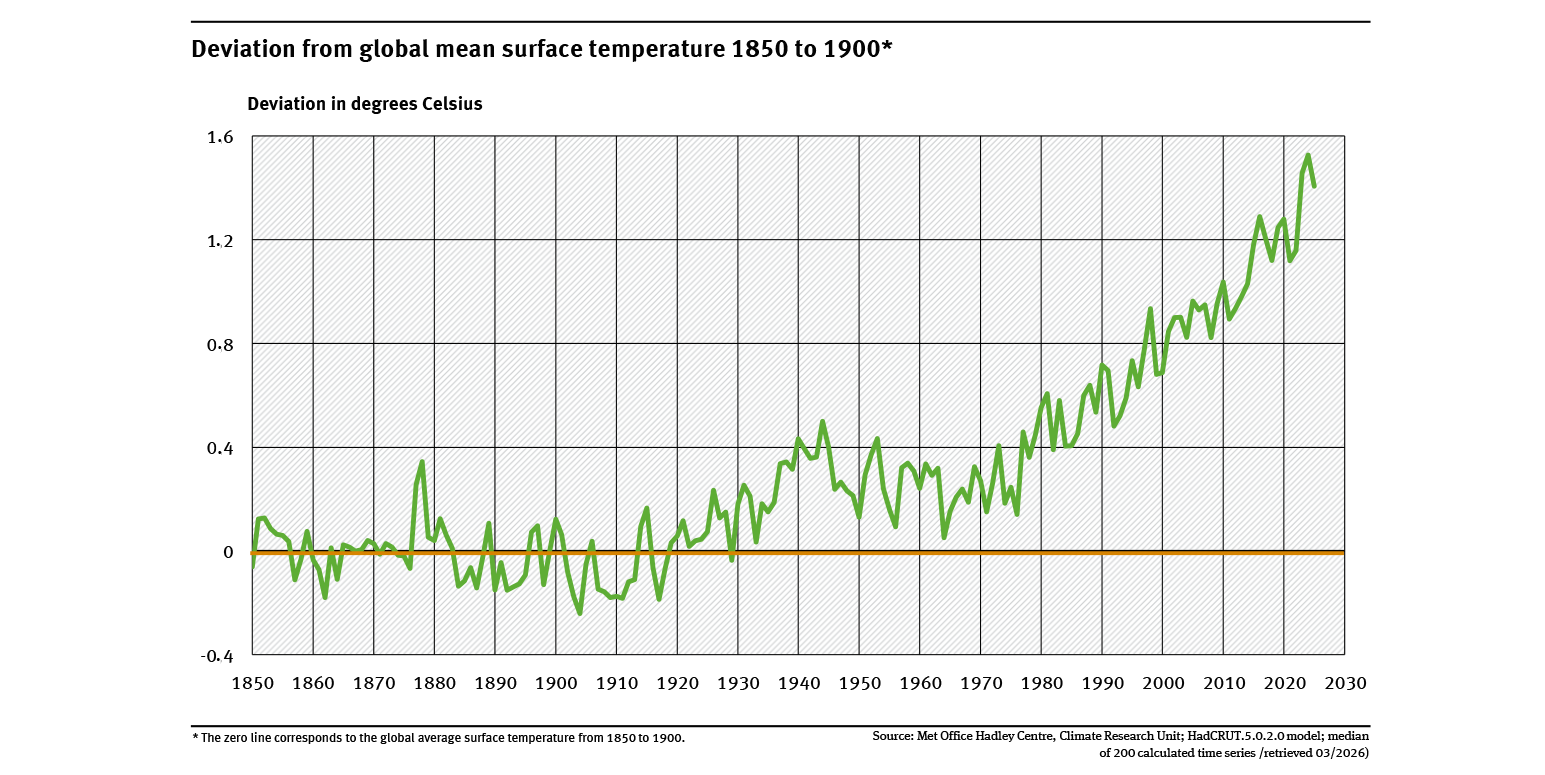
Deviation from global mean surface temperature 1850 to 1900
- Klima
- Diagramme
- Umwelt-Indikatoren
- Daten und Tabellen

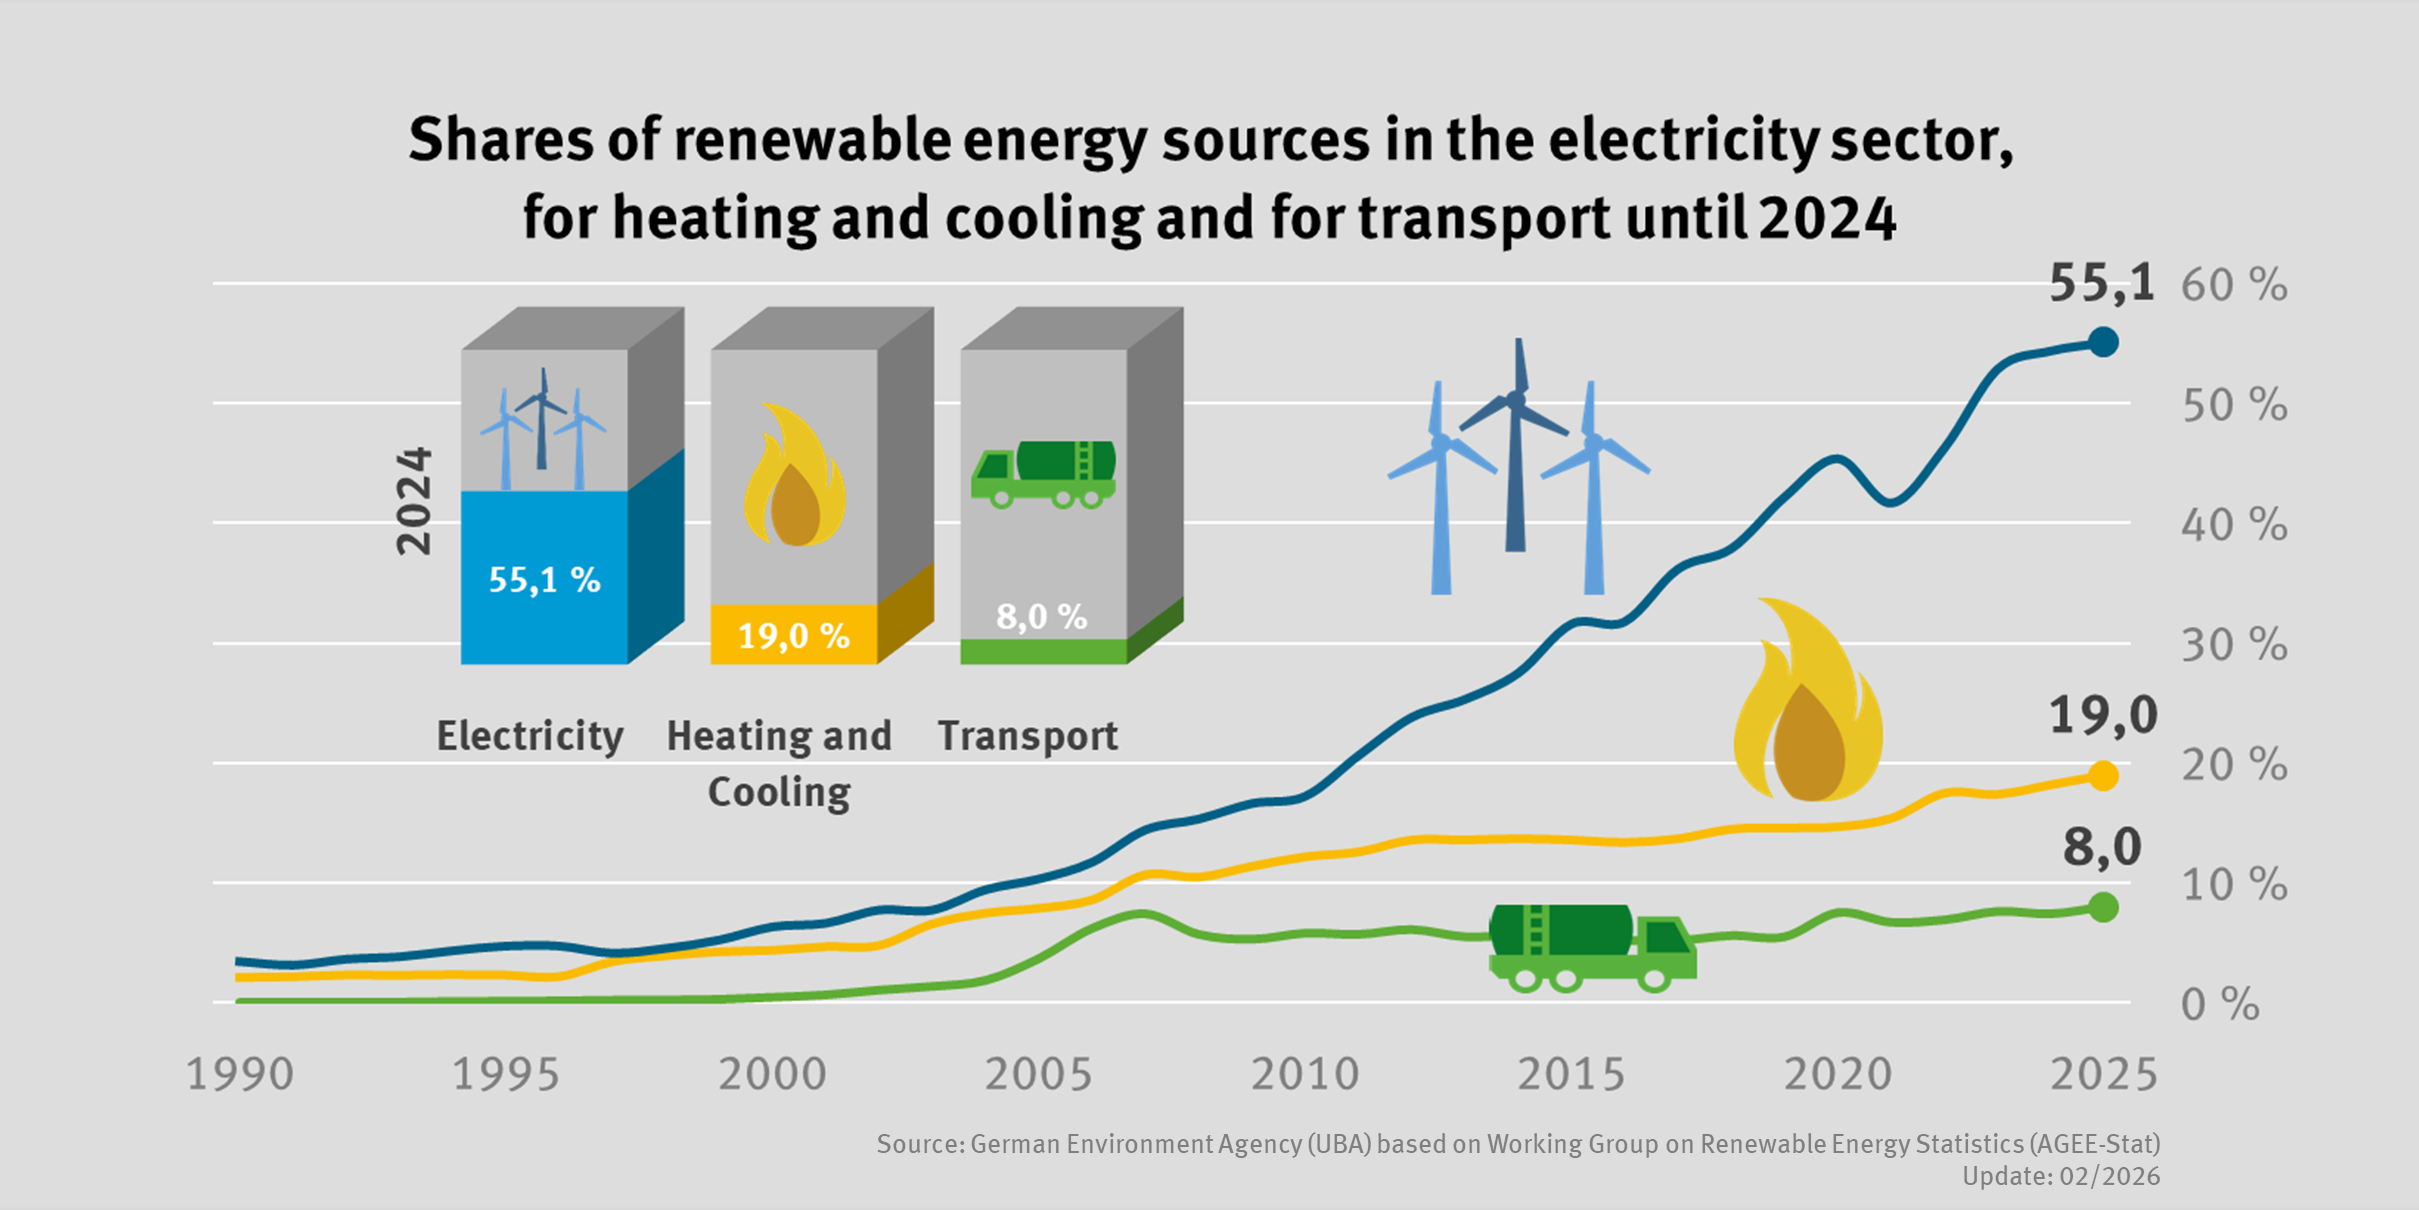
Development of renewable energy shares for electricity, heat and transport
- Energie
- Infografiken
Export data

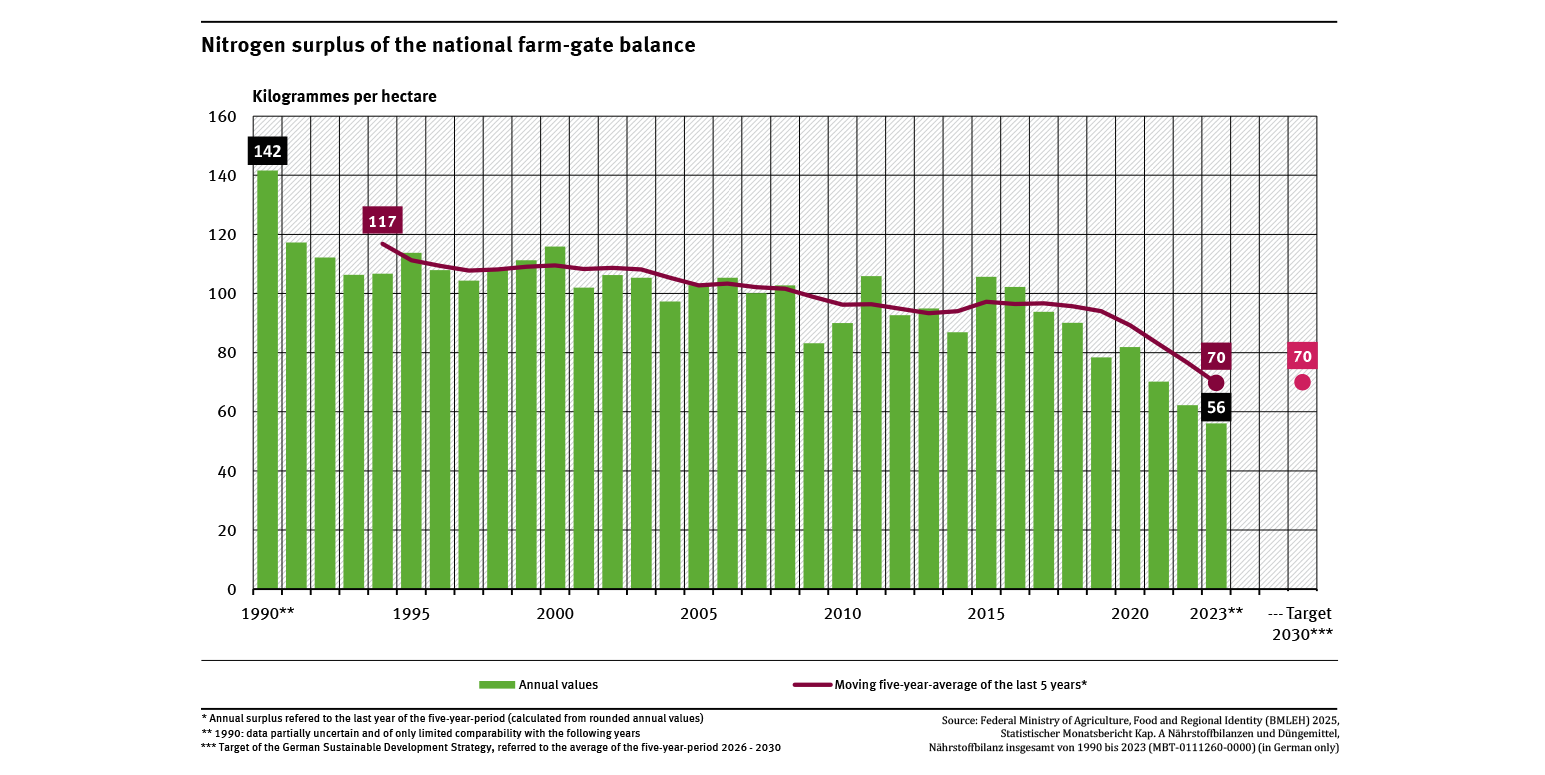
Nitrogen surplus of the national farm-gate balance
- Fläche, Boden, Land-Ökosysteme
- Land- und Forstwirtschaft
- Diagramme
- Umwelt-Indikatoren
- Daten und Tabellen

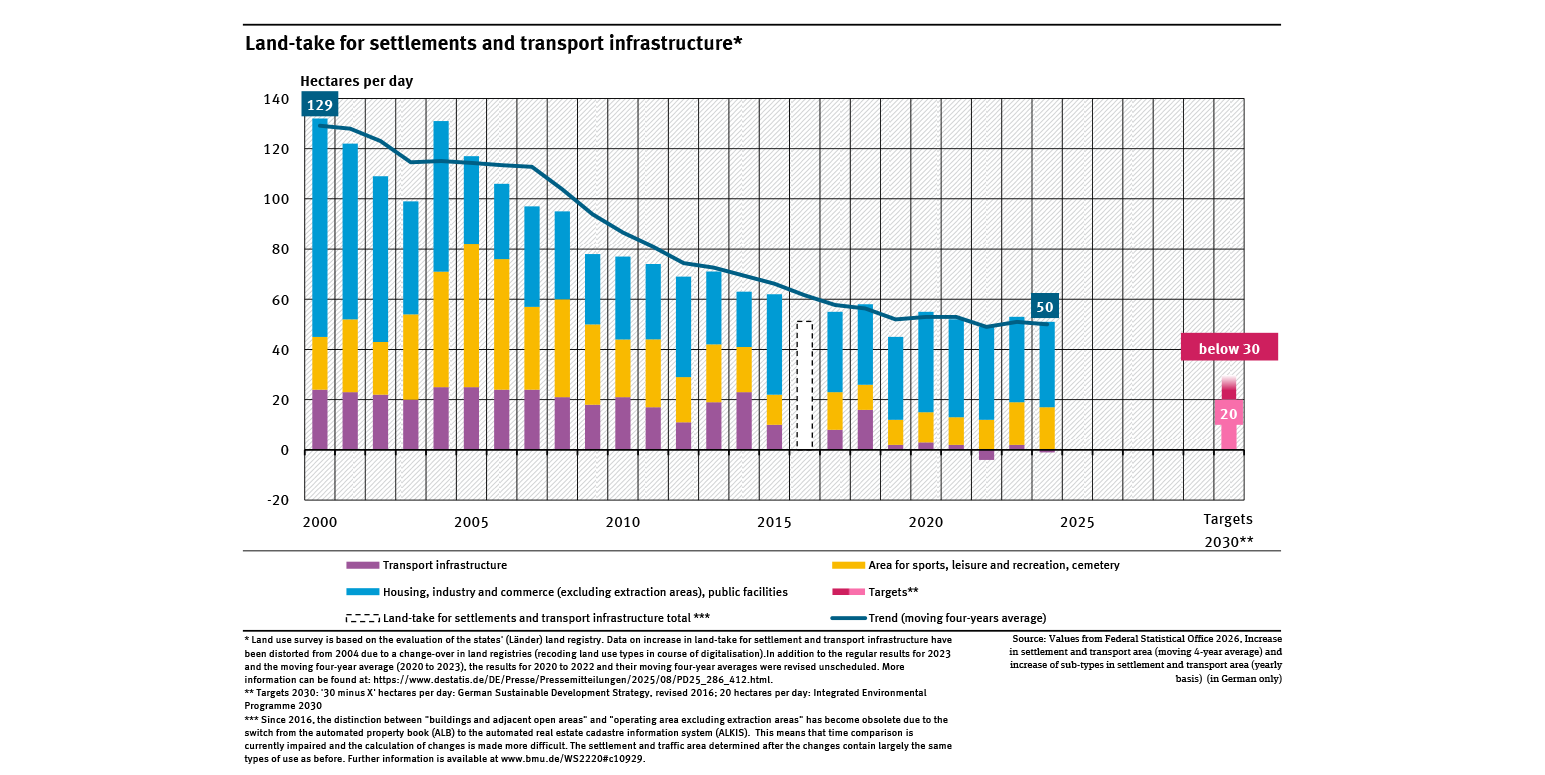
Land-take for settlements and transport infrastructure
- Fläche, Boden, Land-Ökosysteme
- Diagramme
- Umwelt-Indikatoren
- Daten und Tabellen

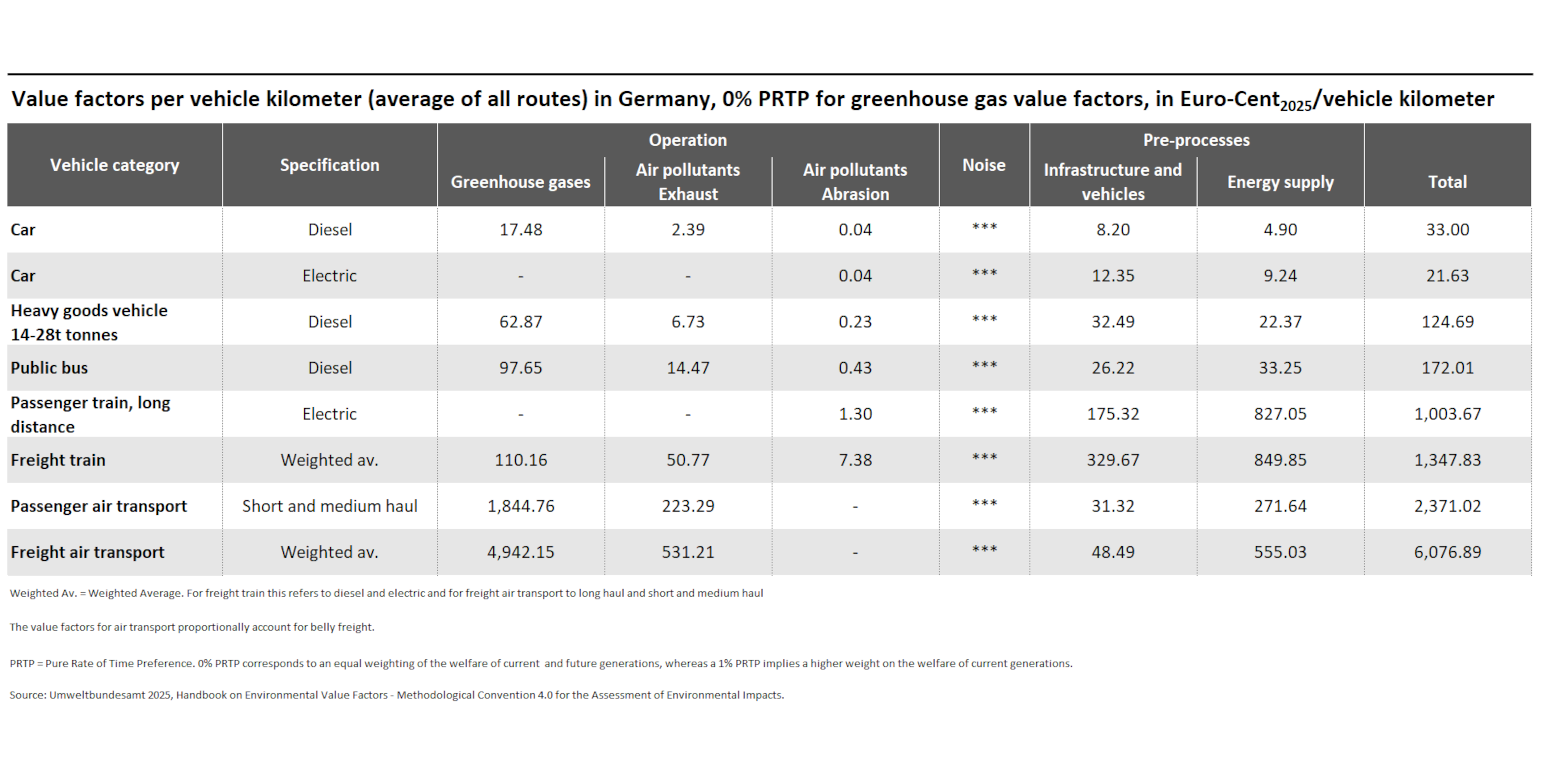
Value factors per vehicle kilometer for selected modes of transport
- Verkehr
- Daten und Tabellen

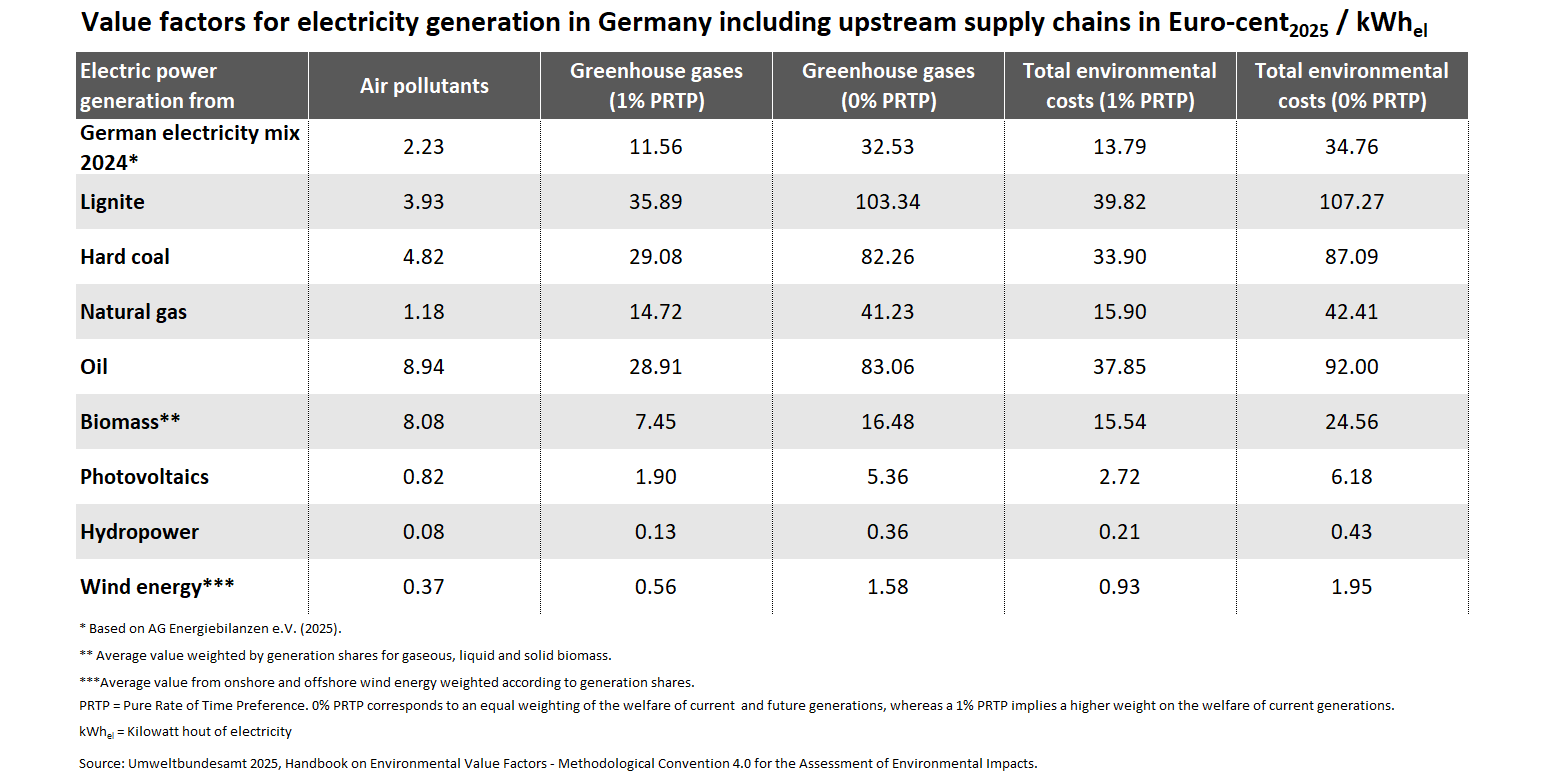
Value factors for greenhouse gas & air pollution related environmental impacts from power generation
- Klima
- Luft
- Daten und Tabellen