Data Search

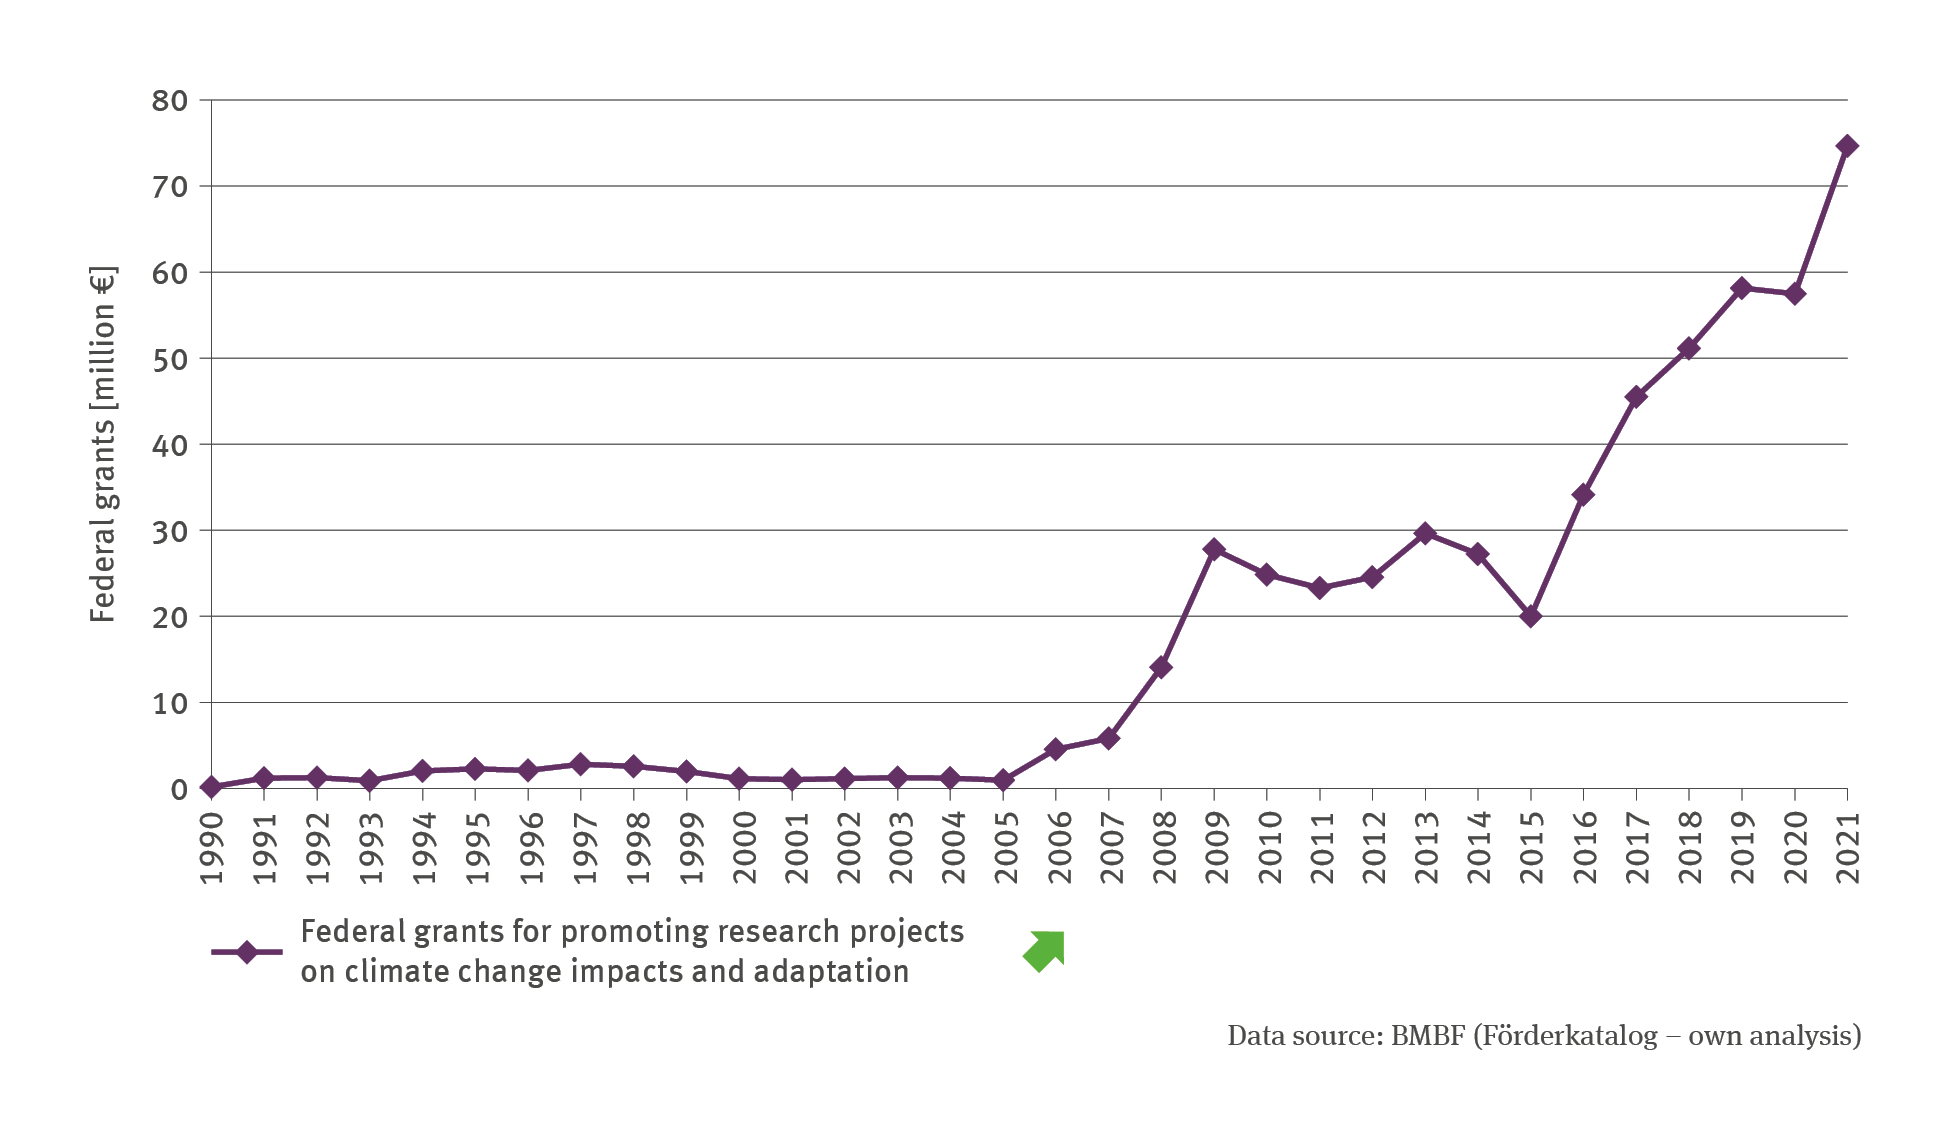
HUE-3: Federal grants for promoting research projects on climate change impacts and adaptation
- Klima
- Diagramme
Export data


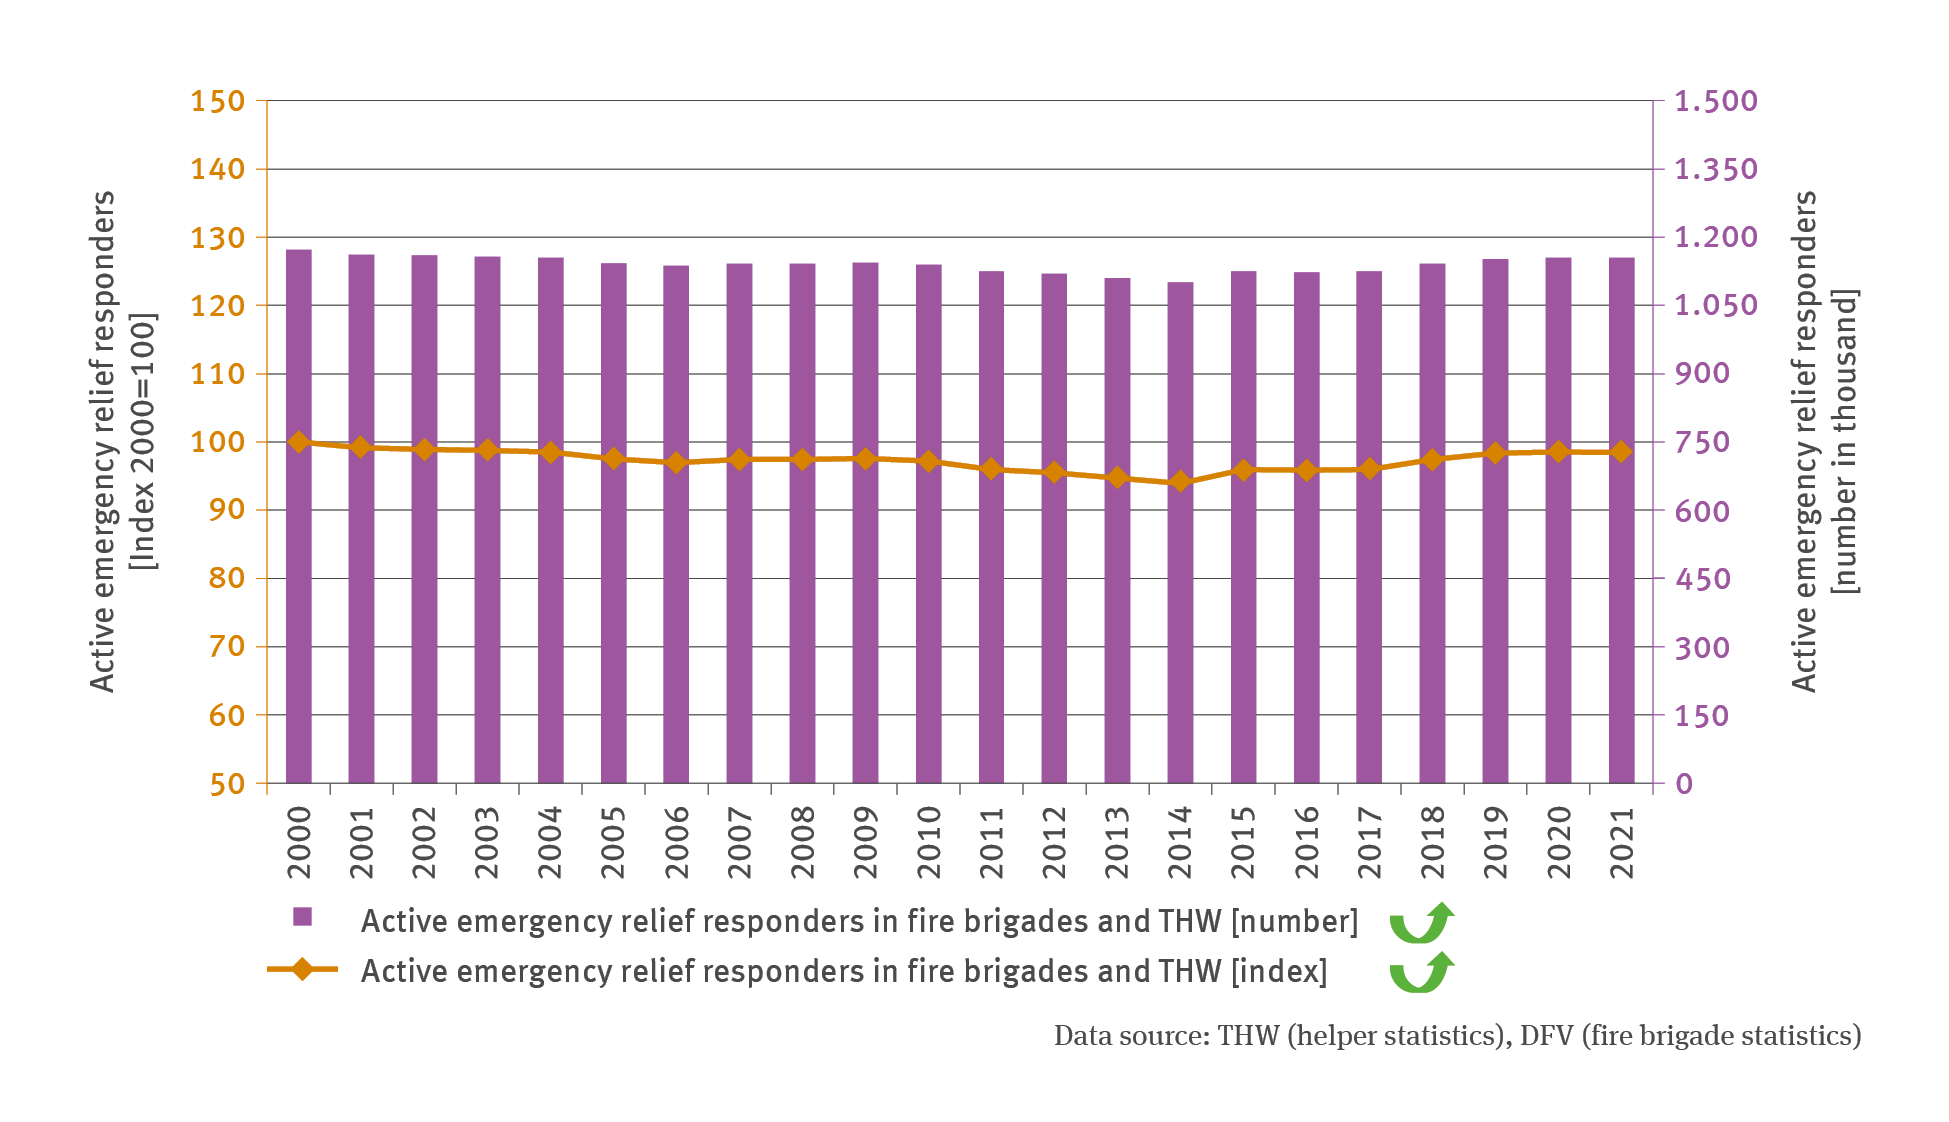
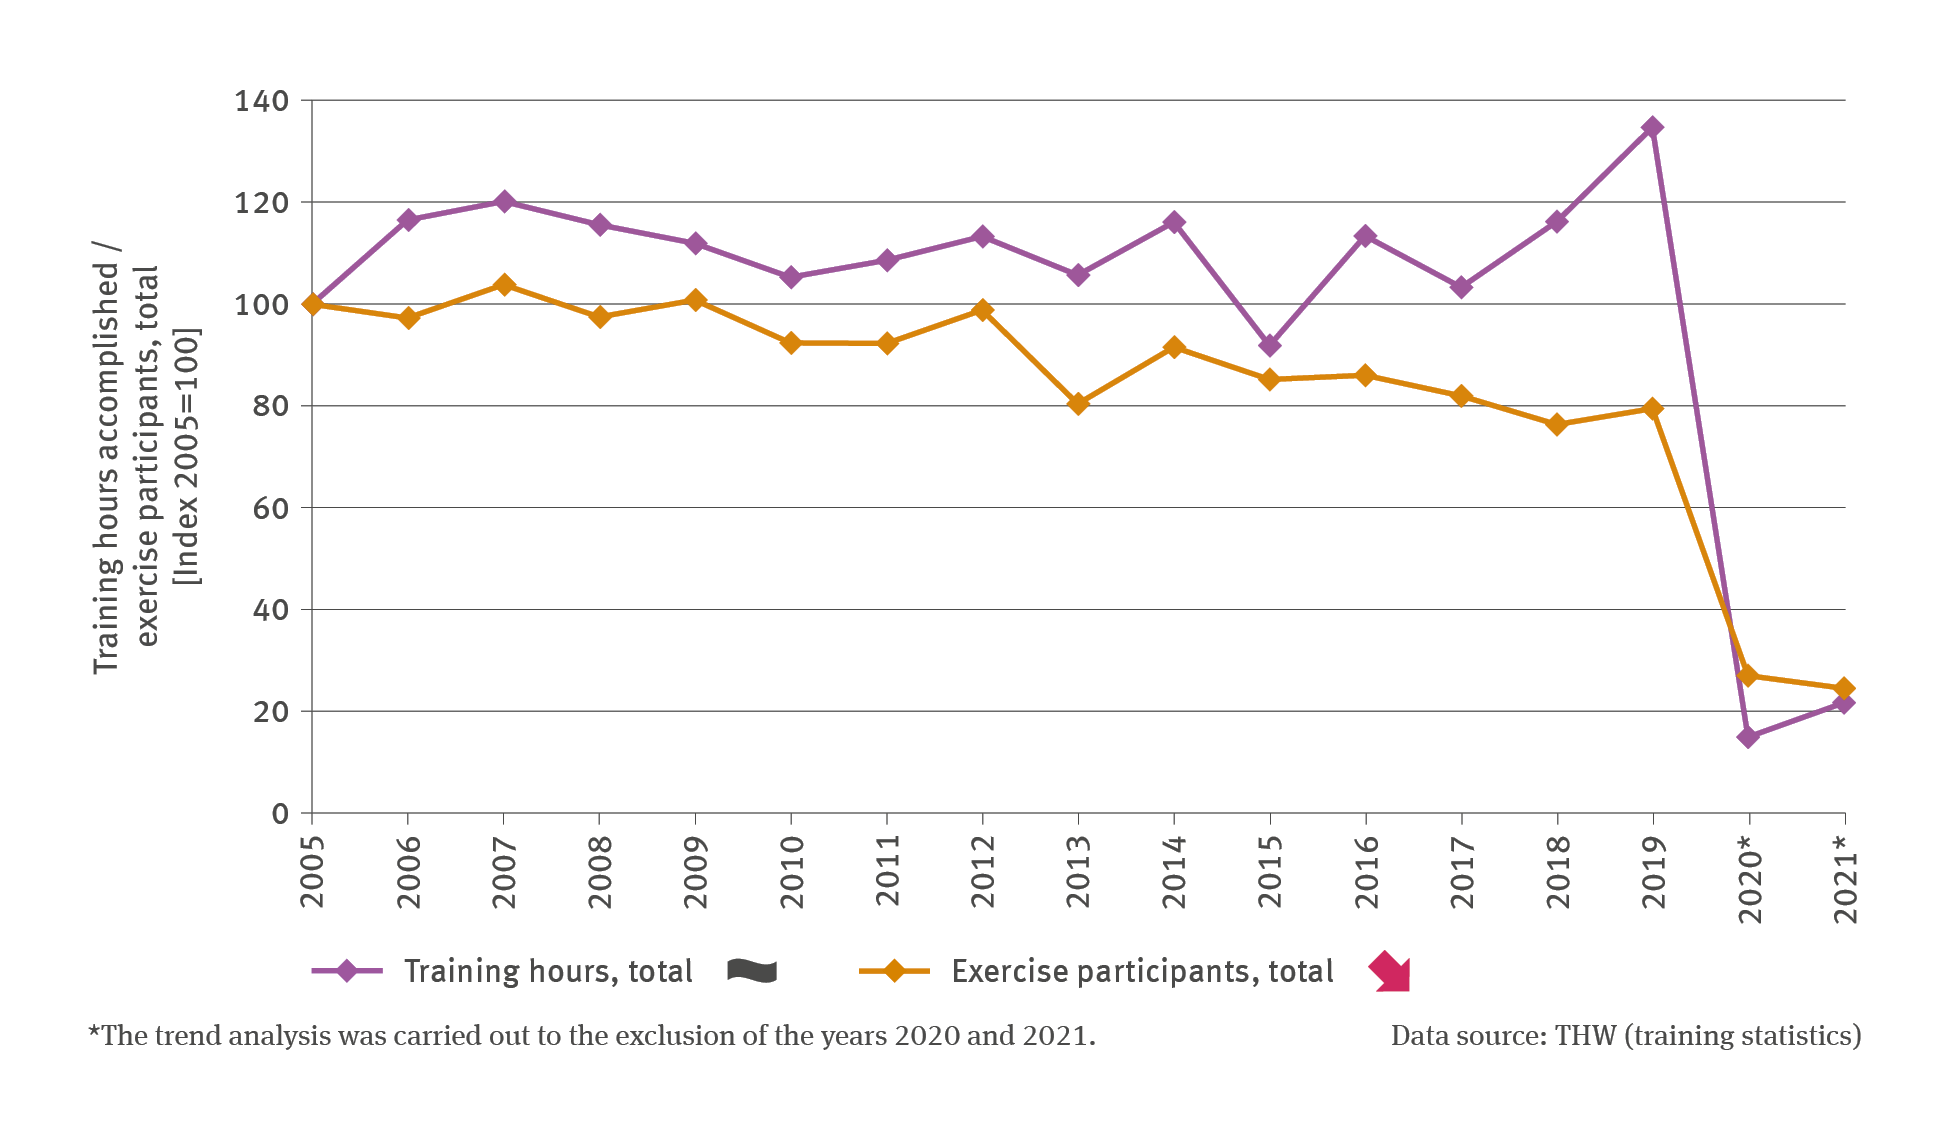
BS-R-4: Active emergency relief responders in civic protection
- Klima
- Umwelt und Gesundheit
- Diagramme
Export data


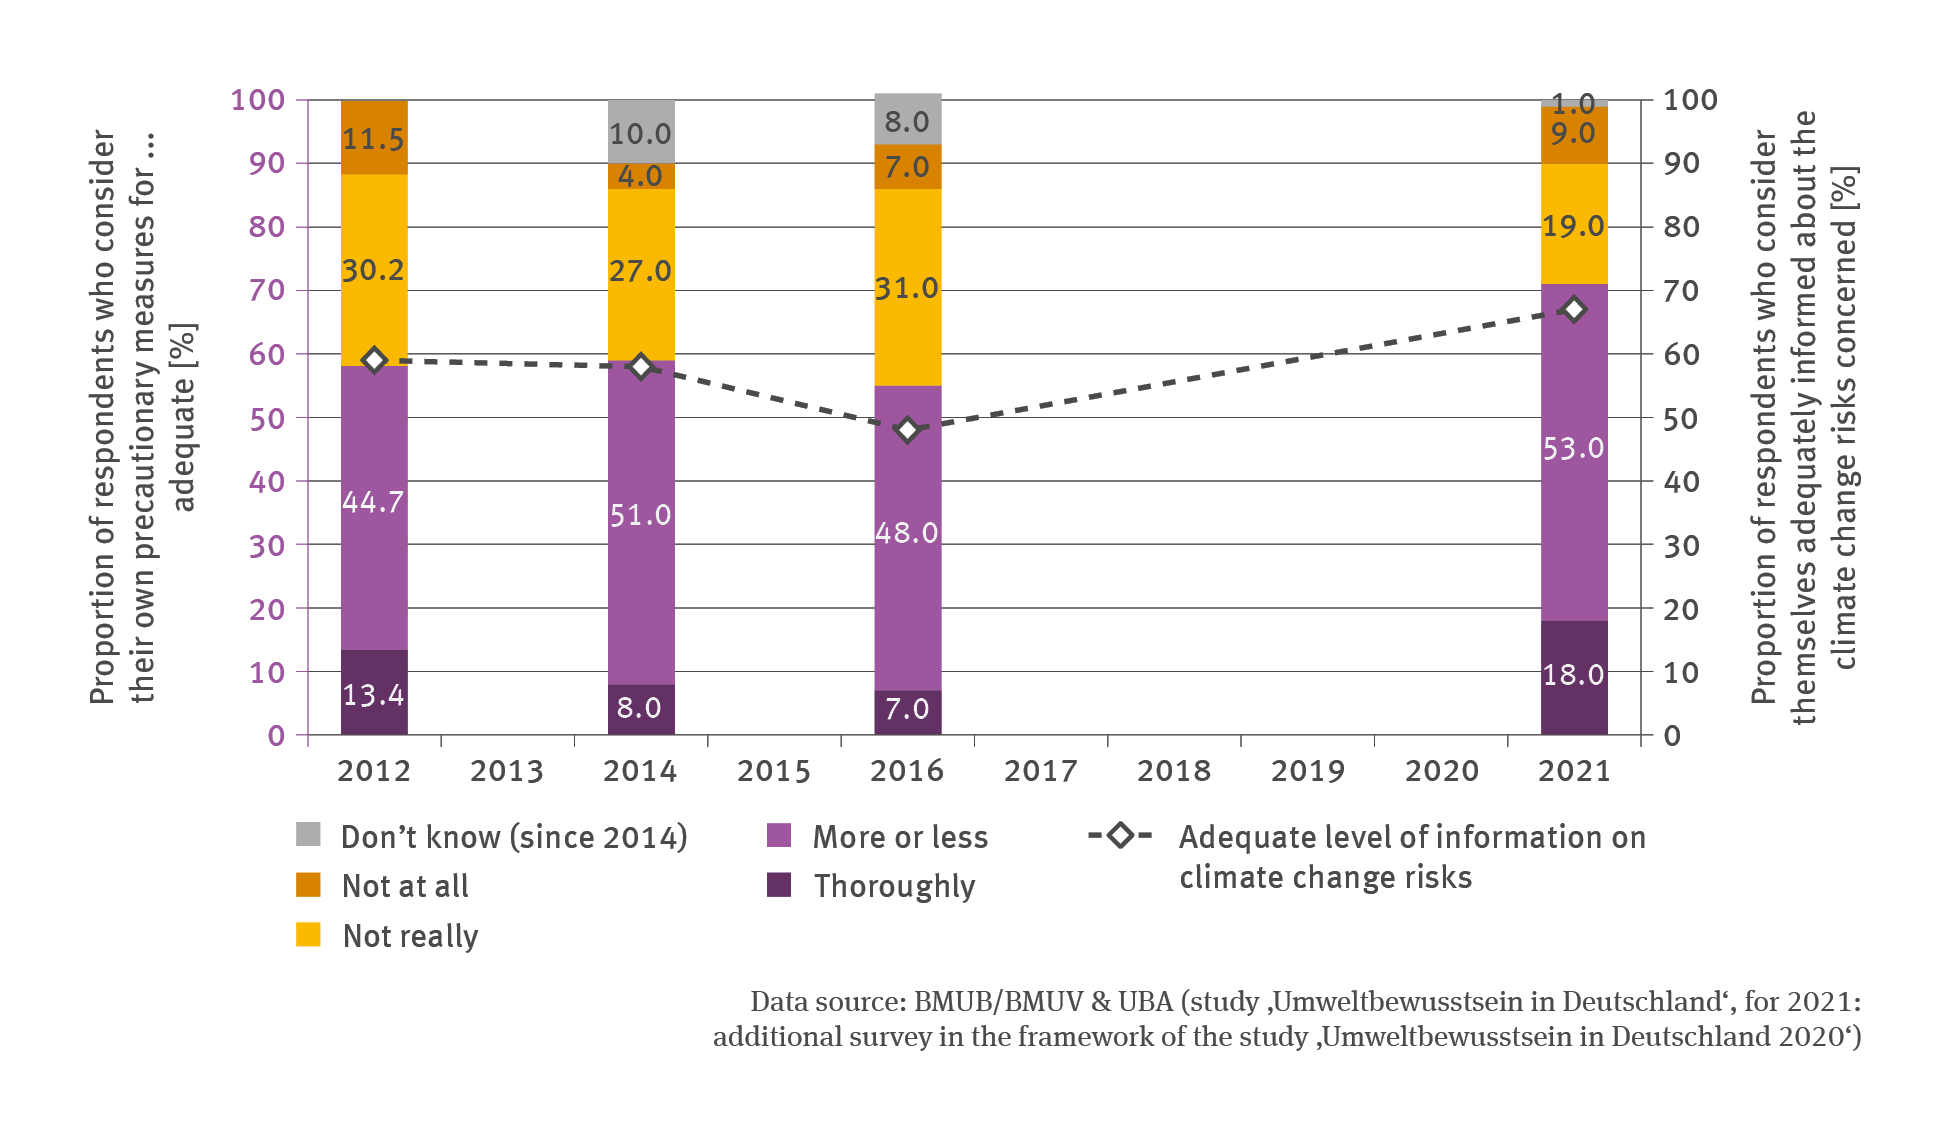
BS-R-1: Information on how to act in a disaster situation
- Klima
- Umwelt und Gesundheit
- Diagramme
Export data

BS-I-1: Person hours required for dealing with damage from weather-related incidents
- Klima
- Diagramme
Export data

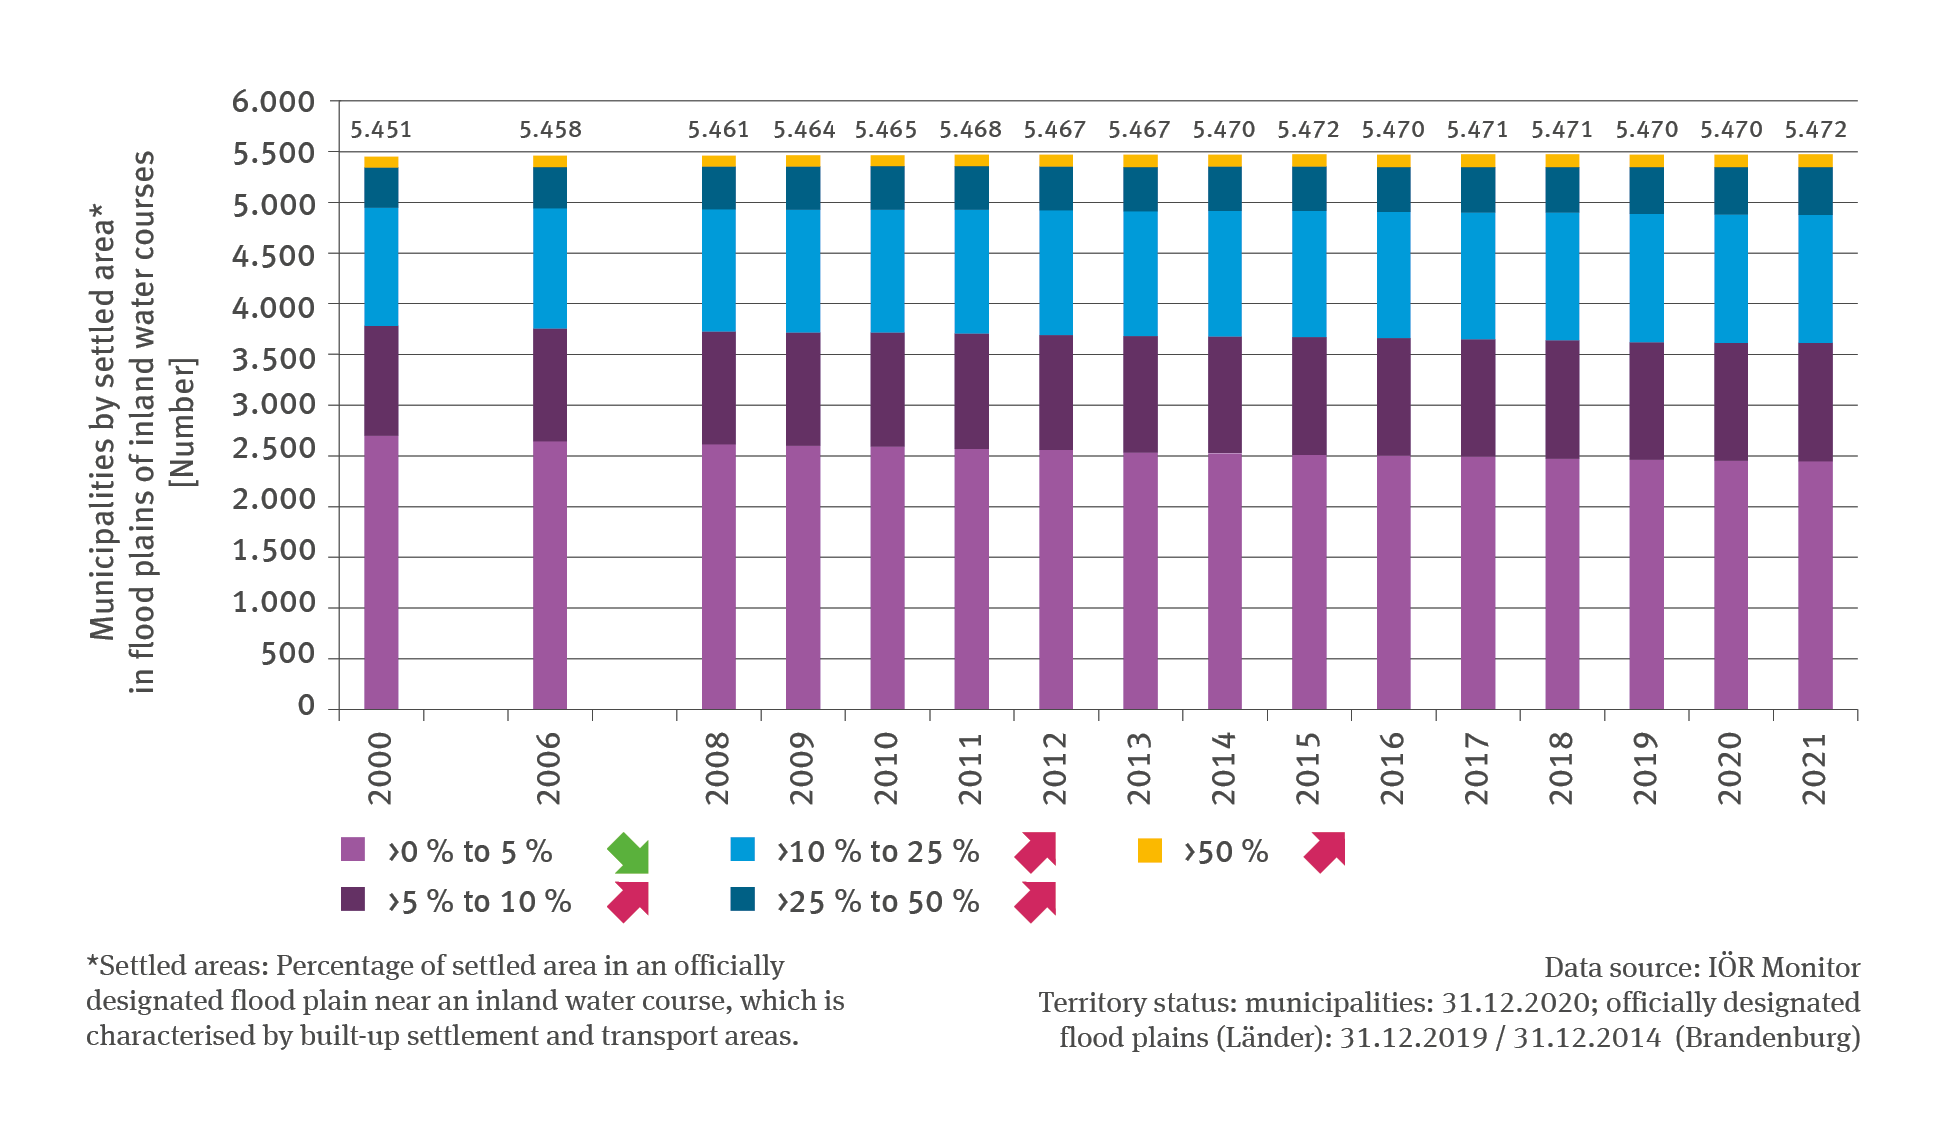
RO-R-6: Land use for settlements in officially designated flood plains
- Klima
- Fläche, Boden, Land-Ökosysteme
- Diagramme
Export data

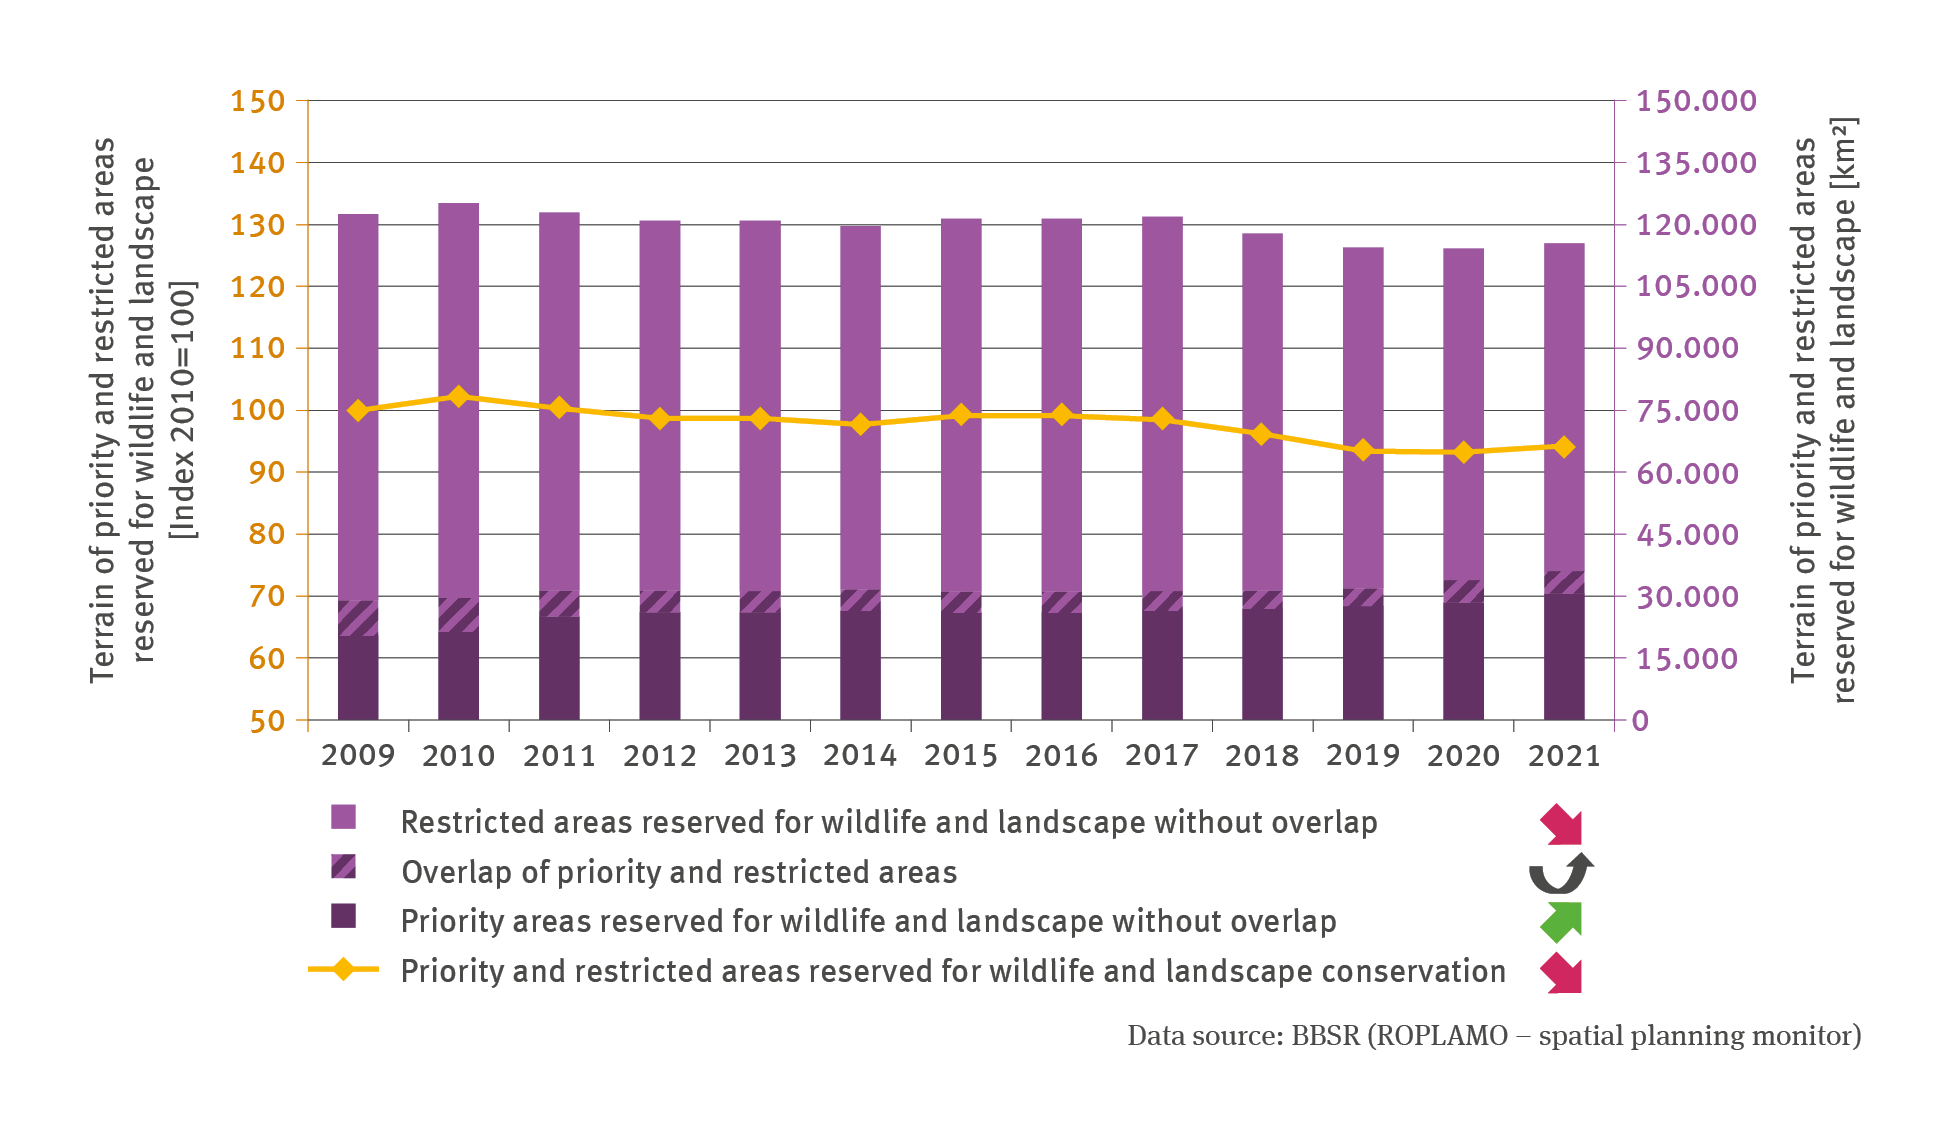
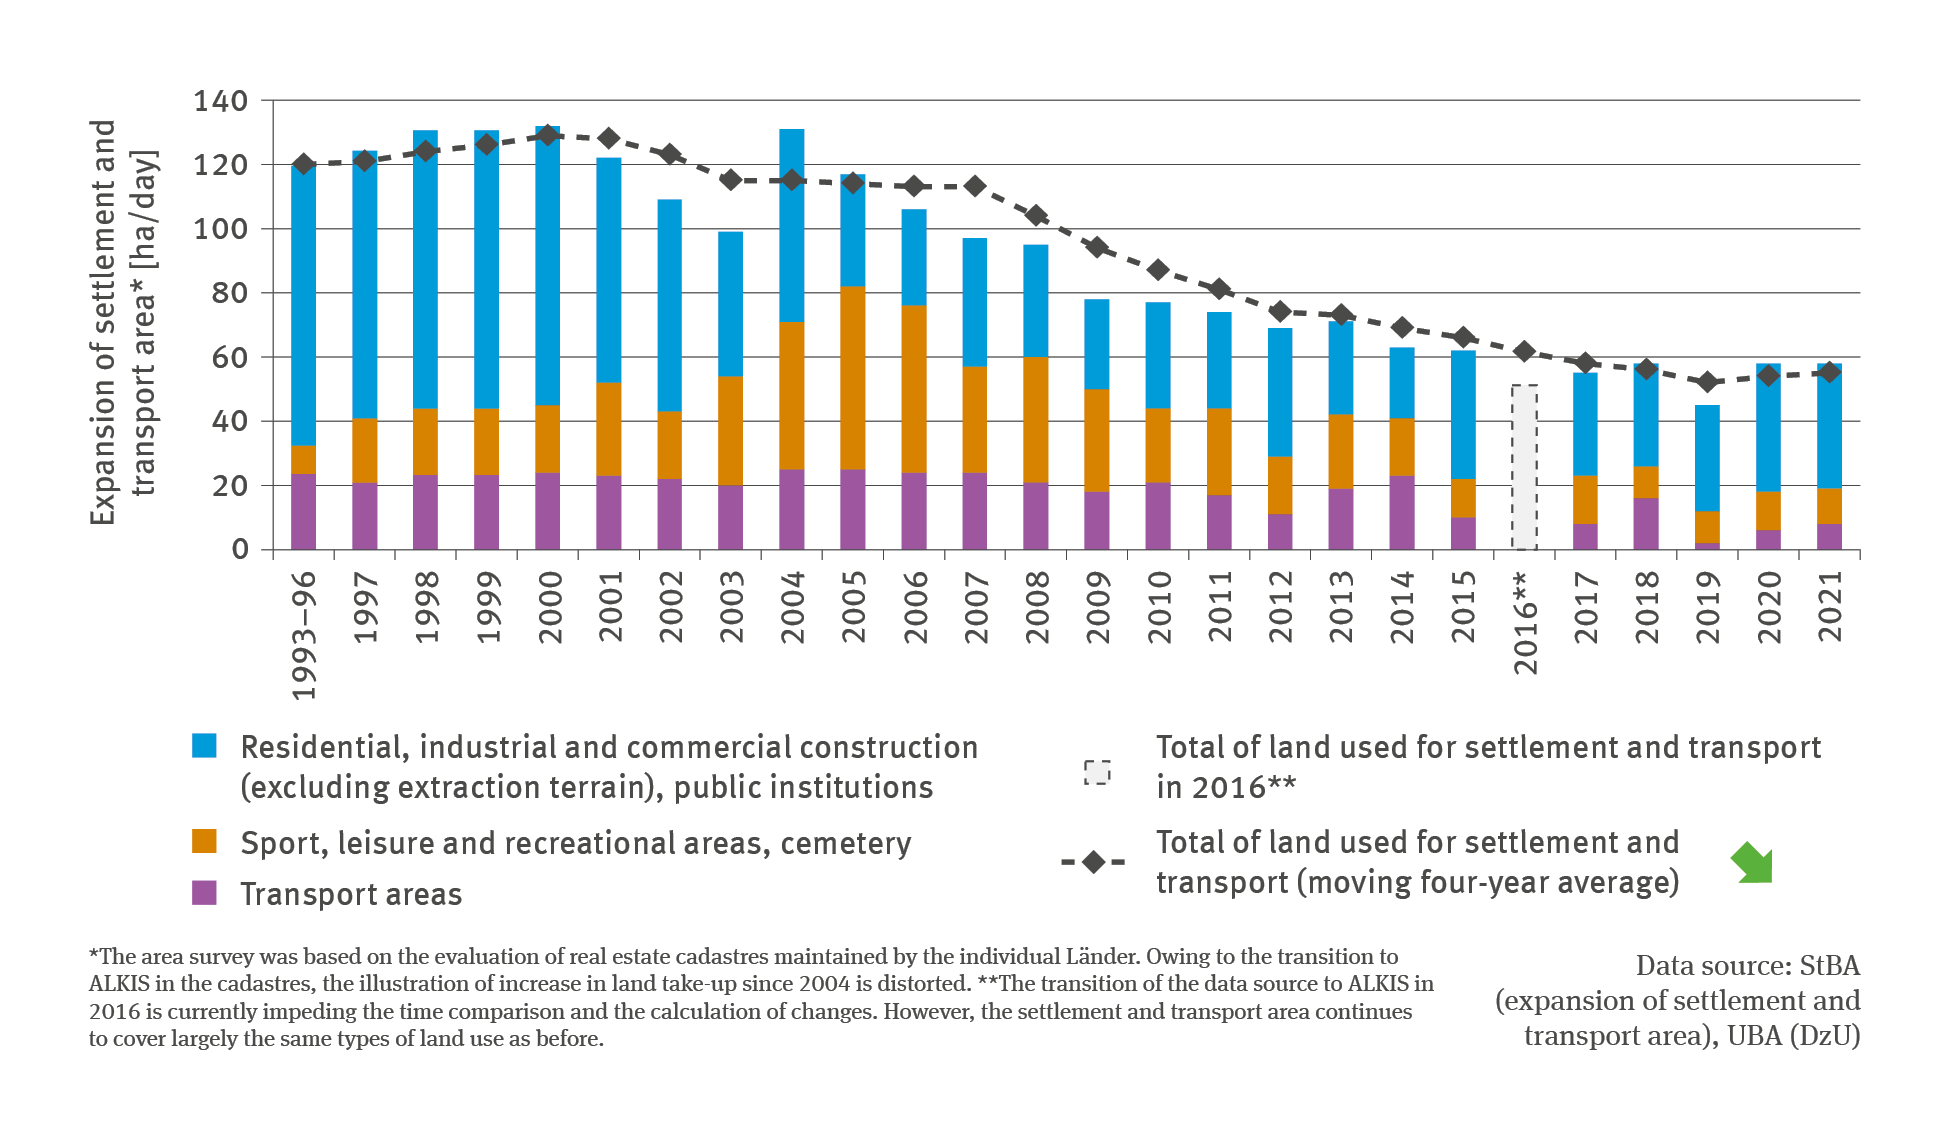
RO-R-5: Increase in settlement and transport areas
- Klima
- Fläche, Boden, Land-Ökosysteme
- Verkehr
- Diagramme
Export data