Nutrients in watercourses

Nitrogen and phosphorus are nutrients for aquatic plants (algae, macrophytes). Their high concentration causes excessive growth especially of algae (Eutrophication). Rivers transport nitrogen and phosphorus into lakes and North sea and Baltic sea and influence its nutrient concentration.

Table of Contents


Trend of nutrient concentration

The high levels of nutrient concentration is a reason for failing to achieve a “good ecological status”. There are changes to the natural biotic community.

Total phosphorous and nitrogen emissions into Germany’s watercourses have been substantially reduced thanks to the introduction of phosphate-free detergents, the closure of production facilities in the new Länder, the construction and modernisation of public and industrial wastewater treatment plants (construction of phosphate precipitation plants), and the greater number of households connected to wastewater treatment facilities. Today, agriculture is the principal source of nutrient loads in waterbodies, together with public wastewater treatment plants, power plants, transport and industrial operations.

The reduction in inputs is reflected in decreased concentration levels in rivers and streams. Concentrations of phosphorus and nitrogen compounds are influenced by flow rate. Flow rate numbers are not available for all monitoring sites, and therefore the measurement values cannot always be standardised to the flow rate. For hydrology, for example, values over ten years are combined into long-term series. This method is subsequently applied to the concentrations. The 90-percentile values for the three ten-year periods (1986-1995, 1996-2005 and 2006-2015) at LAWA monitoring sites for which data is available for at least five years are averaged out, so that changes in concentrations are less attributable to fluctuations in flow rate and more to inputs. Comparing the first two ten-year periods 1986-1995 and 1996-2005 reveals a sharp drop in phosphorus and ammonium concentrations, both in terms of the intensity of the decrease and the number of monitoring sites. While this continued in the third period in the case of ammonium, the decrease in phosphorus concentrations tailed off, and at some monitoring sites even increased slightly, but remained below the concentrations of the first period. Concentrations of nitrate decreased more slowly.

Concentrations of different nutrients
Change in concentration levels of total phosphorus, ammonia nitrogen and nitrate nitrogen
Source: German Environment Agency based on data supplied by LAWA trendklassen_e.pdf
 

Evaluation at LAWA monitoring sites 1982-2016

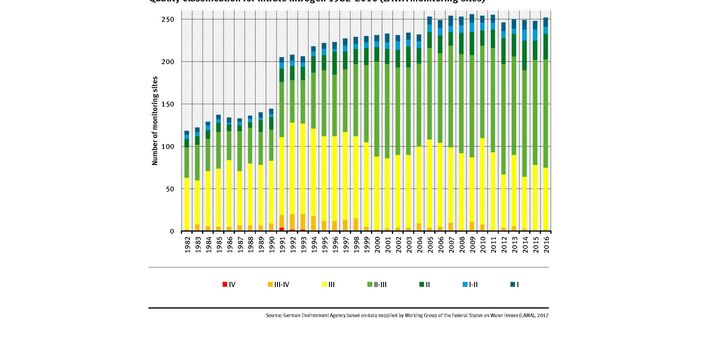
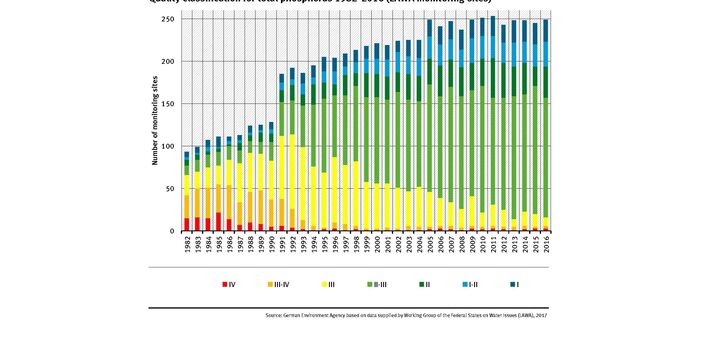
Evaluation of nutrient data is based on a chemical water quality classification developed by Working Group of the Federal States on Water Issues (LAWA). The chemical water quality classification has classes from I (no anthropogenic pollution) until IV (excessively polluted). The target is class II (or better).

The monitoring sites within the LAWA network of monitoring sites for watercourses registered (see graphs):

Total phosphorus

The part of measuring sites indicated excessive pollution (class IV) until heavy pollution (class III) decrease significantly since the early 1990s. The part of measuring indicated critical pollution (class II-III) increase significantly. There is also a light increase of measuring sites indicated moderate (class II) until no anthropogenic pollution (class I). In 2016, the annual average of 37 % of the measuring sites is below the target (class II) of total phosphorus, the annual average of 57 % of the measuring sites is in range of class II-III and 4 % in range of class III. The 5 measuring sites in the transitional waters and the measuring site on watercourse Emscher rank among class III-IV and IV.

Nitrate nitrogen

The part of measuring sites indicated excessive pollution (class IV) until heavy pollution (class III) decrease since mid-1990s. The part of measuring indicated critical pollution (class II-III) increase. Numbers of measuring sites indicated moderate (class II) until no anthropogenic pollution (class I) is more unchanged. For nitrate nitrogen, the 90 percentile of 19 % of the measuring sites is below 2.5 mg N/l (class II), 51 % of the measuring sites rank in class II-III, 29 % in class III and 1 measuring site in class III-IV in 2016. Since 2006 there is no 90 percentile of measuring site greater than 20 mg N/l (class IV).

Ammonia nitrogen

The part of measuring sites indicated excessive pollution (class IV) until critical pollution (class II-III) decrease significantly since the early 1990s. There is also a high increase of measuring sites indicated moderate (class II) until no anthropogenic pollution (class I). The annual average of 86 % of the measuring sites is below the target (class II) of ammonia nitrogen, 12 % of the measuring sites rank in class II-III, 1 % in class III and 1 measuring site in class III-IV and IV.

<>
 

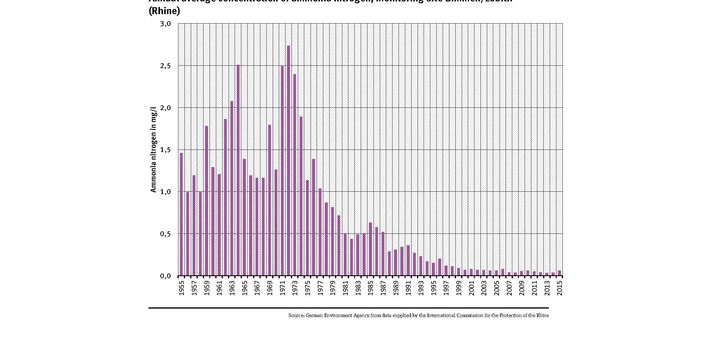
Long-term statistical series 1955-2015 (Bimmen/Lobith/Rhine)

Long-term statistical series (1955-2015) from the Bimmen/Lobith monitoring station on the Rhine (German-Dutch border) exist on contents of orthophosphate-phosphorus, ammonia nitrogen and nitrate nitrogen (see graphs). Annual mean values for 1955-1975 show that average concentrations of orthophosphate initially increased sharply from about 0.05 to 0.4 mg P/l, and to some 2.5 mg N/l for ammonia. Average concentrations nitrate rose from roughly 2 to 4 mg N/l between 1955 and 1985. Since mid-1970s average concentrations of ammonia nitrogen decreased and are now at 0.06 mg N/l, average concentrations of orthophosphate phosphorus decreased since mid-1980s and are now at 0.06 mg P/l, the average concentrations of nitrate nitrogen are since 2010 in the middle at 2.3 mg N/l.

<>
Share:
Article:
Printer-friendly version
Tags:
 water  watercourses  river  Rhine  nutrient  nitrate  phosphorus  ammonia nitrogen