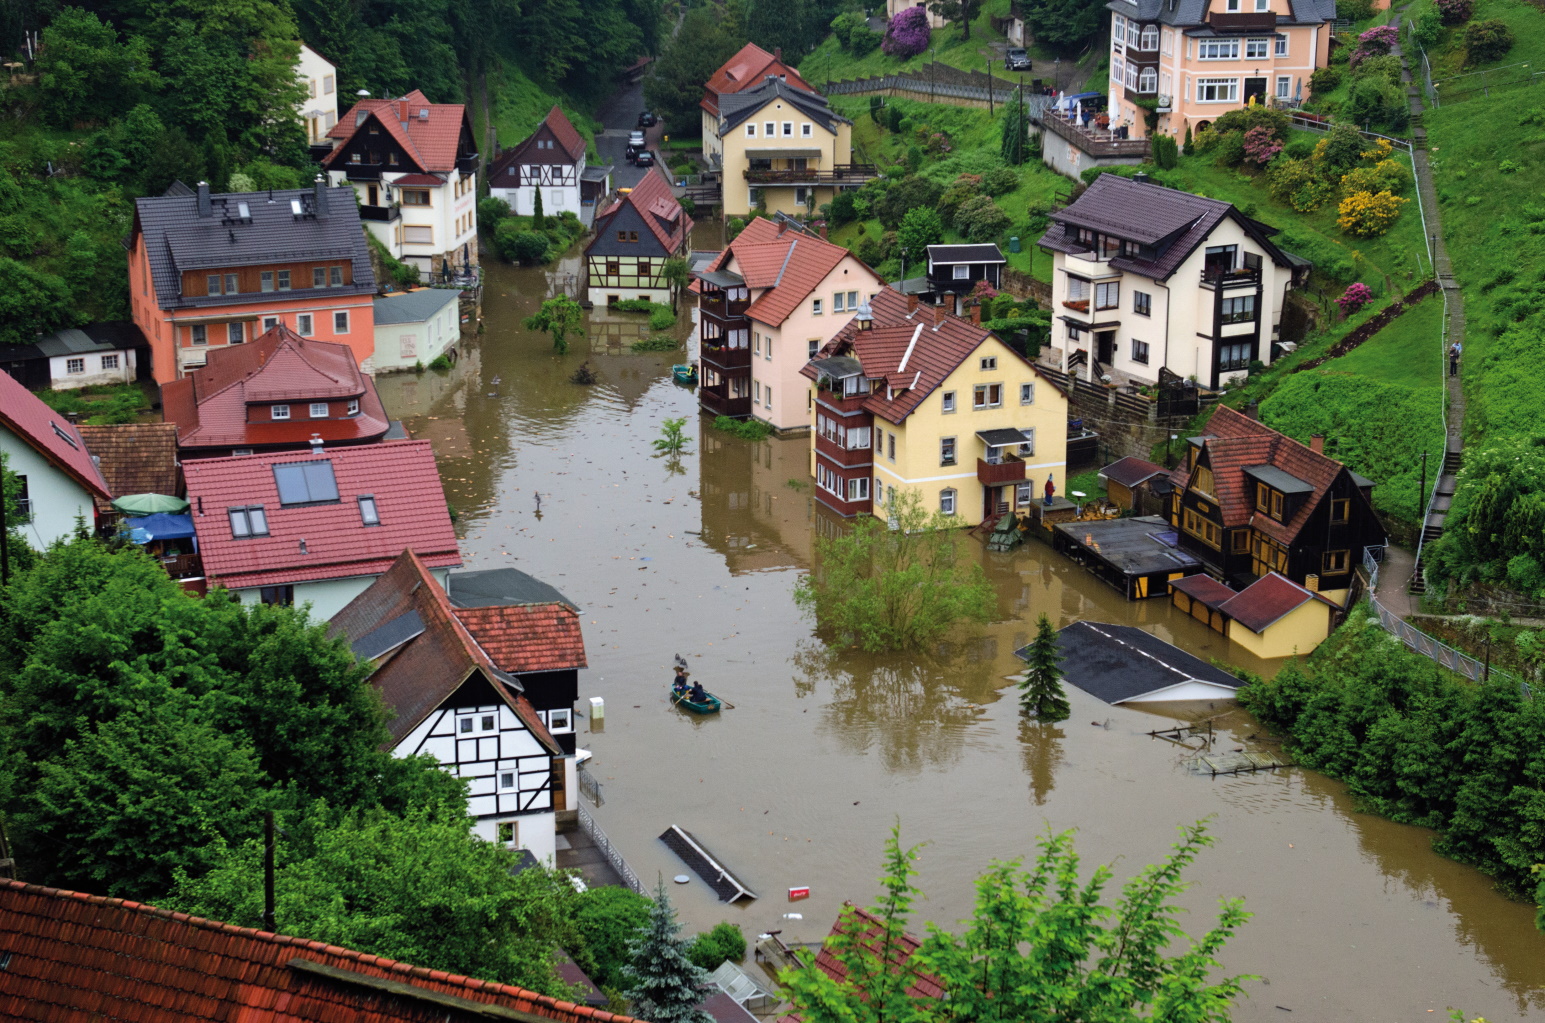
Compared to the variations and changes in mean discharge values (cf. Indicator WW-I-3) there is greater awareness among the public of flood events because they have an immediate impact on human activities as they can cause personal injury and material damage.
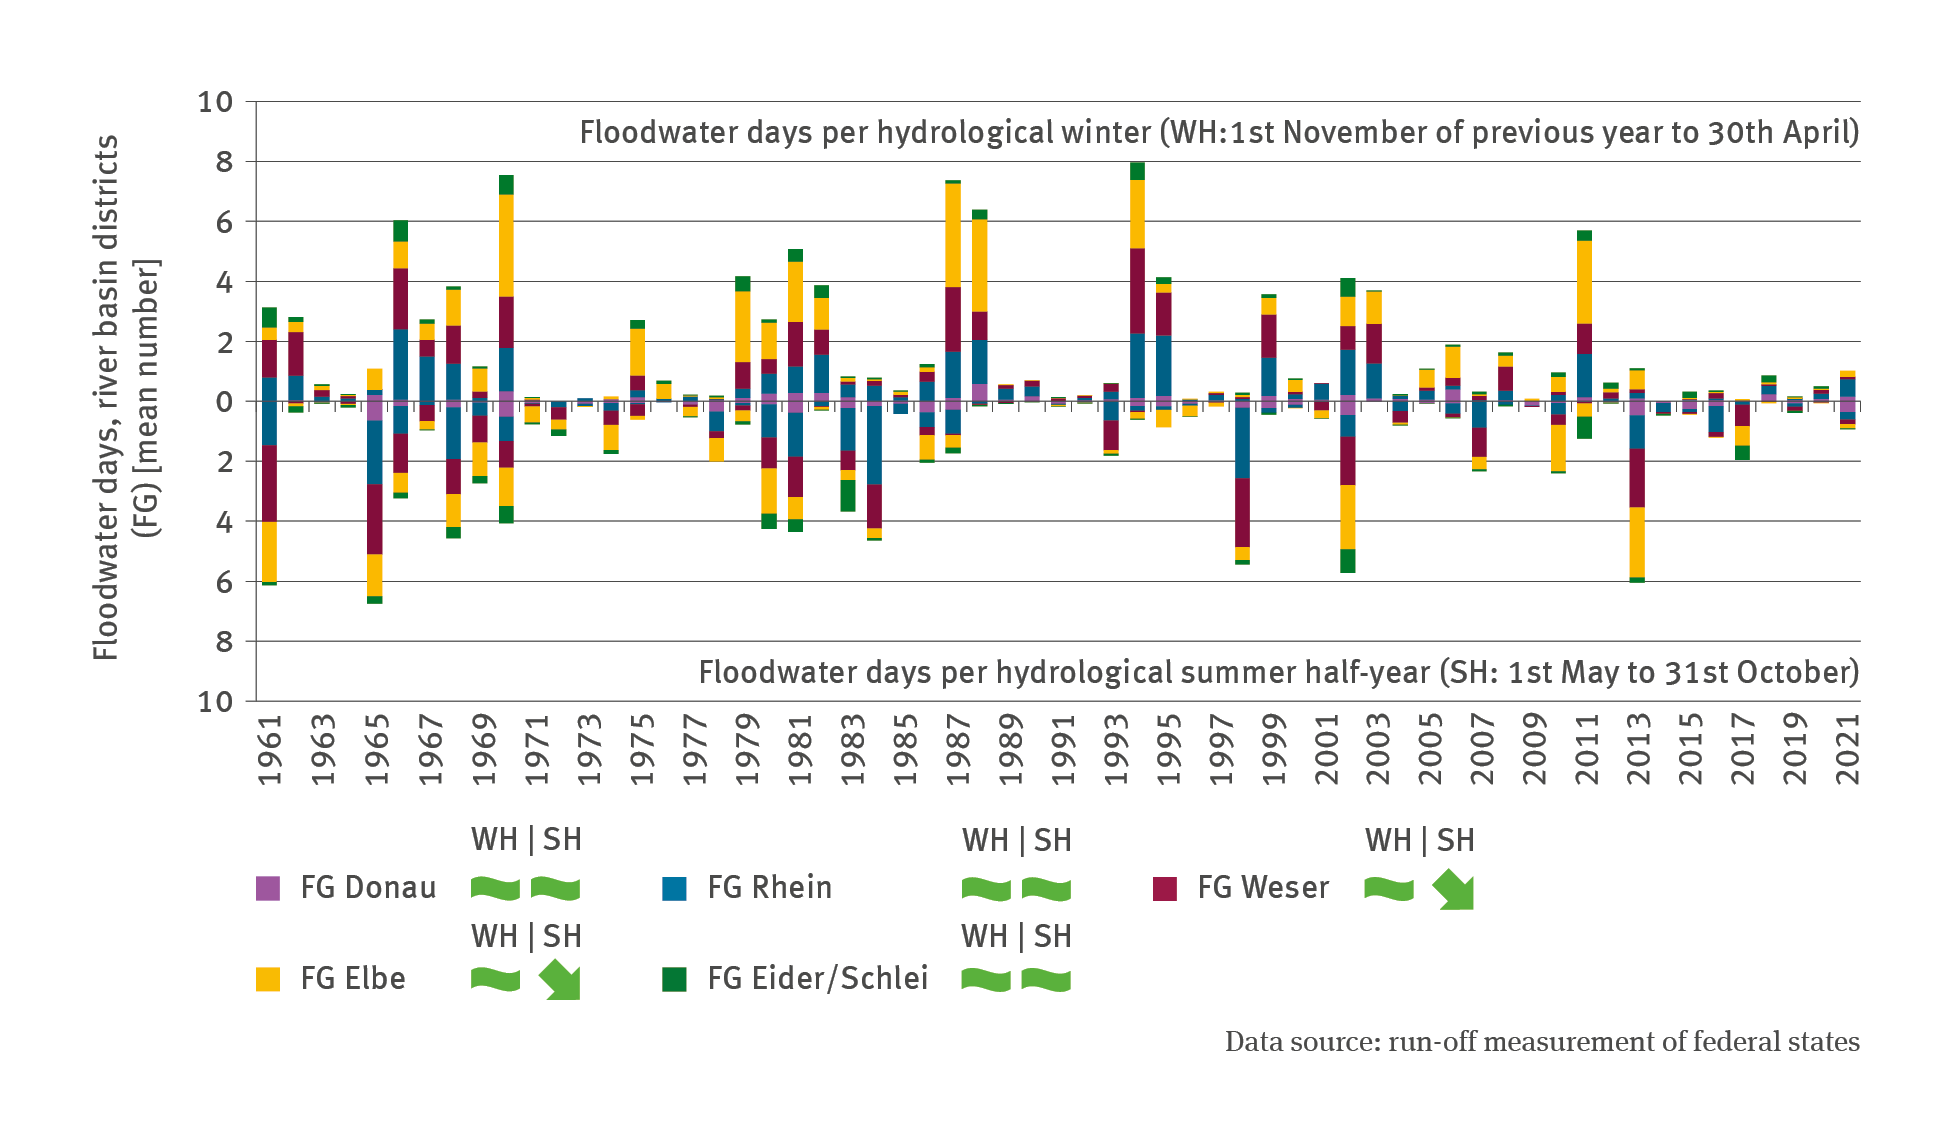
The time series starting in 1961 clearly indicates that the floodwater regime varies considerably from year to year. This is true for both the extent of flood events and for their seasonal distribution. For the purpose of the indicator, floodwater days at gauging stations distributed across 75 of Germany’s river basins were evaluated. Floodwater days are days on which the mean daily discharge value is higher than the mean floodwater discharge value (MHQ) calculated for the reference period 1961-1990. The MHQ is calculated separately for the hydrological winter half-year (1st November of the previous year to 30th April) and the summer half-year (1st May to 31st October) on the basis of the highest discharge values (HQ) of individual half-years respectively.
When averaging the number of floodwater days measured at all gauging stations considered in a river basin, it becomes clear at which locations and in which years the flooding scenarios were concentrated. Flood events can be triggered by regionally limited weather conditions. For the summer season, this typically refers to rainfall that continues for several days and to heavy-rain events that can frequently be very localised. In the winter season flooding is caused by precipitation continuing for several days or even weeks and frequently also by thaw combined with rainfall, because under these circumstances discharge of great volumes of water may set in within a few hours.
Among the summer flood events that occurred since the turn of the millennium, the years 2002 and 2013 stand out. In August 2002 flooding in Germany was particularly prevalent in the Elbe and Danube areas. These events were caused by extreme rainfall continuing for days, which resulted in weeks of emergency operations in order to overcome the ensuing flood disaster. Likewise, flood events at the end of May and in early June 2013 were triggered by several days of rainfall. Apart from Germany and Austria, other countries in central and eastern Europe were particularly badly affected. The month of May 2013 is considered to be one of the months in which precipitation was highest since systematic meteorological records began. In 2017 the low pressure front Alfred led to several days of rain resulting in flooding in the region of the Harz mountains and associated foothills. Consequently, the Weser river basin was affected most strongly.
The most recent major winter flood event occurred in January 2011, with focal points again in the Elbe and Main areas, while other river basins were also affected. The flood event was preceded by a month (December) with comparatively high precipitation levels while, at a lower geographical level, substantial amounts of snow accumulated. This meant that considerable water-equivalent amounts were stored in the blanket of snow when suddenly a low-pressure area coming in from the Atlantic triggered a strong thaw in the second week of January, which led to rapid melting of the snow cover, even in the mountains. This period of thaw was followed immediately by several rain fronts resulting in prodigious amounts of precipitation.
The devastating flood disaster of July 2021 which caused the death of more than 180 people, and which affected, in particular, the Länder Rhineland-Palatinate and North Rhine-Westphalia, but also Bavaria and Saxony, is not reflected with extraordinarily high numbers in the indicator. This is because the indicator is intended to illustrate floodwater in regional river basins, thus utilising data concerning levels of medium-sized catchment areas (as far as possible unaffected by anthropogenic influences). As far as small-scale flood events or storm surges are concerned, the geographical density of the gauging stations considered is insufficient. For example the districts in Rhineland-Palatinate and North Rhine-Westphalia that were most severely affected are not sufficiently covered by the indicator. Data for the river Ahr, for instance, where the floodwater caused serious damage in its river basin, are not reflected in the indicator.
As indicated by the time series so far, the development of floodwater days indicates very few significant trends either for the summer or for the winter half-year in those river basins. The development of floodwater is always related to specific combinations of weather patterns; however, these have so far not occurred repeatedly – either systematically or regularly. The distribution of floodwater days impacting the hydrological winter and summer seasons has so far not indicated a trend either. The events occur in both half-year periods, albeit a little more frequently in winter. As far as the rivers Weser and Elbe are concerned, the number of flood events in summer is regressive. Those areas seem to be characterised by decreasing precipitation in summer, already affecting the flooding scenario.
Climate change cannot be accounted for by a single flood event. Atmospheric conditions and large-scale weather patterns which favour the accumulation of floodwater suggest a wide-ranging variability. In principle, warming enables the atmosphere to store more water vapour, that is to say, warming increases its ability to absorb moisture, thus increasing the potential for heavy rainfall. In future, westerly winds might increase in winter; likewise the frequency and intensity of so-called Five B (Vb) weather front trajectories might increase in summer. In these kinds of weather conditions, low-pressure areas shift to Central Europe from the Mediterranean where they are charged with water vapour. Often these low-pressure areas bypass the Alps and then deposit their rain in the eastern uplands and the eastern foothills of the Alps. The weather conditions which cause the Five B (Vb) trajectories can remain stationary for a long time causing continuous rain and even heatwaves.
Apart from climate change, there are however numerous other developments which affect the scenario of flood events. The increasing sealing of surfaces (cf. Indicator RO-R-5) and soil compaction in catchment areas, as well as barriers to natural flood plains and embankments (cf. Indicator BD-R-2 and RO-R-6) result in higher and faster discharges into rivers.