Data Search

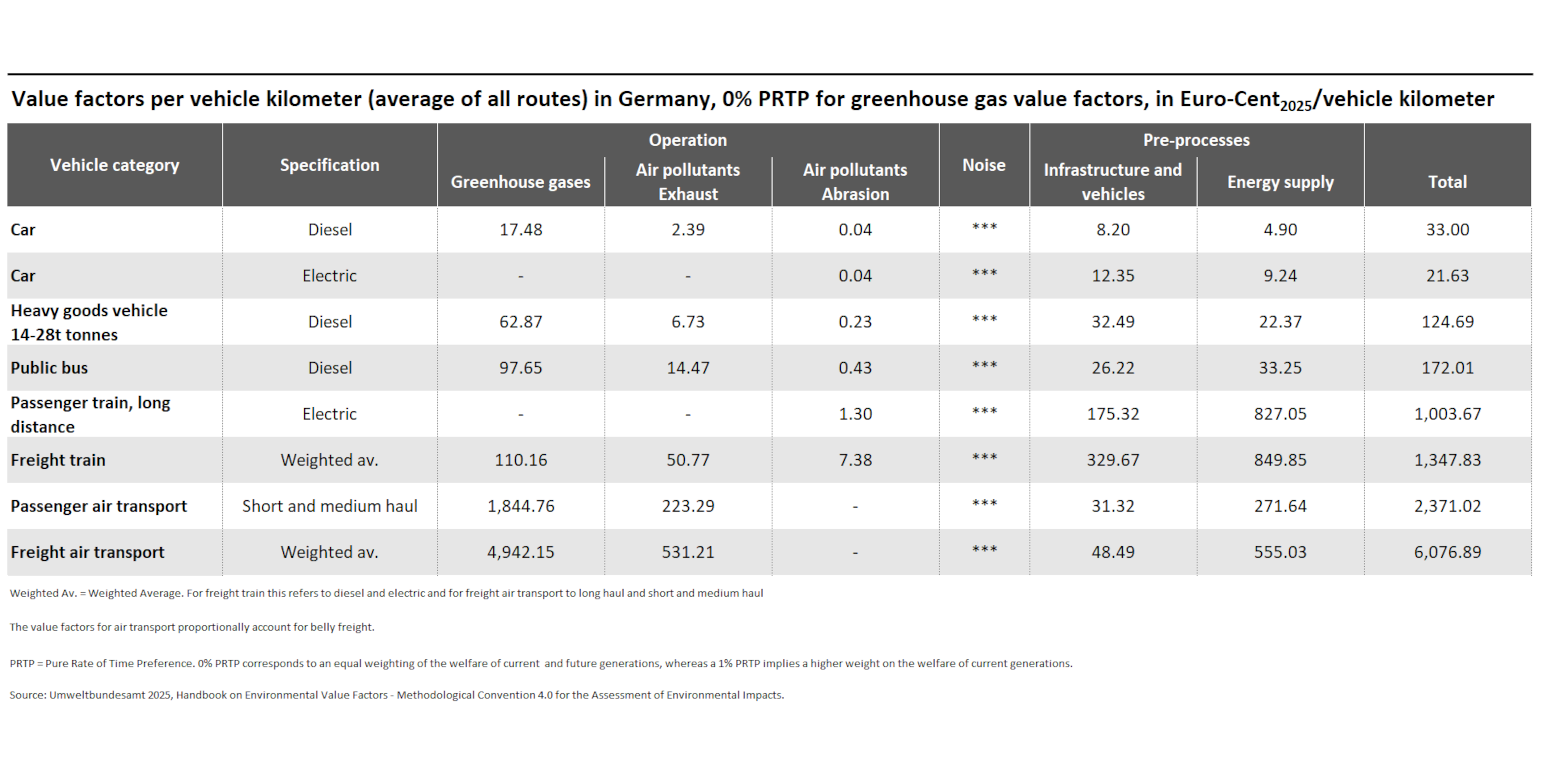
Value factors per vehicle kilometer for selected modes of transport
- Verkehr
- Daten und Tabellen

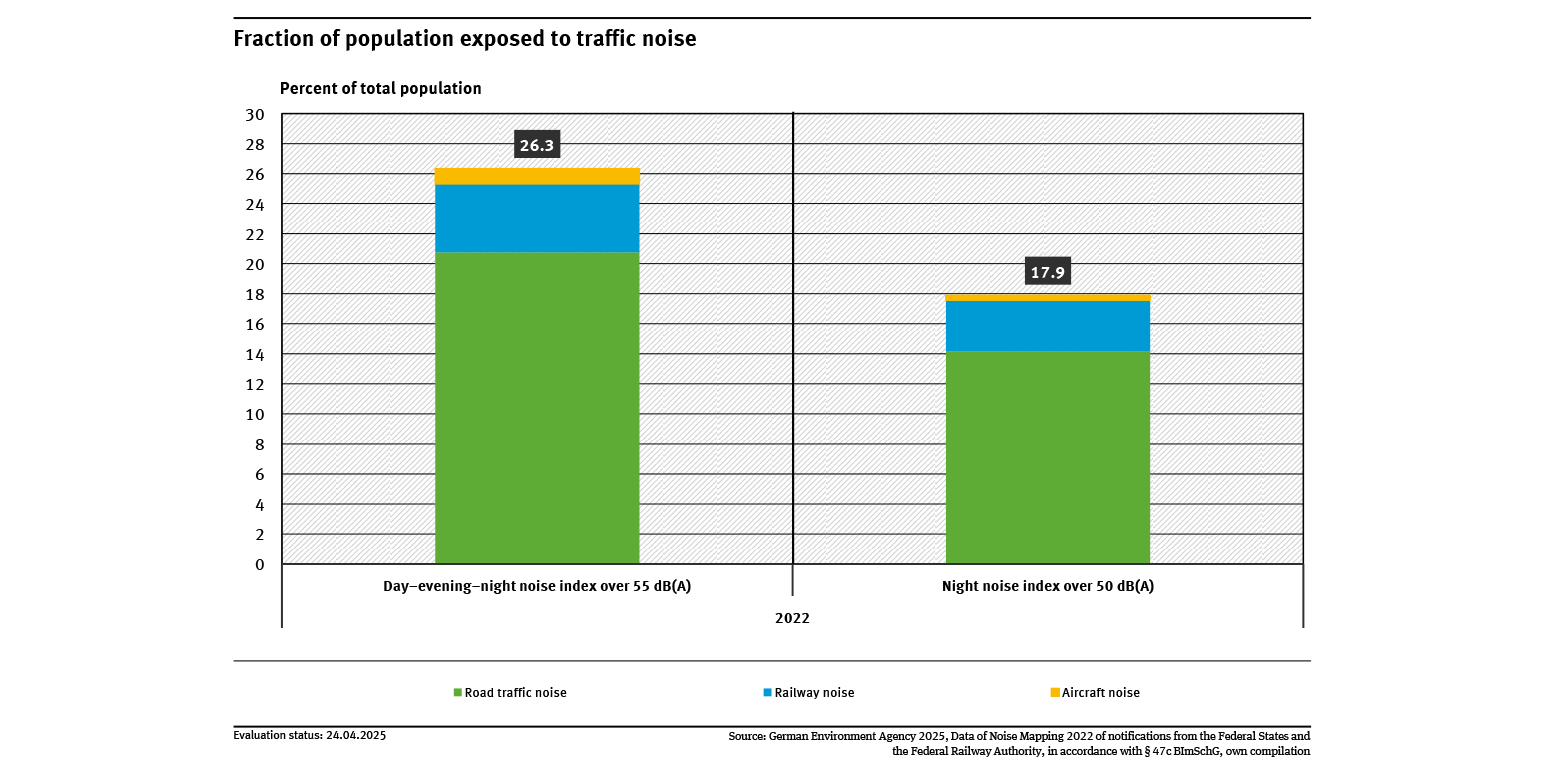
Fraction of population exposed to traffic noise
- Umwelt und Gesundheit
- Verkehr
- Diagramme
- Umwelt-Indikatoren
- Daten und Tabellen

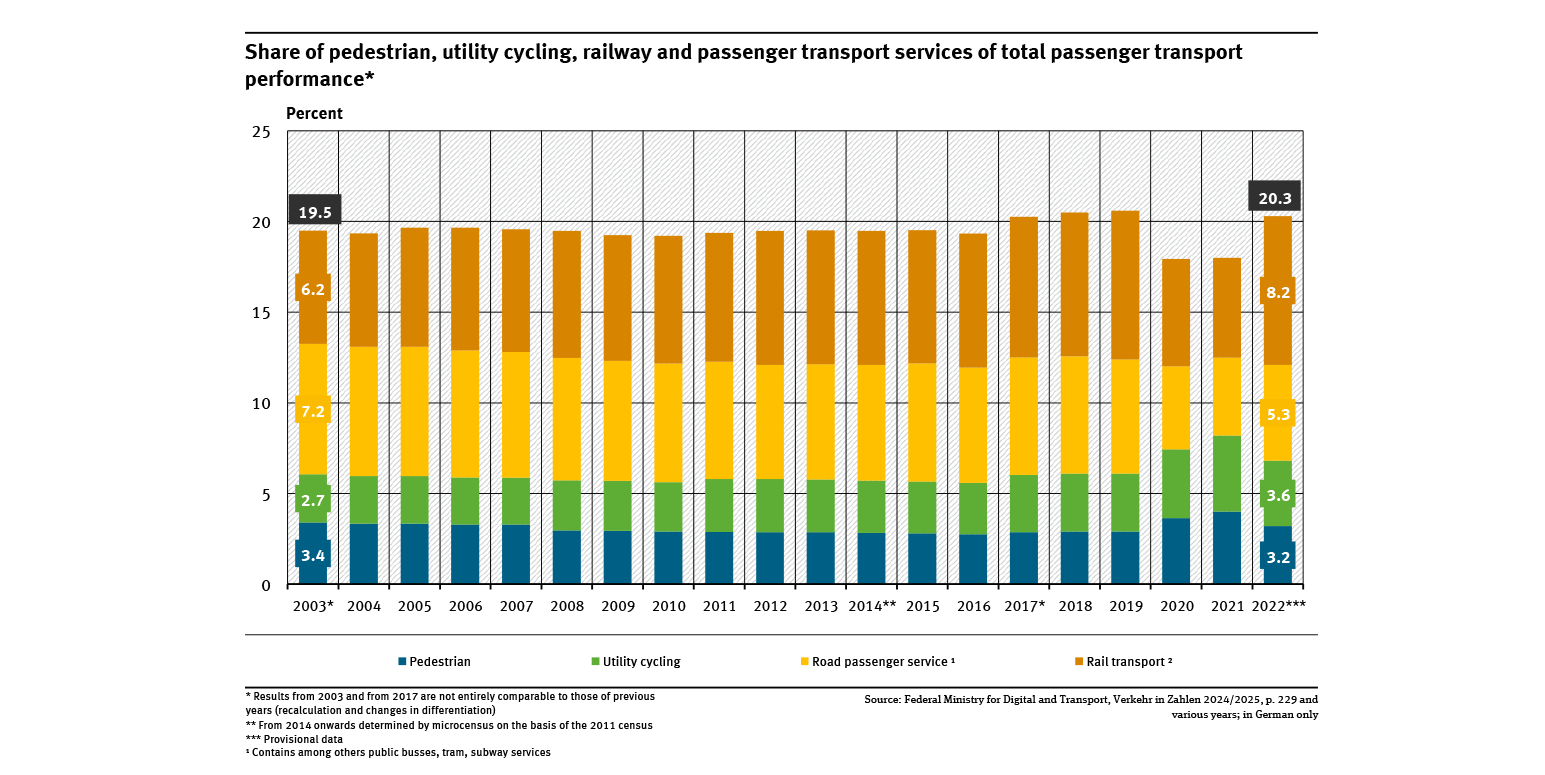
Share of pedestrian, utility cycling, railway and passenger transport services ...
- Verkehr
- Diagramme
- Umwelt-Indikatoren
- Daten und Tabellen

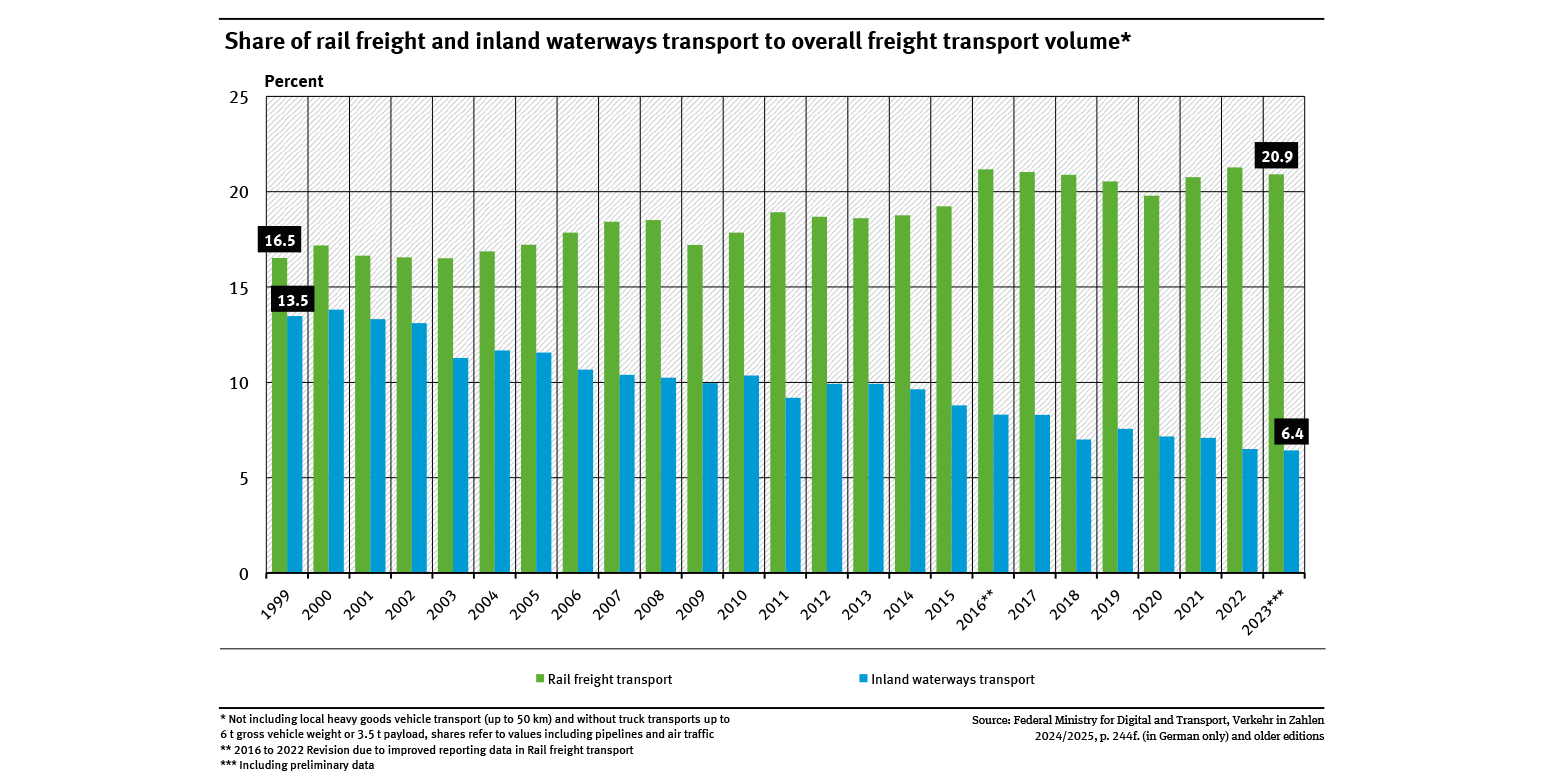
Share of rail freight and inland waterways transport to overall freight transport volume
- Verkehr
- Diagramme
- Umwelt-Indikatoren
- Daten und Tabellen

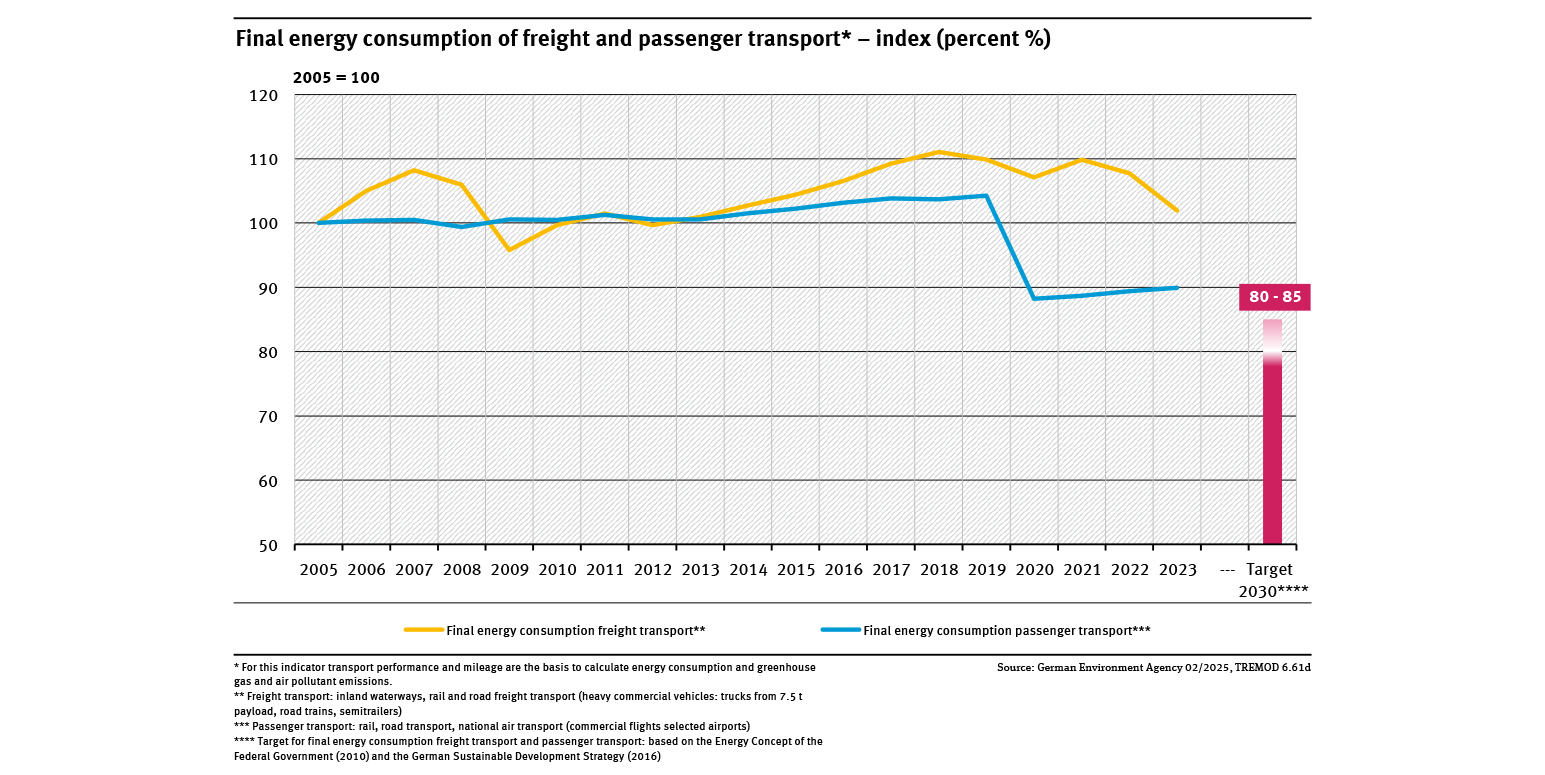
Final energy consumption of freight and passenger transport
- Energie
- Verkehr
- Diagramme
- Umwelt-Indikatoren
- Daten und Tabellen

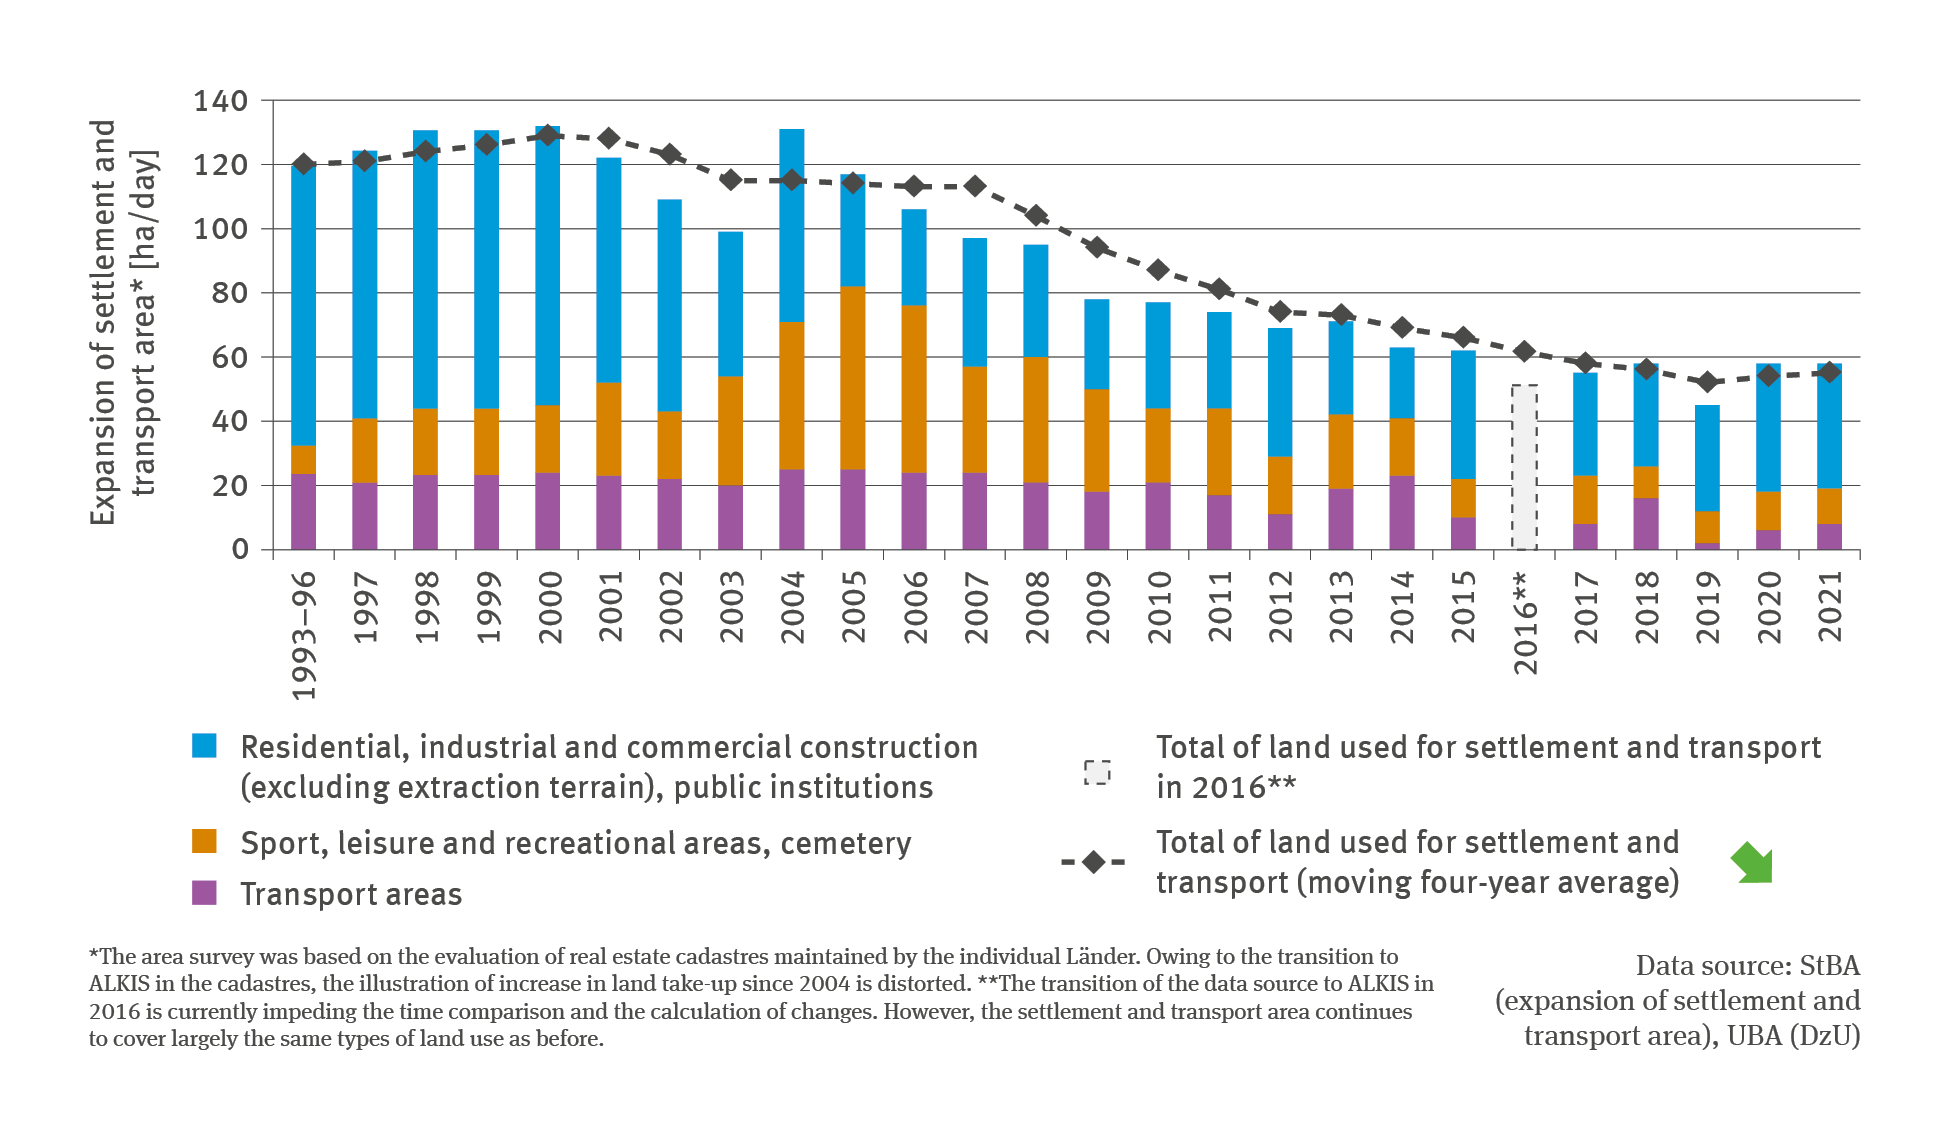
RO-R-5: Increase in settlement and transport areas
- Klima
- Fläche, Boden, Land-Ökosysteme
- Verkehr
- Diagramme
Export data

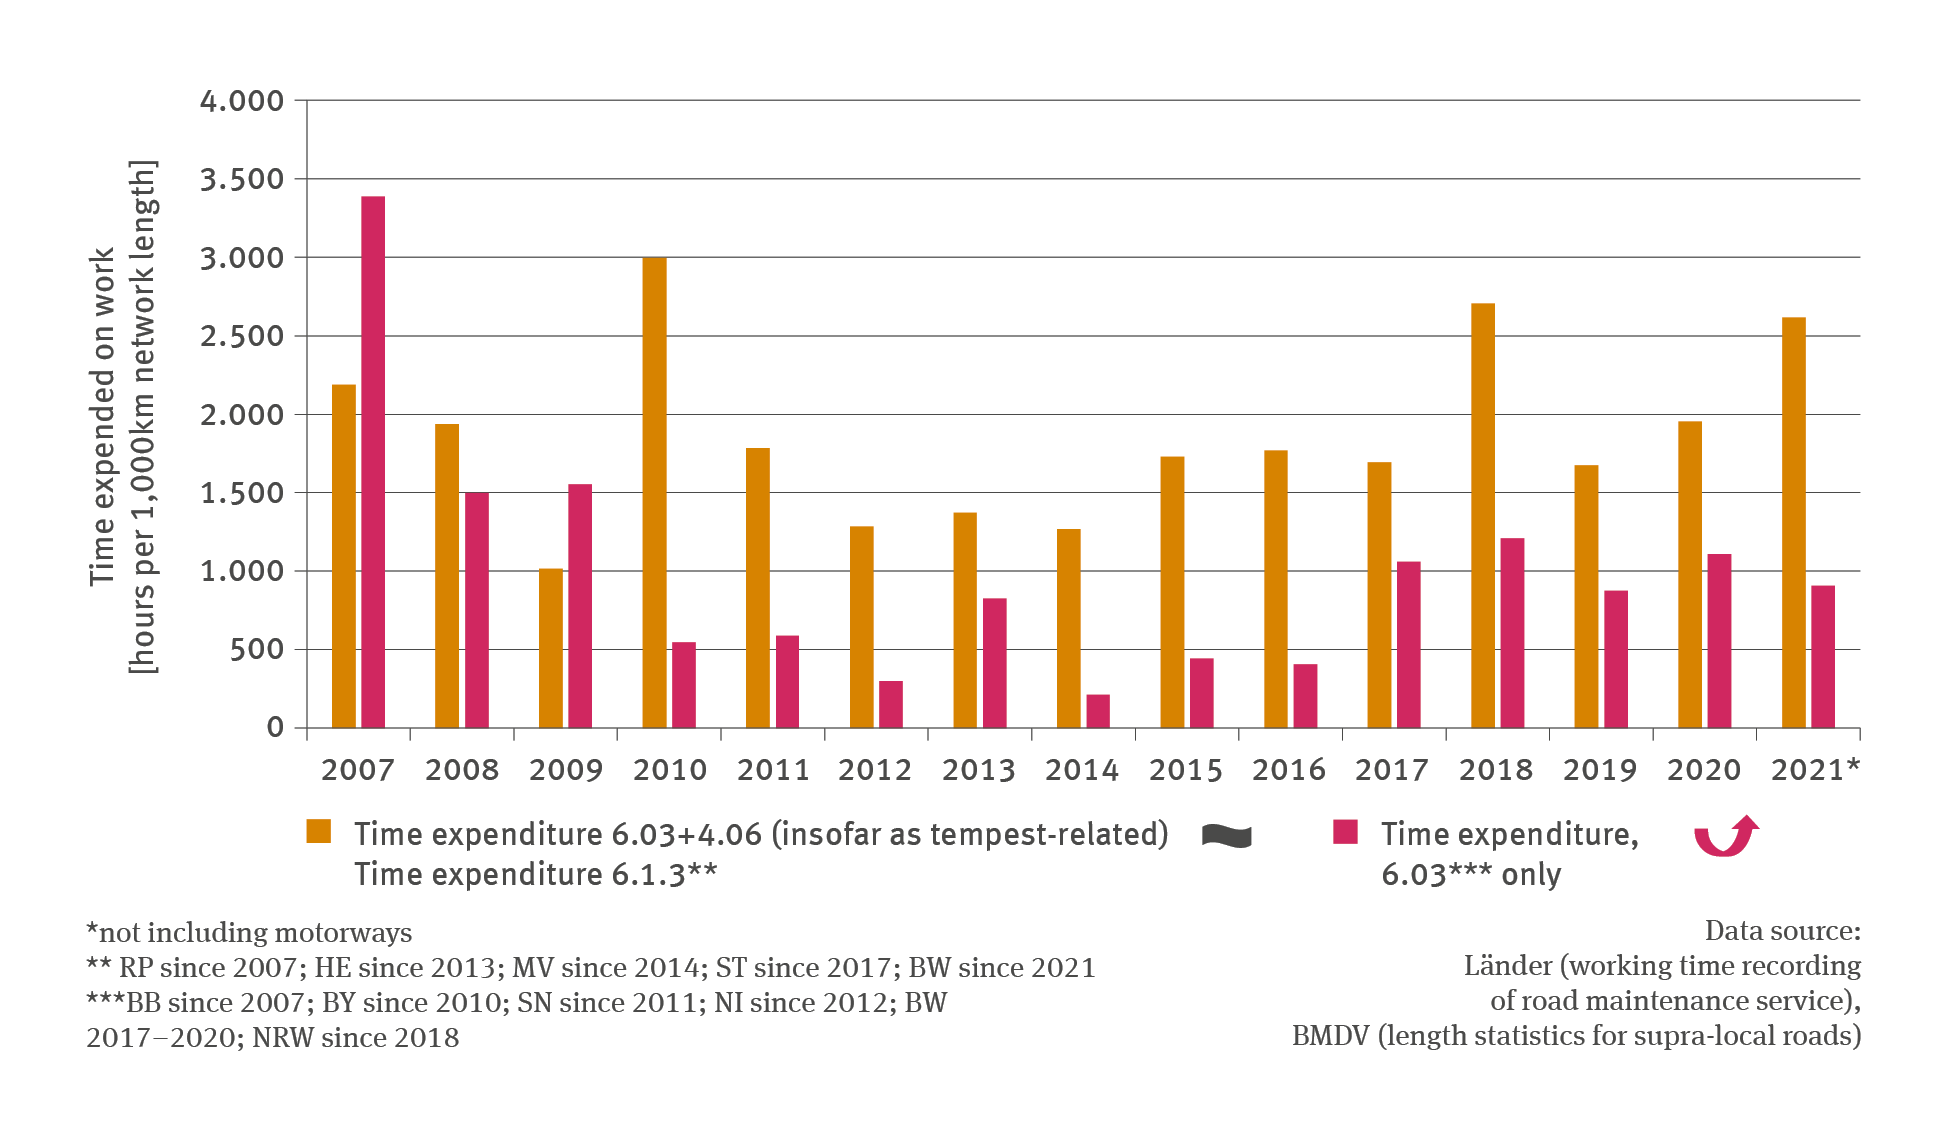
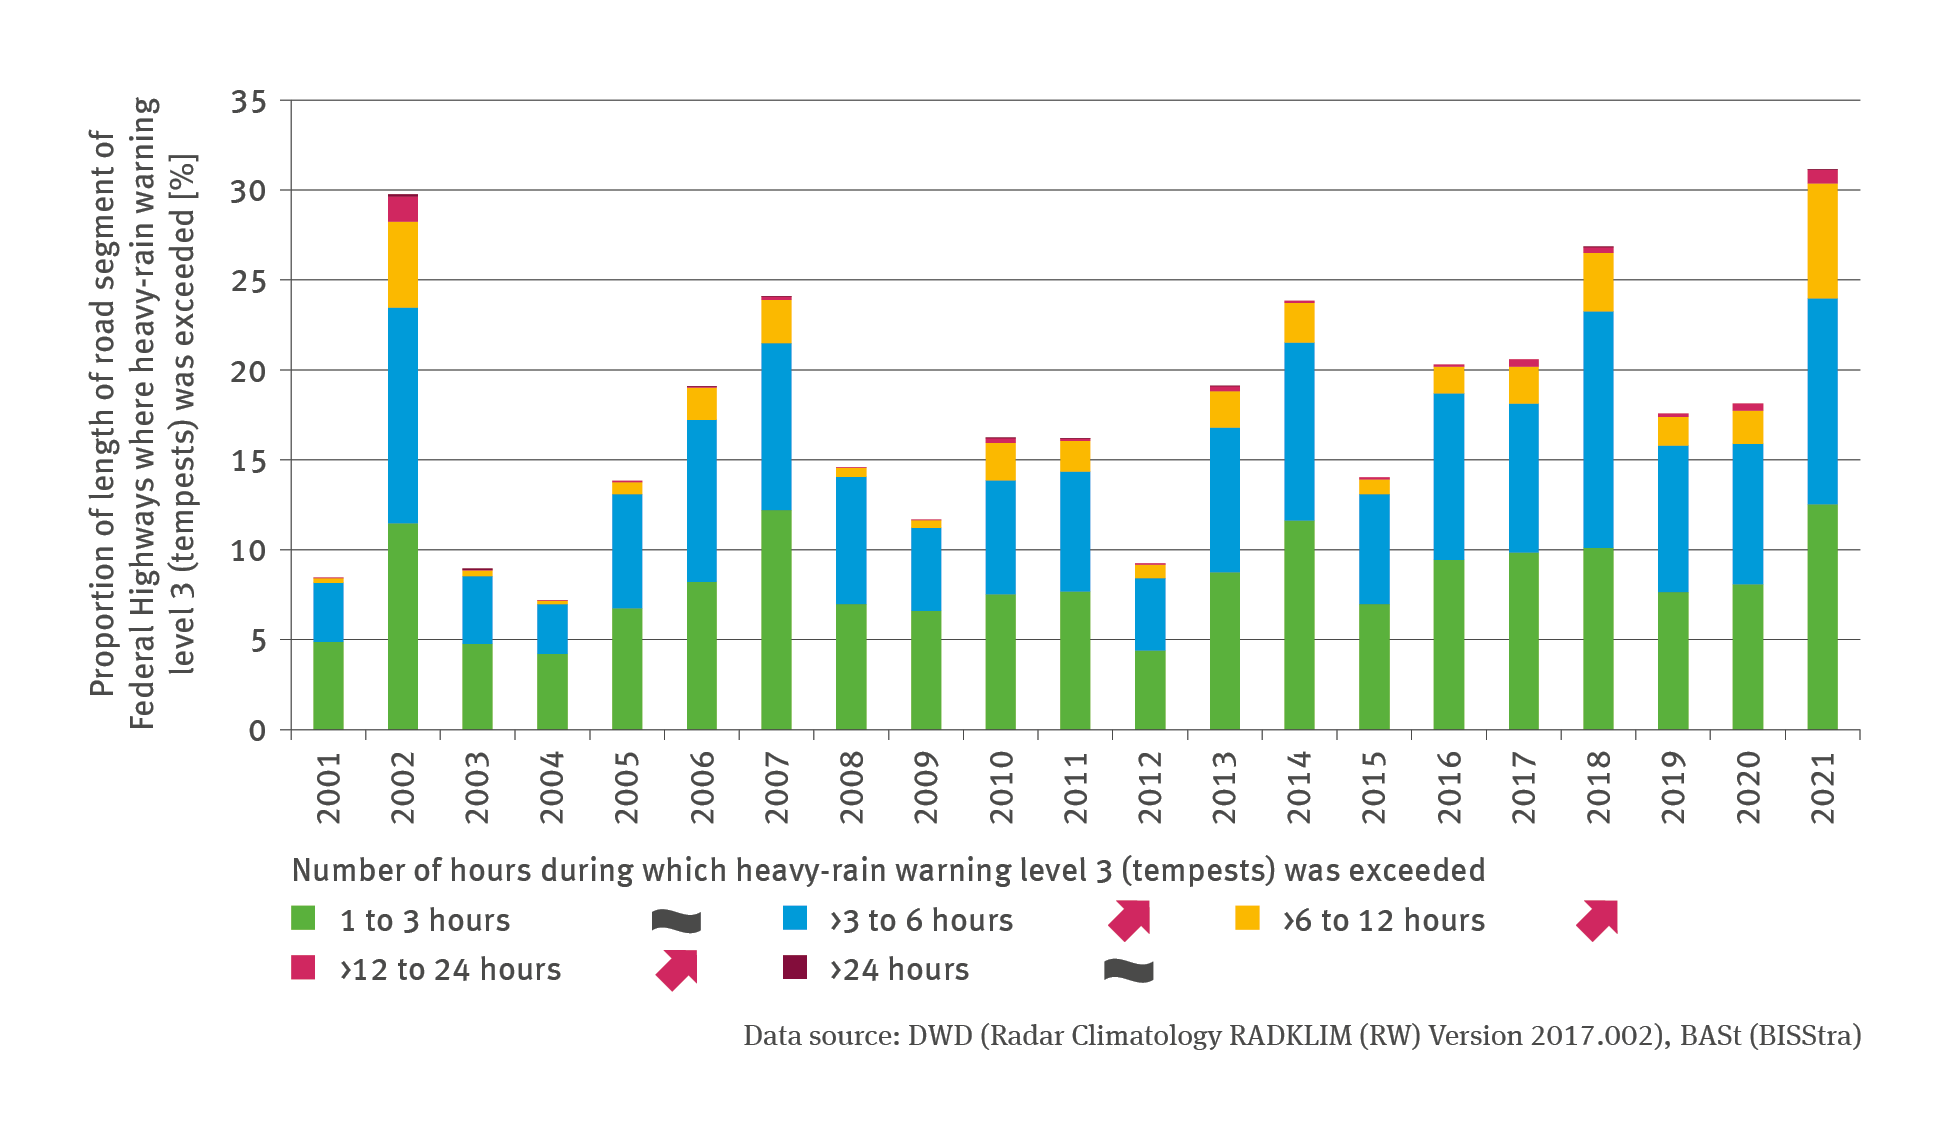
VE-I-5: Impacts on roads due to weather conditions and weather patterns
- Klima
- Verkehr
- Diagramme
Export data

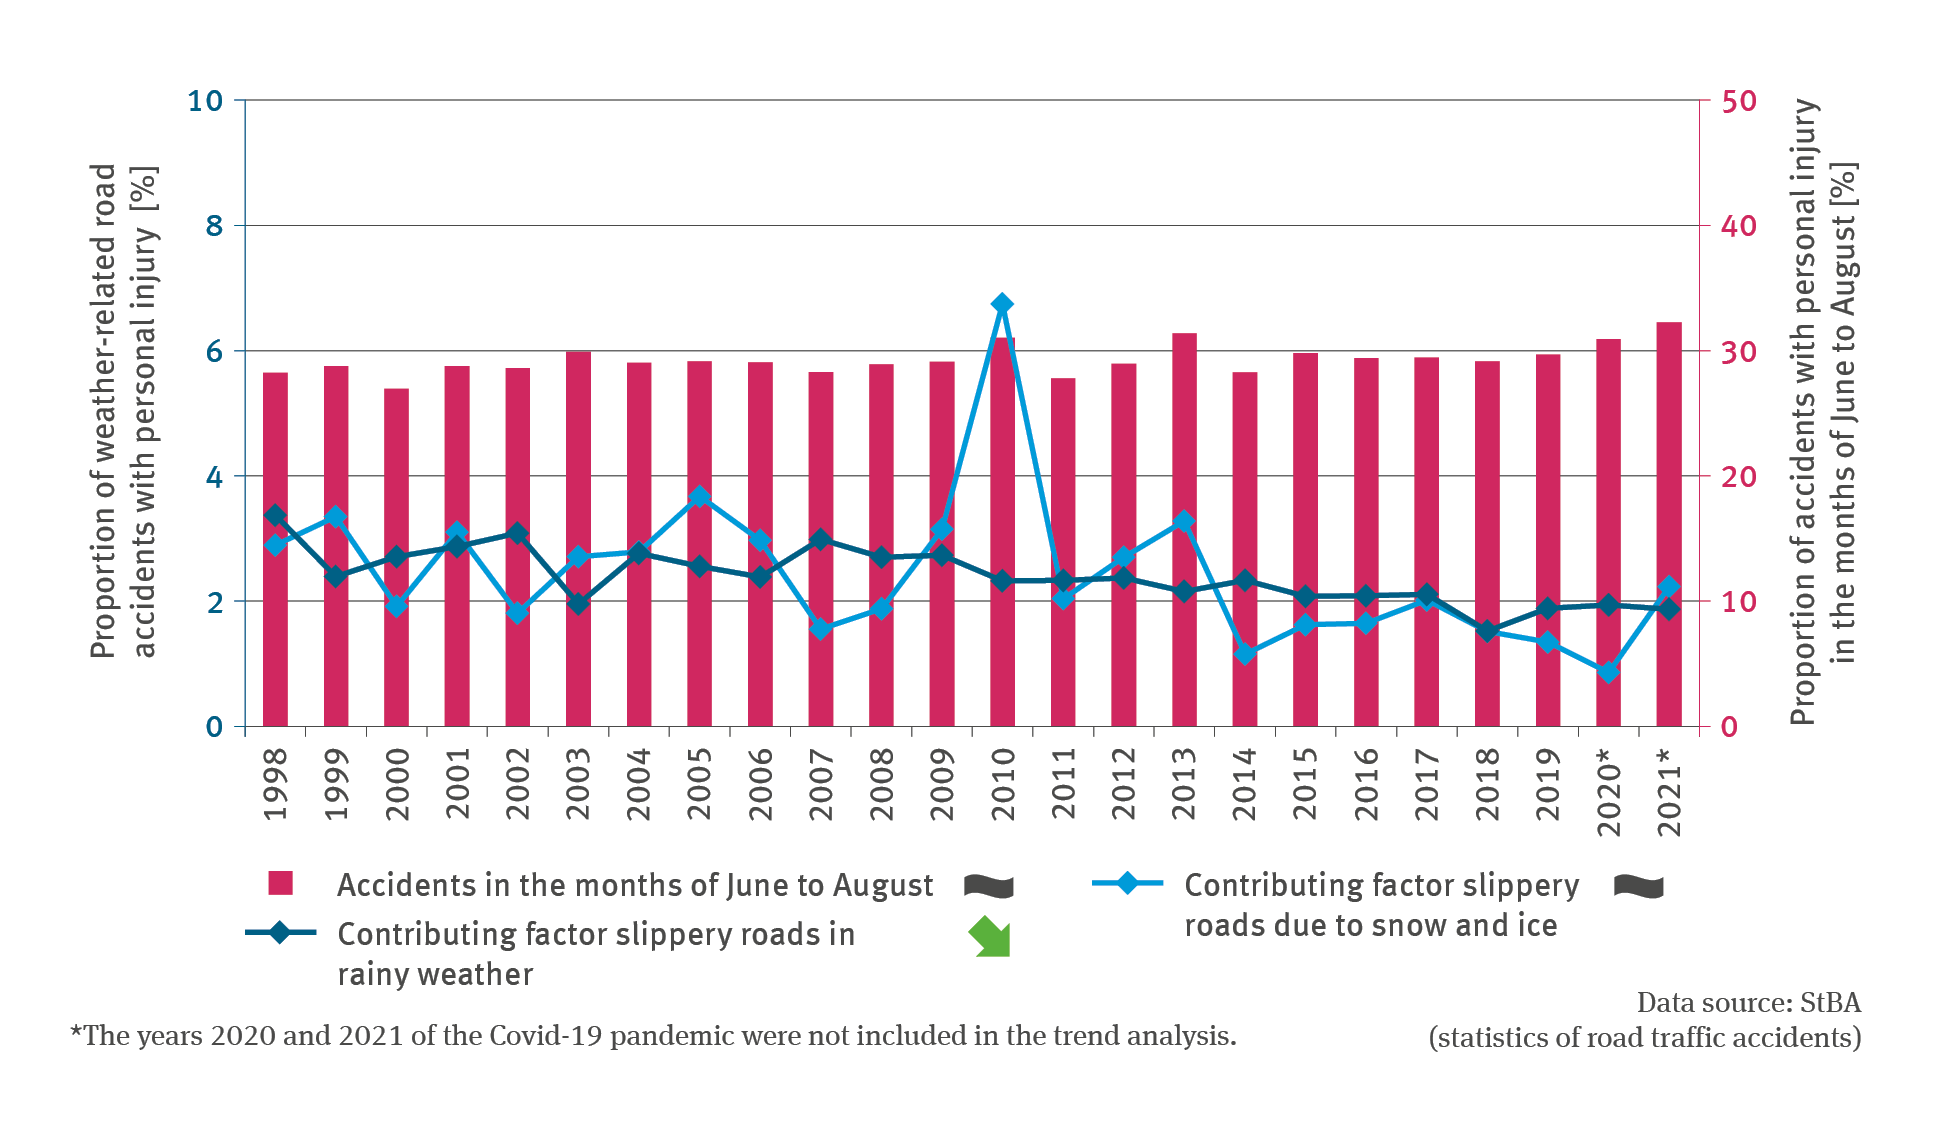
VE-I-4: Road accidents due to weather conditions and weather patterns
- Klima
- Verkehr
- Diagramme
Export data

