Data Search

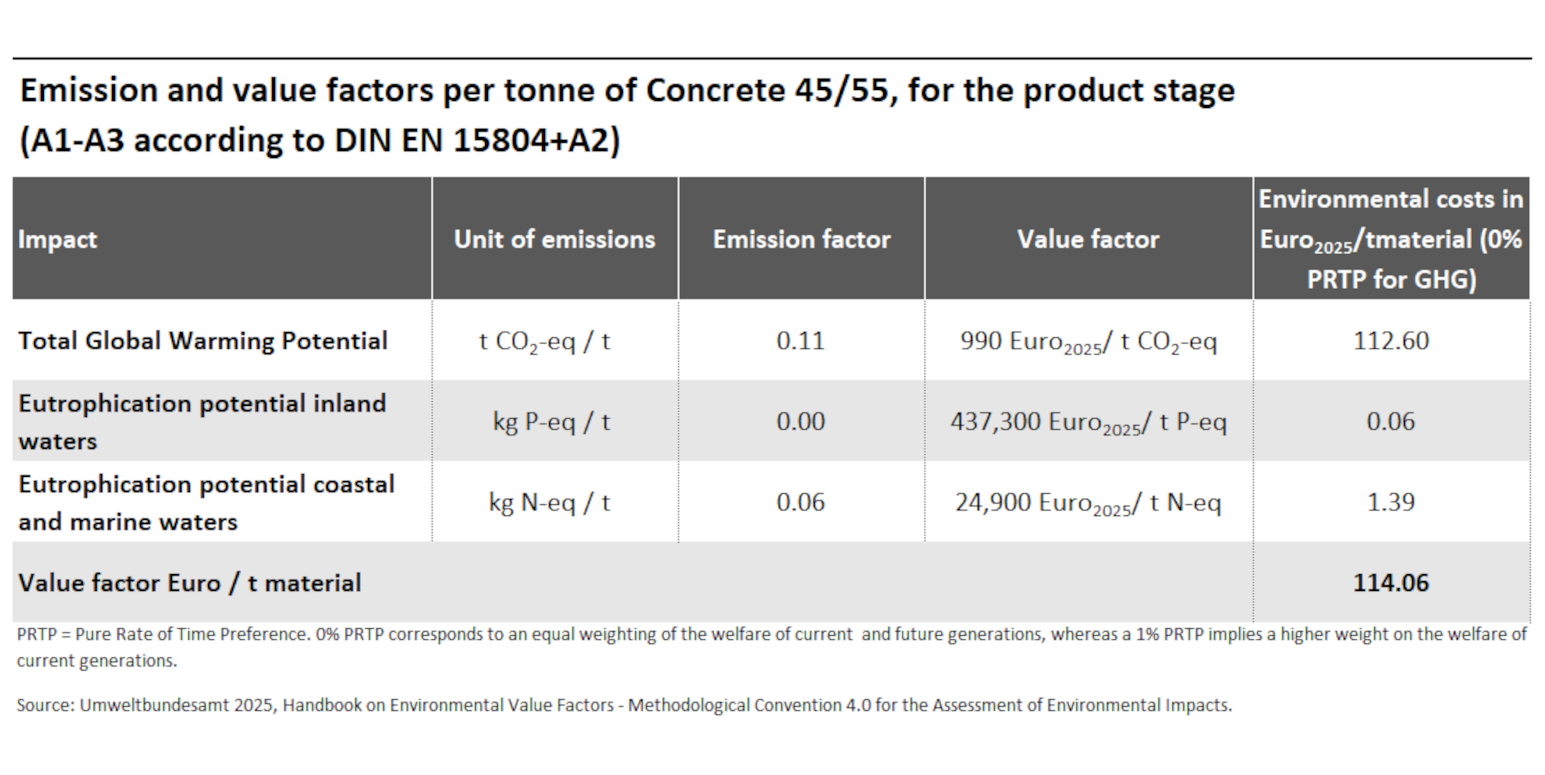
Environmental impacts of concrete 45/55
- Ressourcen und Abfall
- Daten und Tabellen

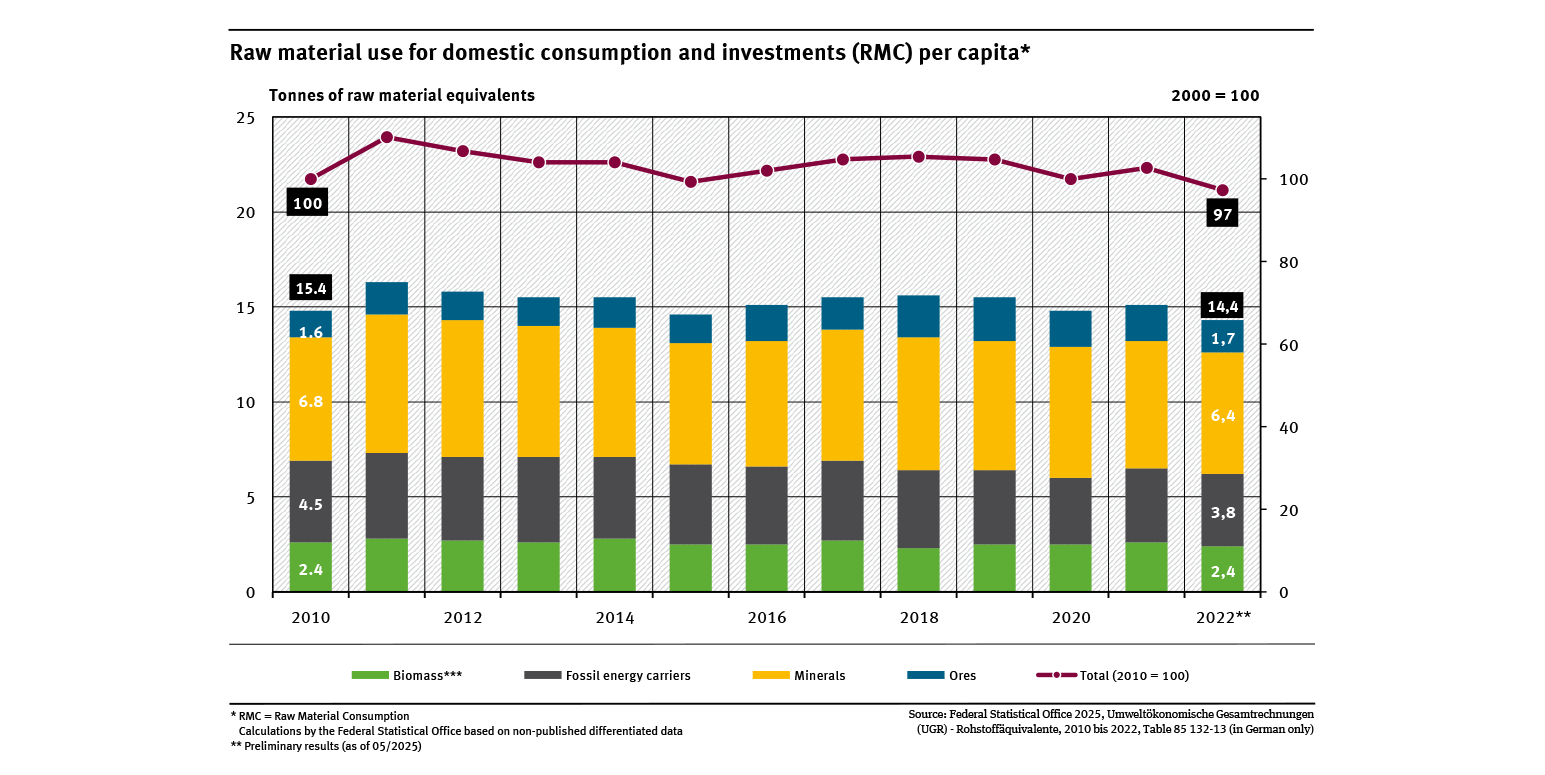
Raw material use for domestic consumption and investments (RMC) per capita
- Ressourcen und Abfall
- Diagramme
- Umwelt-Indikatoren
- Daten und Tabellen

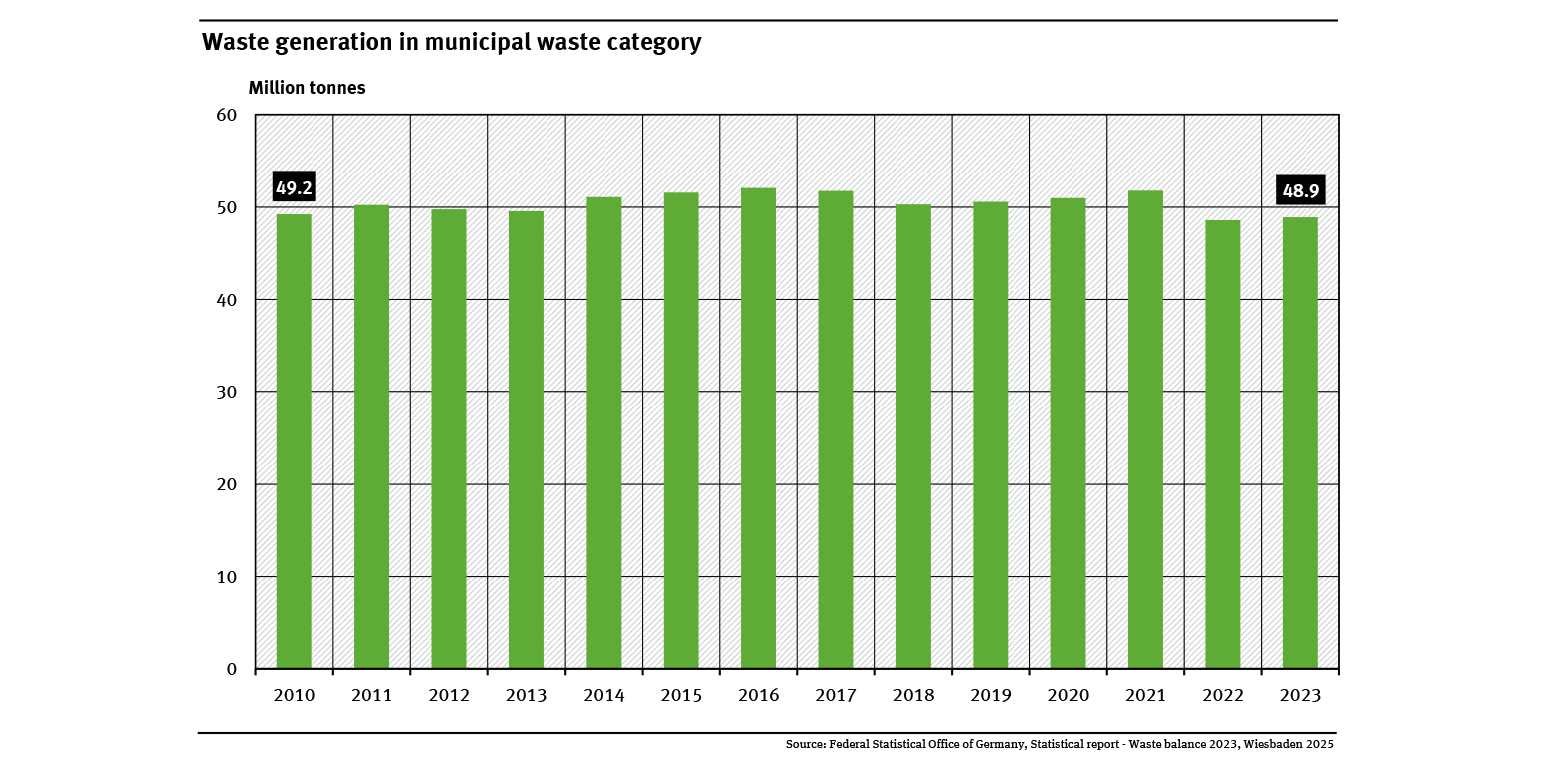
Waste generation in municipal waste category
- Ressourcen und Abfall
- Diagramme
- Umwelt-Indikatoren
- Daten und Tabellen

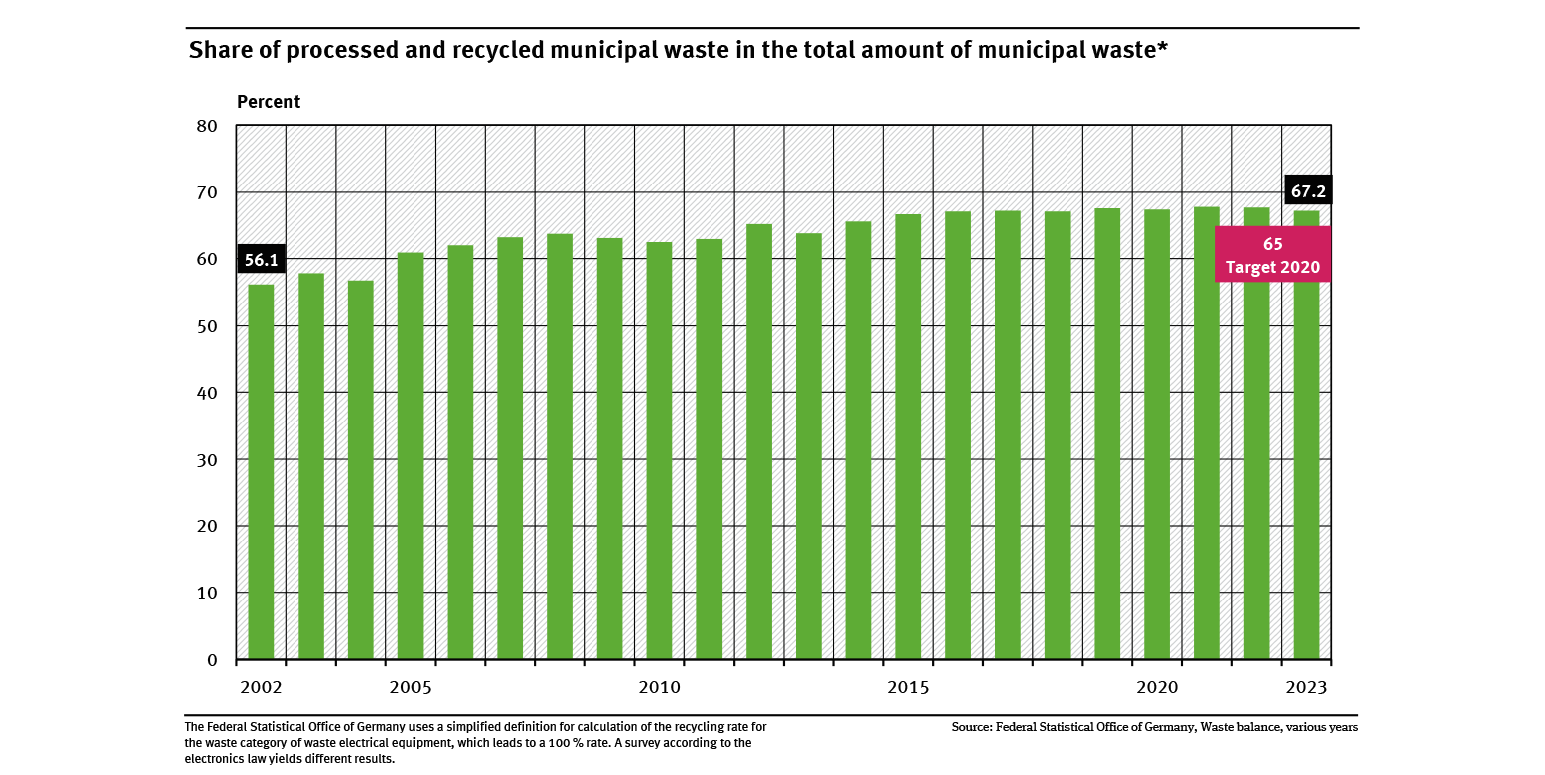
Share of processed and recycled municipal waste in the total amount of municipal waste
- Ressourcen und Abfall
- Diagramme
- Umwelt-Indikatoren
- Daten und Tabellen

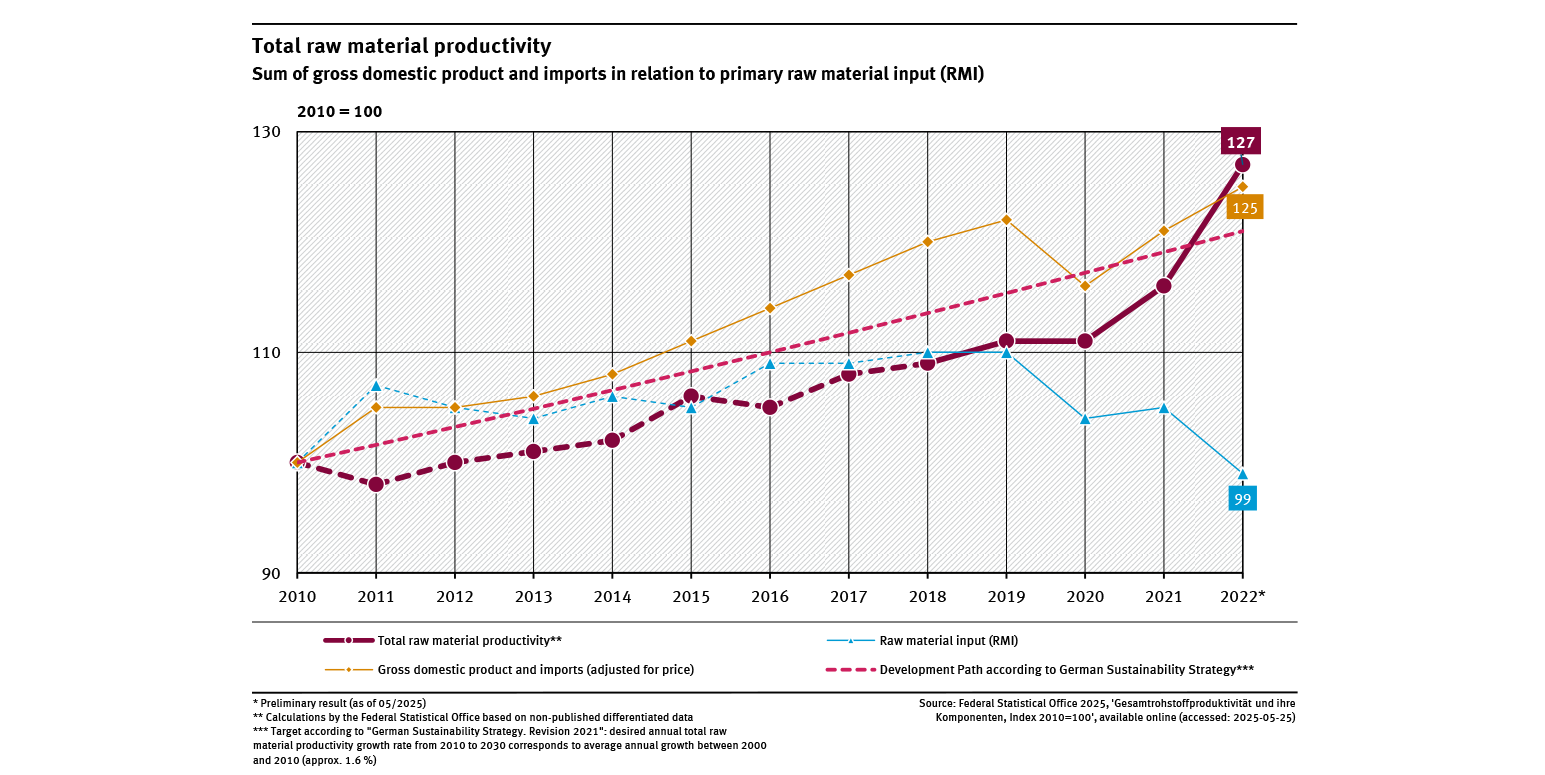
Total raw material productivity
- Ressourcen und Abfall
- Diagramme
- Umwelt-Indikatoren
- Daten und Tabellen

Development of raw material consumption (RMC) in Germany by raw material group, 2008–2020
- Ressourcen und Abfall
- Private Haushalte und Konsum
- Diagramme
Export data

Poster ERF 2020 (PDF)
- Ressourcen und Abfall

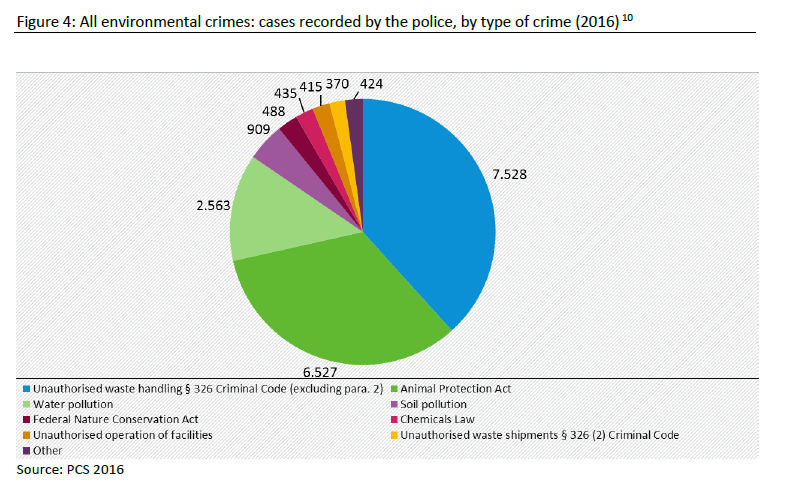
All environmental crimes: cases recorded by the police, by type of crime (2016)
- Wasser
- Ressourcen und Abfall
- Umwelt und Wirtschaft
- Diagramme
- Daten und Tabellen
Export data

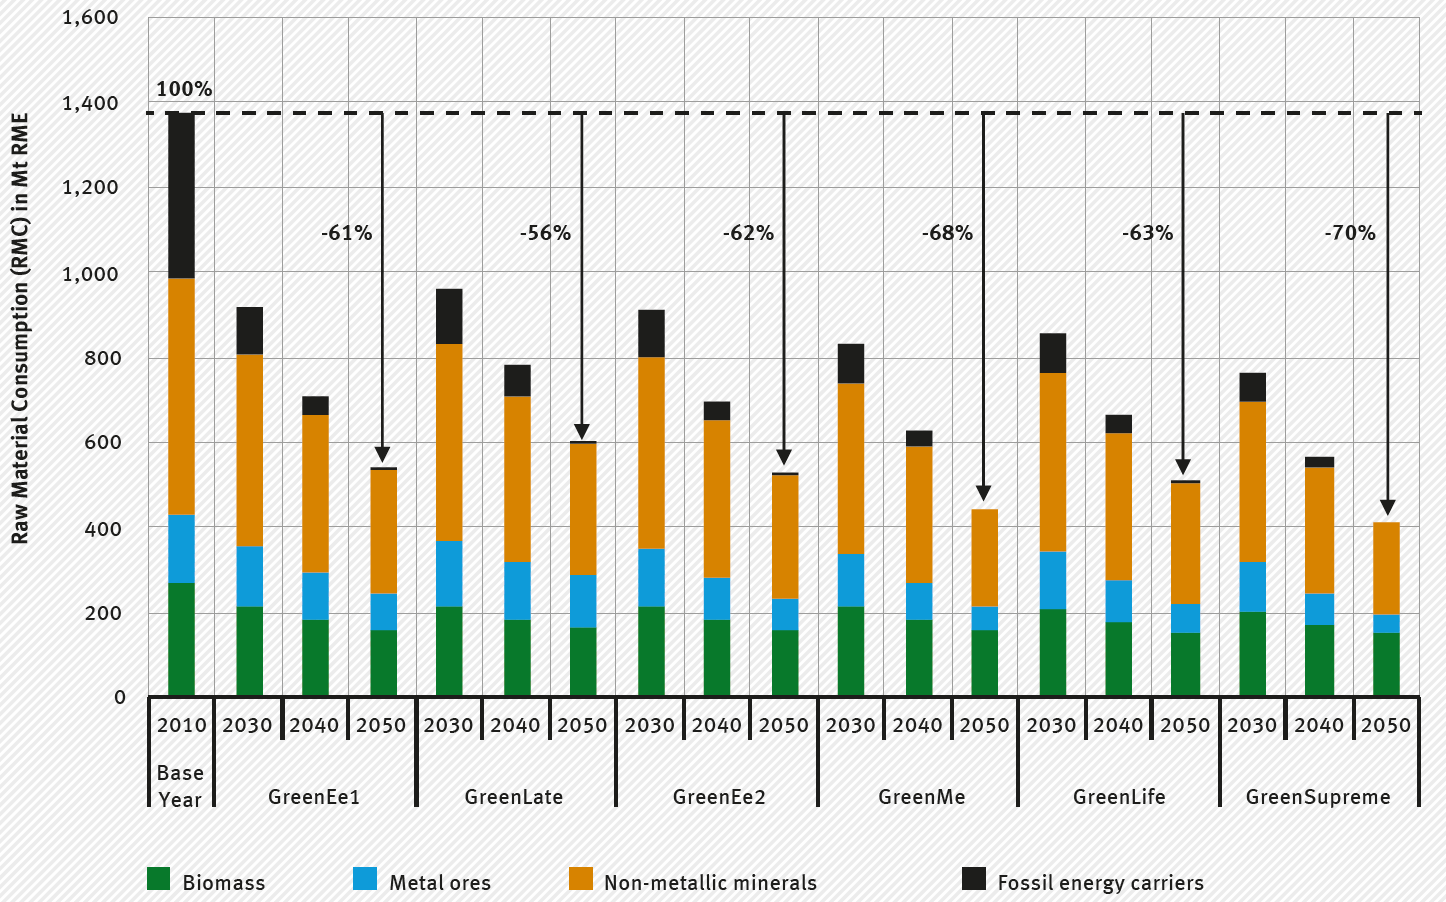
The raw material consumption (RMC) for the six Green-scenarios of the RESCUE study.
- Klima
- Ressourcen und Abfall
- Diagramme
Export data