Data Search

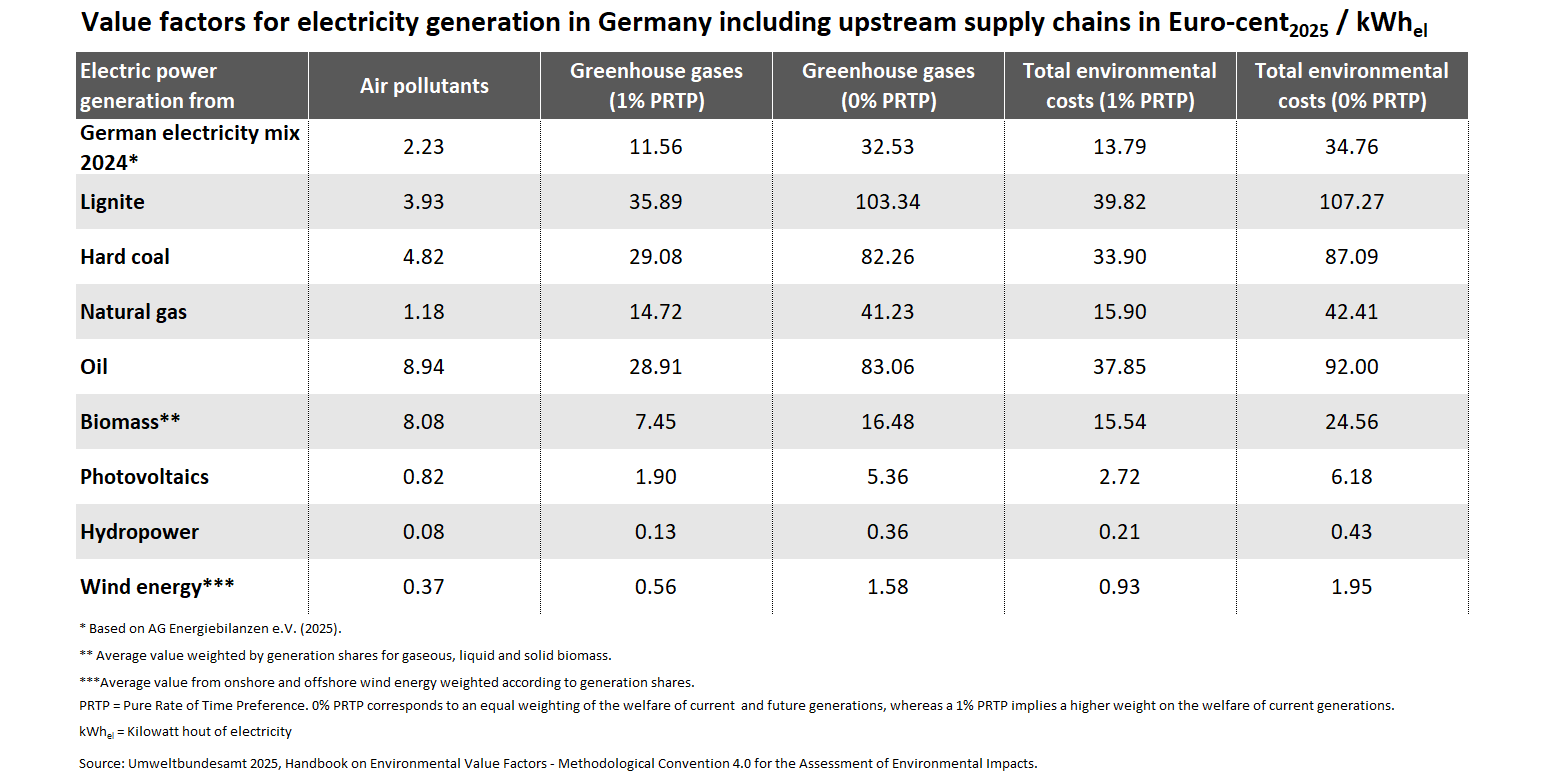
Value factors for greenhouse gas & air pollution related environmental impacts from power generation
- Klima
- Luft
- Daten und Tabellen

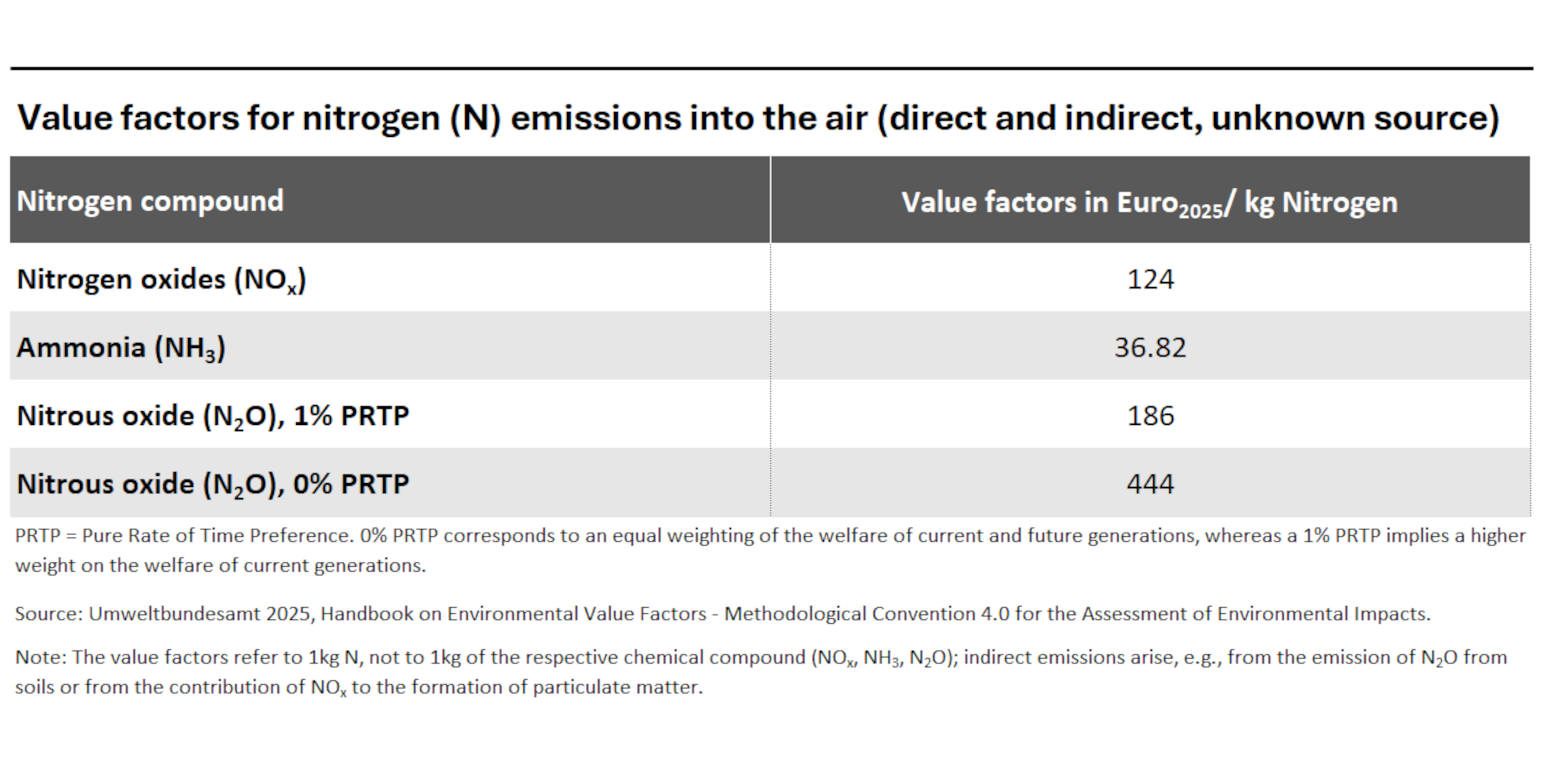
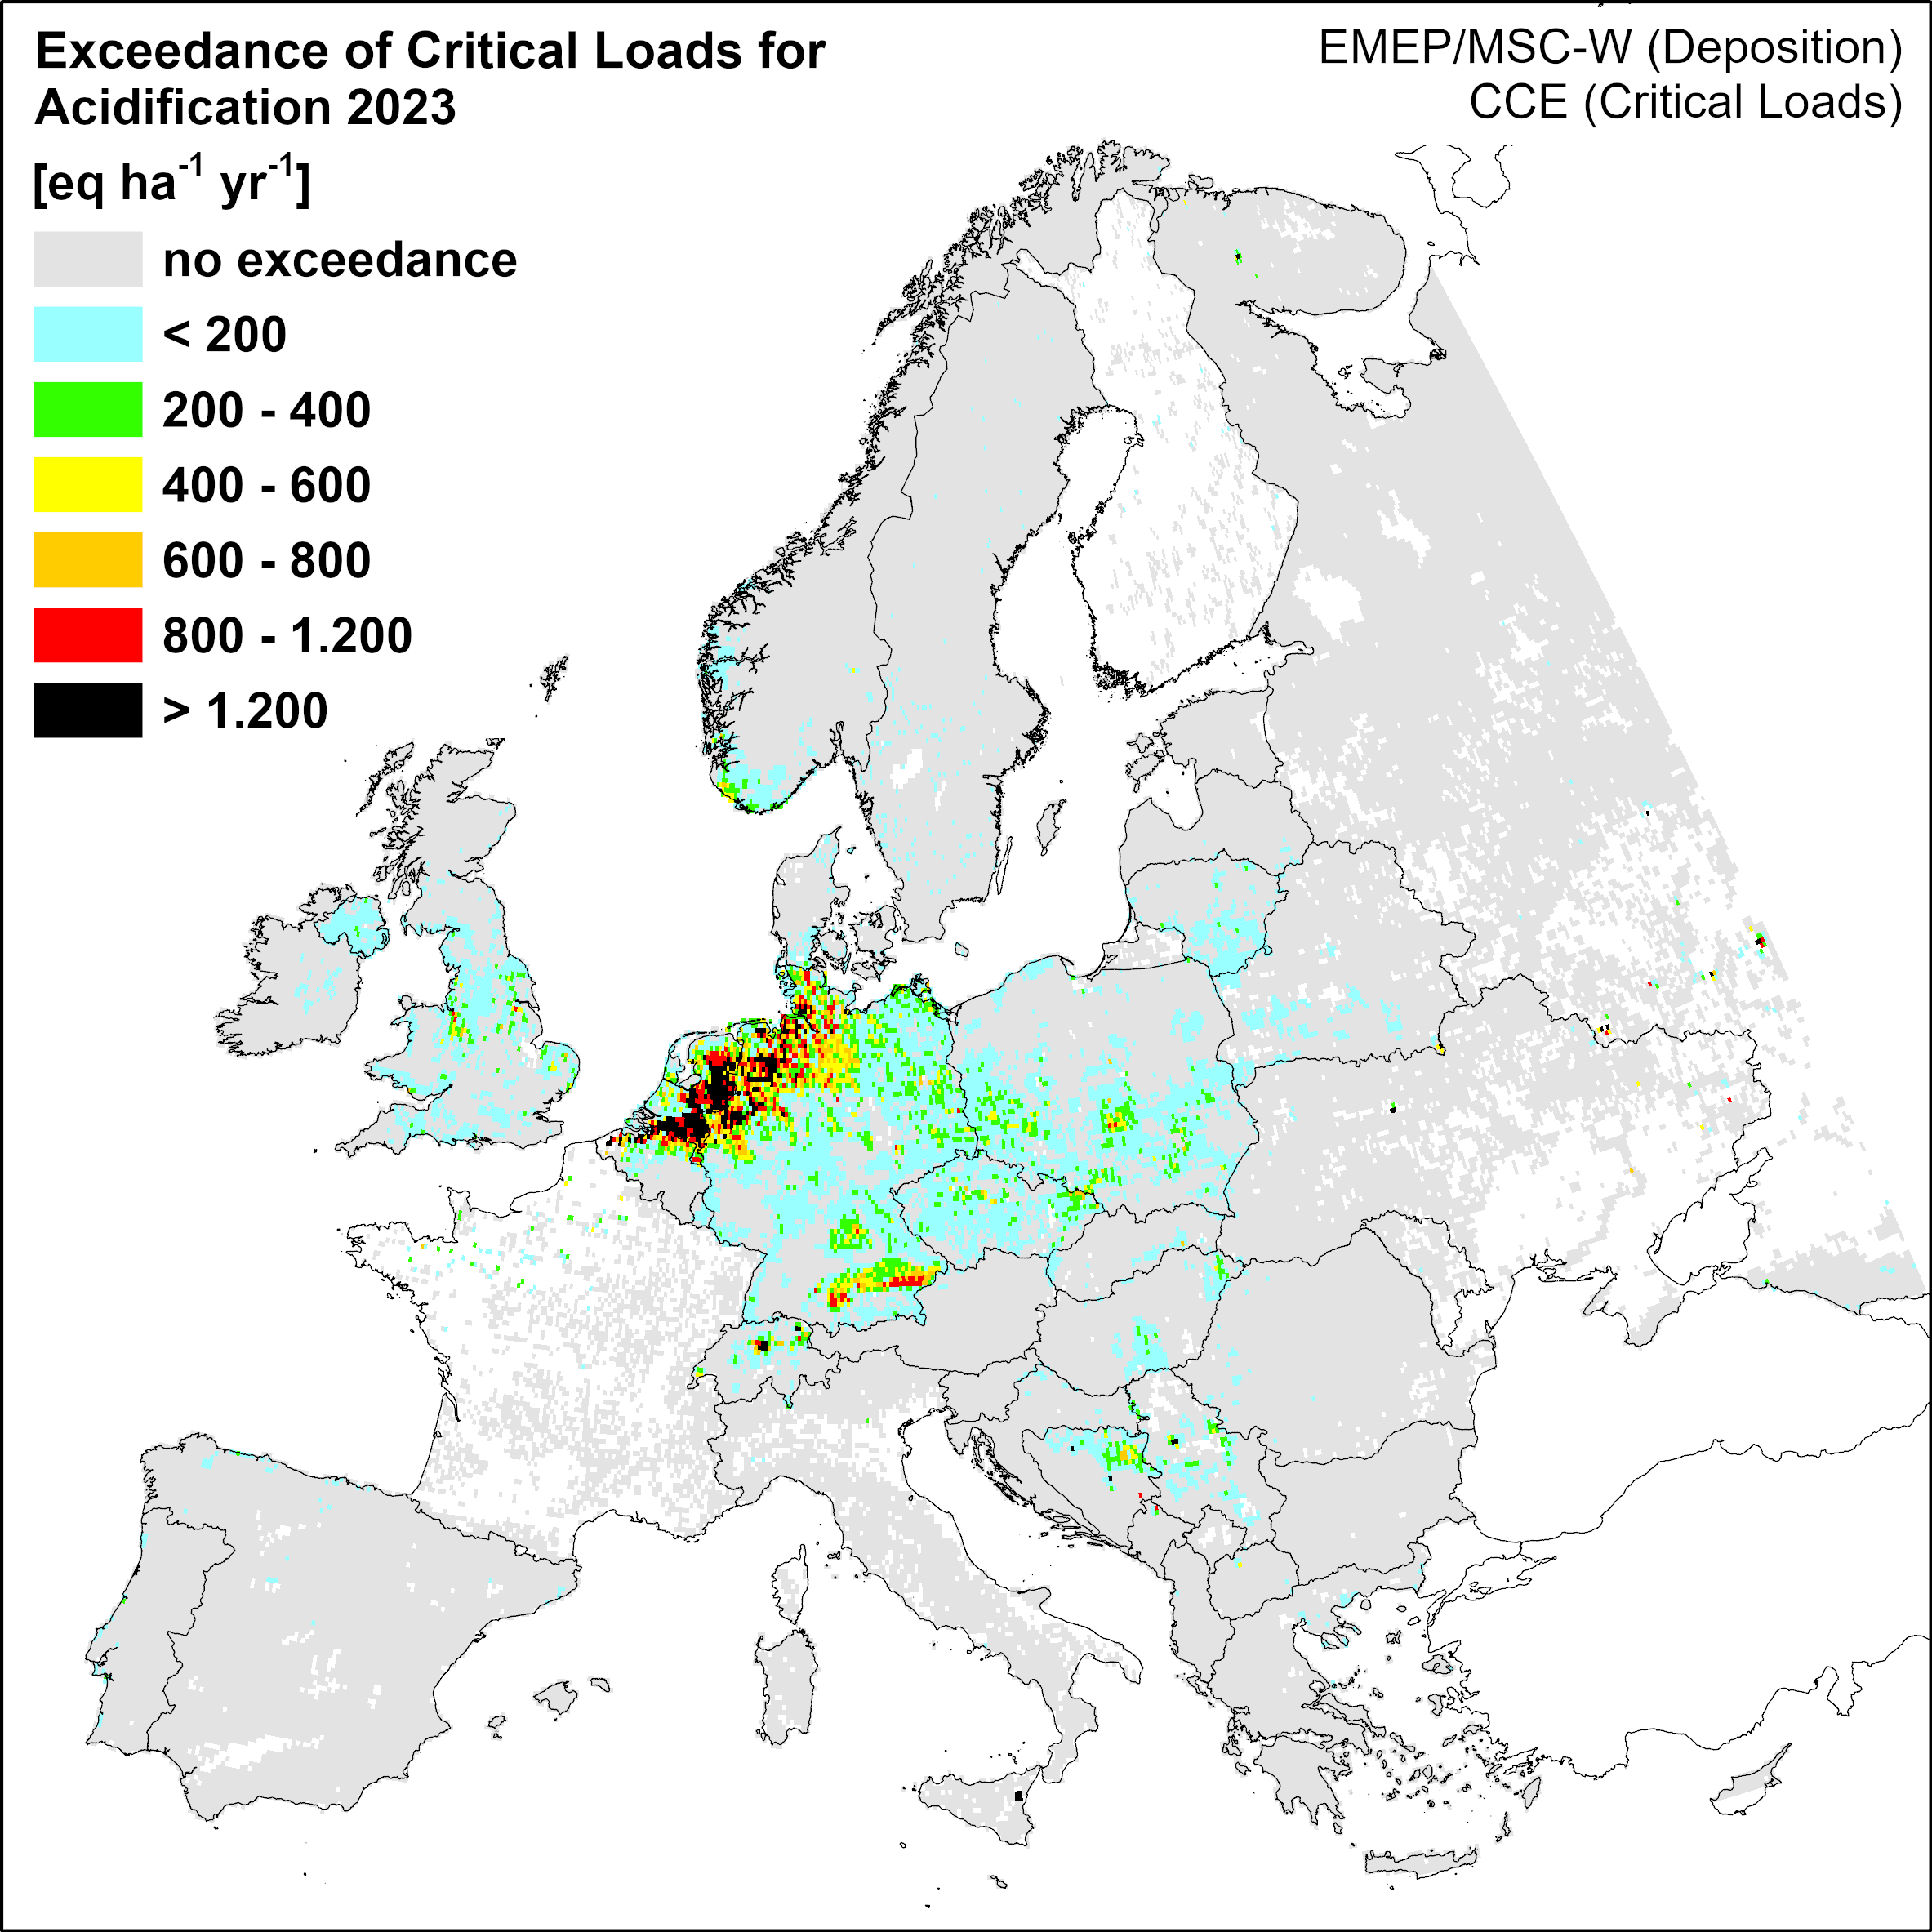
The emission of nitrogen compounds leads to substantial environmental damage.
- Luft
- Land- und Forstwirtschaft
- Daten und Tabellen

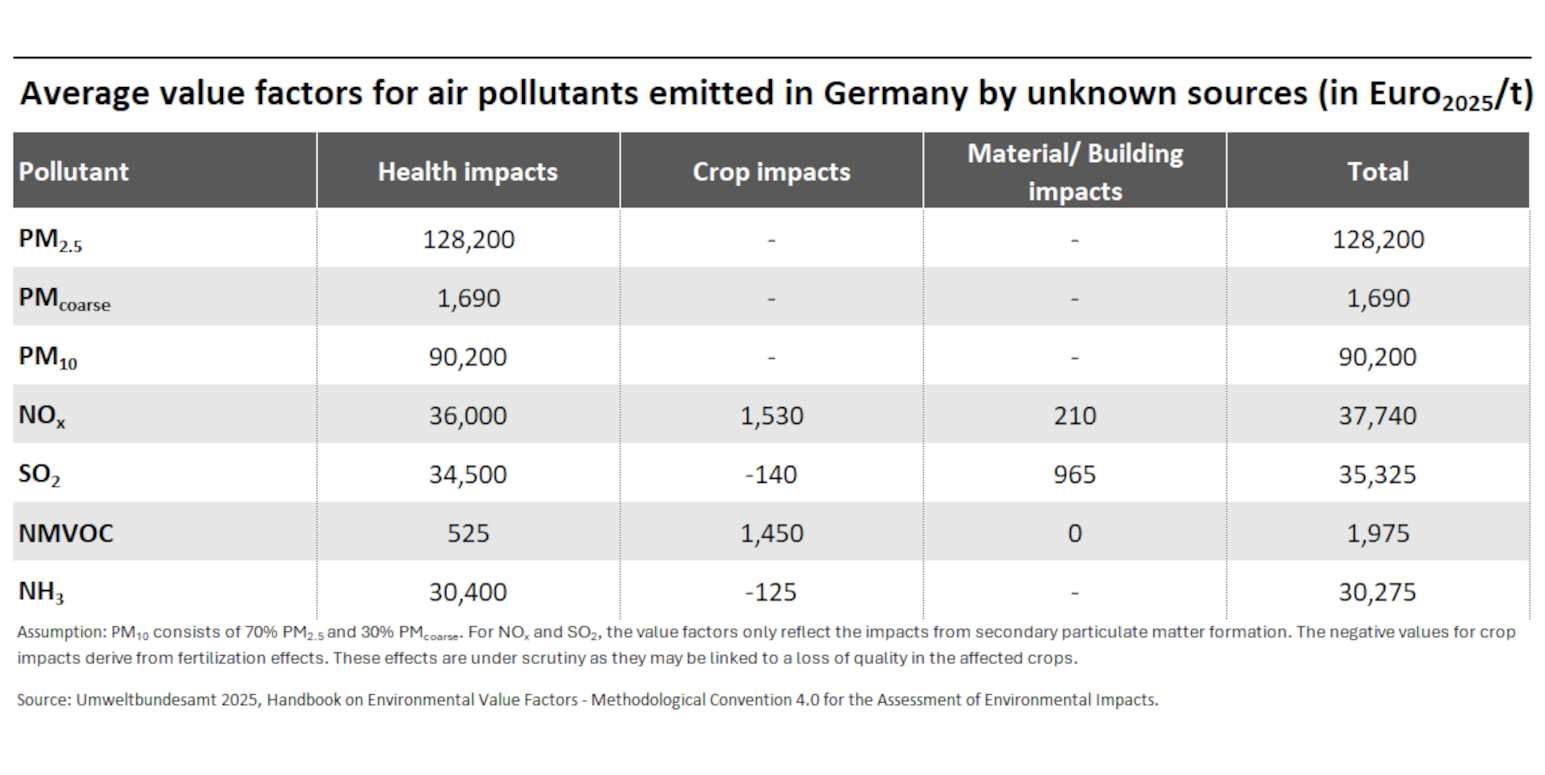
Air pollutants do not only affect human health but also impact crops and buildings.
- Luft
- Daten und Tabellen


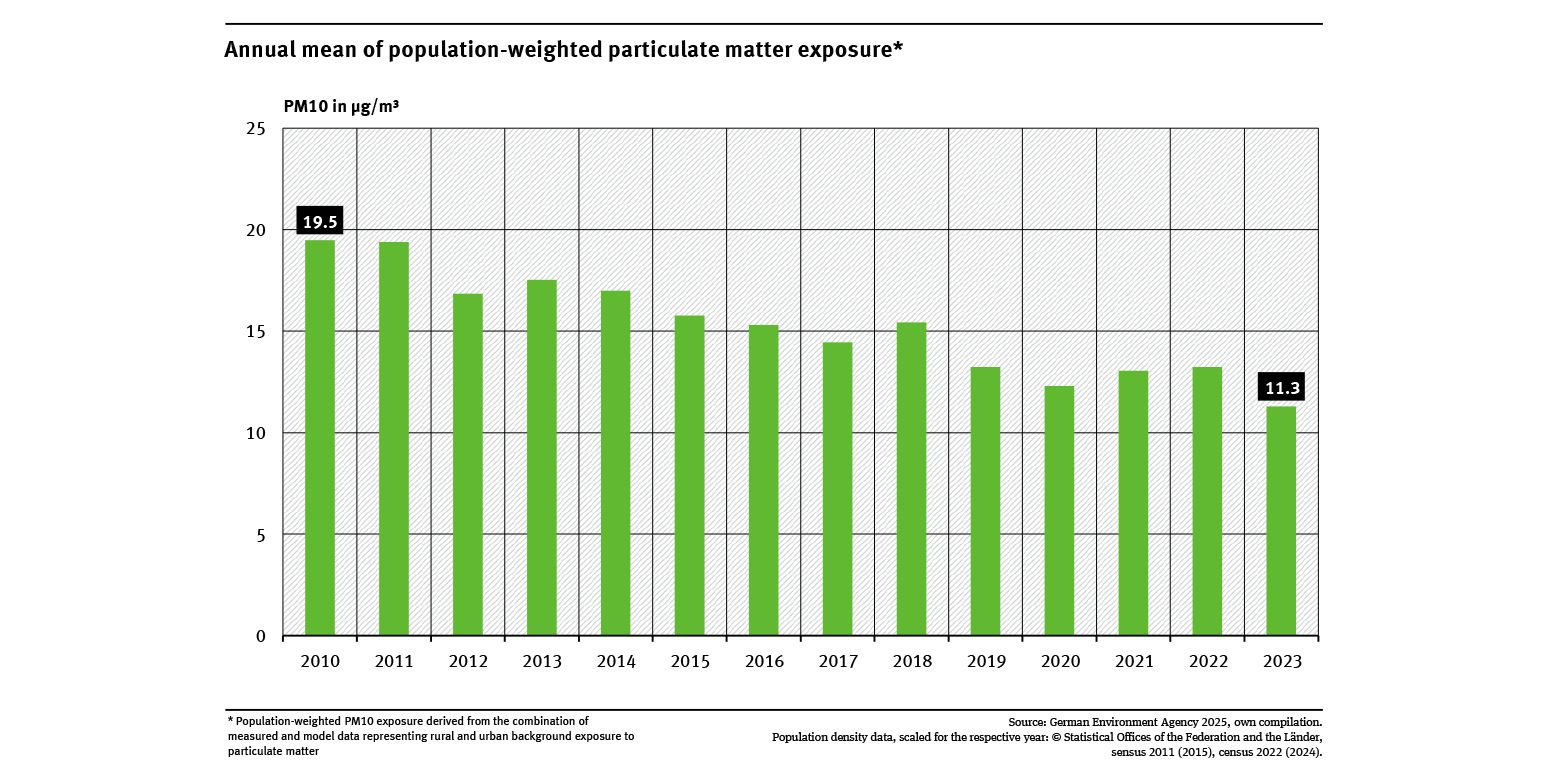
Annual mean of population-weighted particulate matter exposure
- Luft
- Umwelt und Gesundheit
- Diagramme
- Umwelt-Indikatoren
- Daten und Tabellen

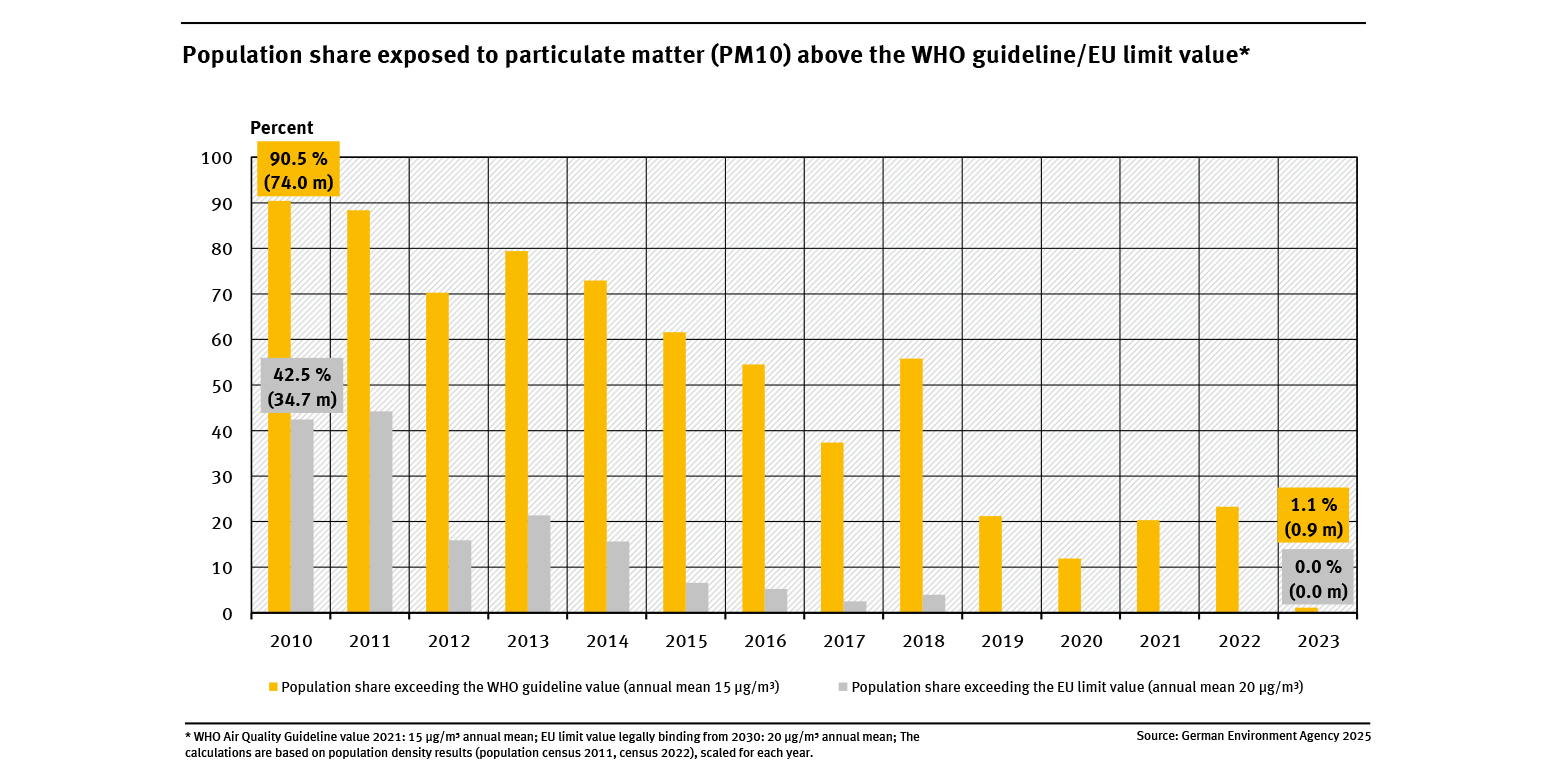
Population share exposed to particulate matter (PM10) above the WHO guideline/EU limit value
- Luft
- Umwelt und Gesundheit
- Diagramme
- Umwelt-Indikatoren
- Daten und Tabellen

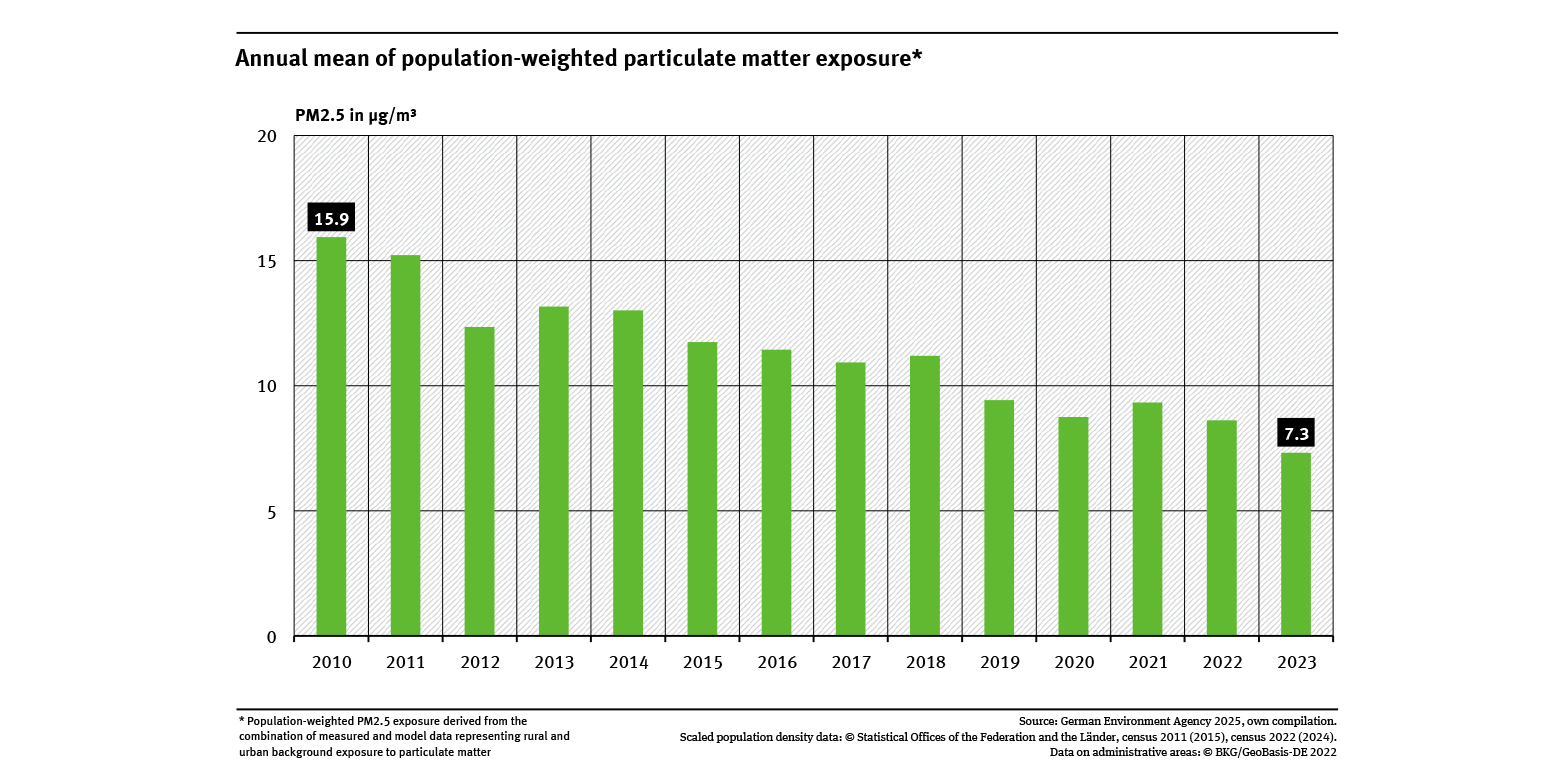
Annual mean of population-weighted particulate matter exposure
- Luft
- Umwelt und Gesundheit
- Diagramme
- Umwelt-Indikatoren
- Daten und Tabellen

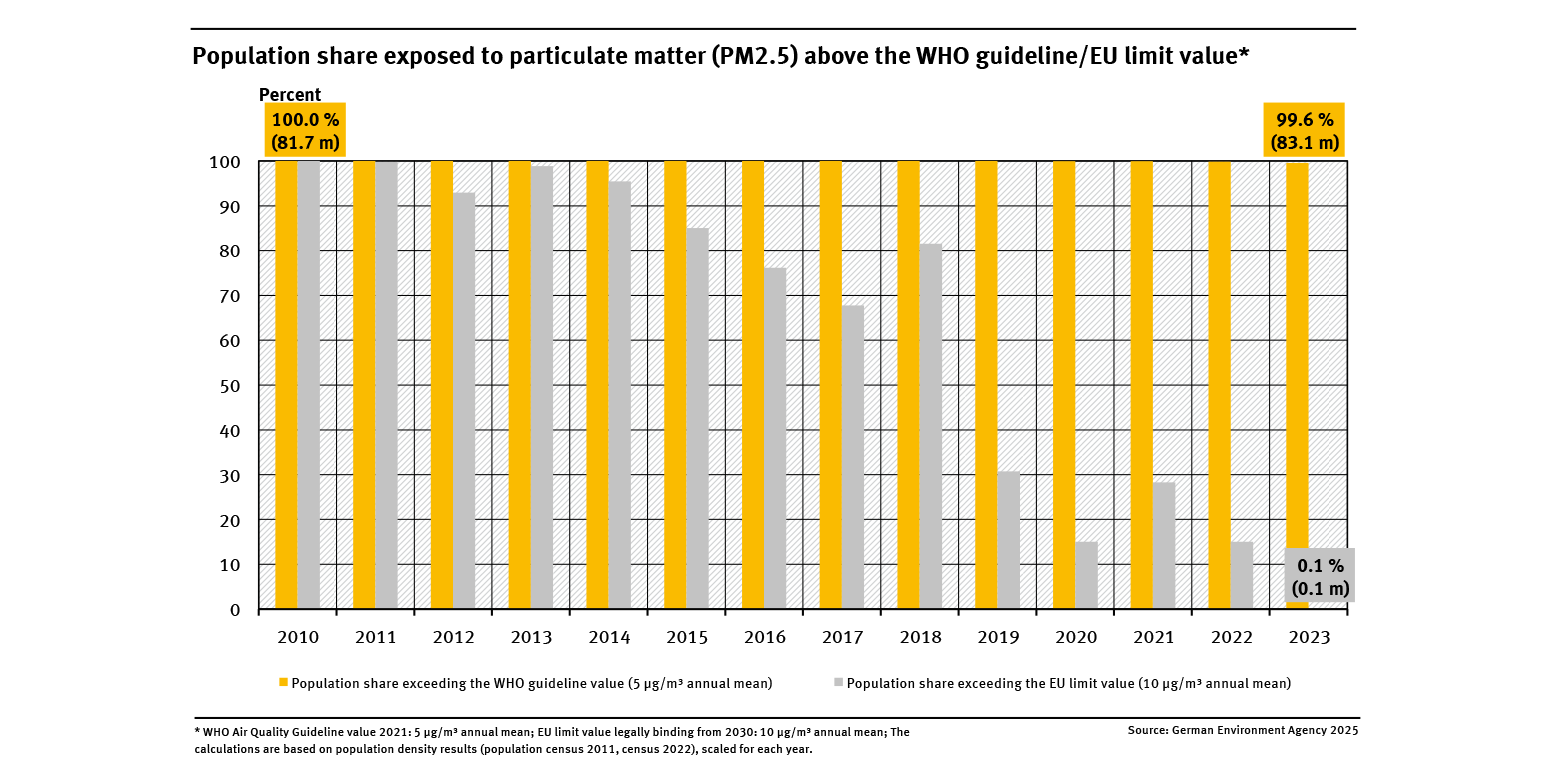
Population share exposed to particulate matter (PM2.5) above the WHO guideline/EU limit value
- Luft
- Umwelt und Gesundheit
- Diagramme
- Umwelt-Indikatoren
- Daten und Tabellen

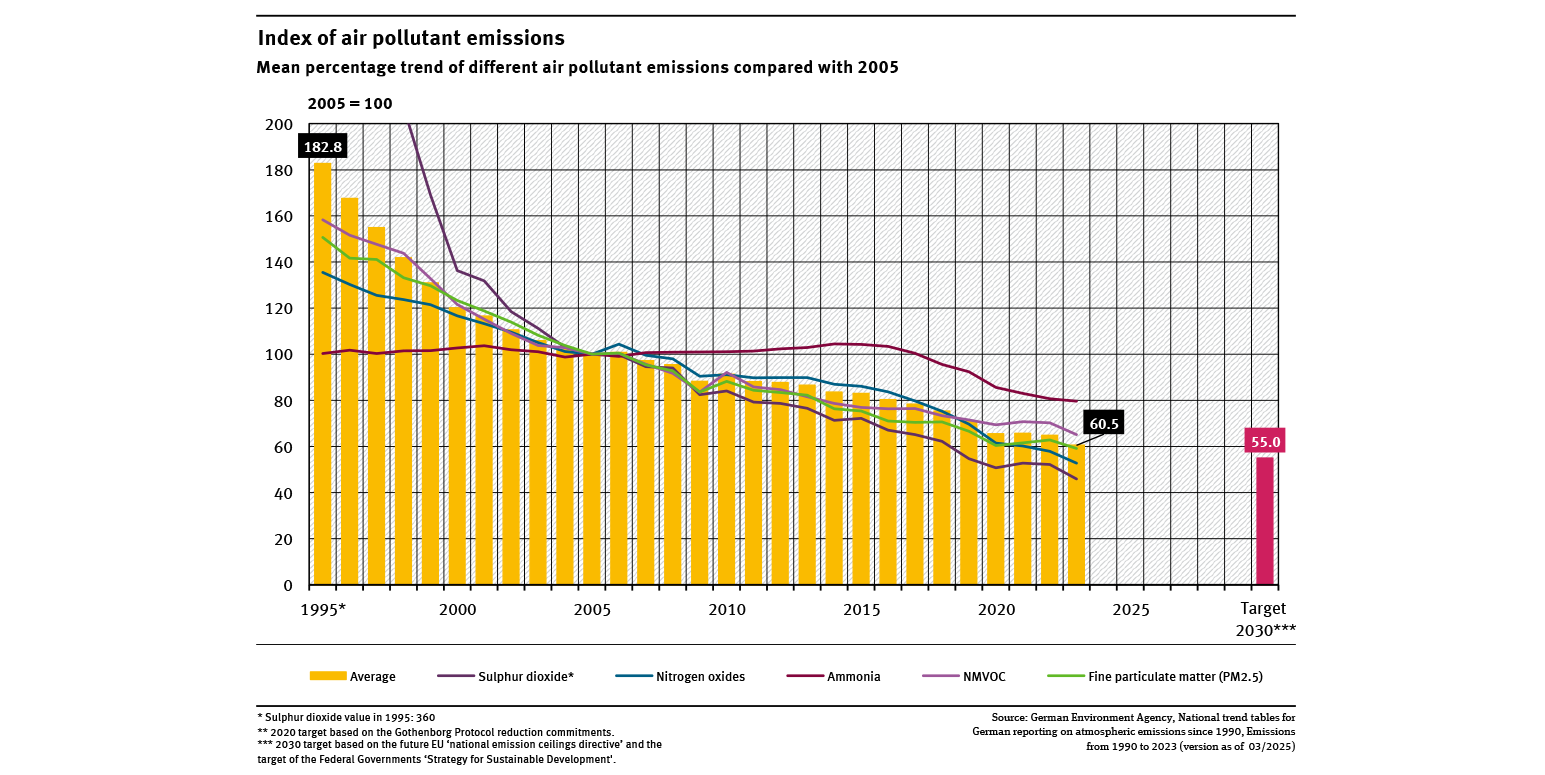
Index of air pollutant emissions
- Luft
- Diagramme
- Umwelt-Indikatoren
- Daten und Tabellen