Skip to main content Skip to main menu Skip to footer

HUE-2: Usage of warning and information services

The illustration HUE-2 ’Usage of warning and information services’ contains a stacked columns chart showing four columns indicating the proportion of respondents who were using the warning and information services. There are data for the years 2012, 2014, 2016 and 2021.
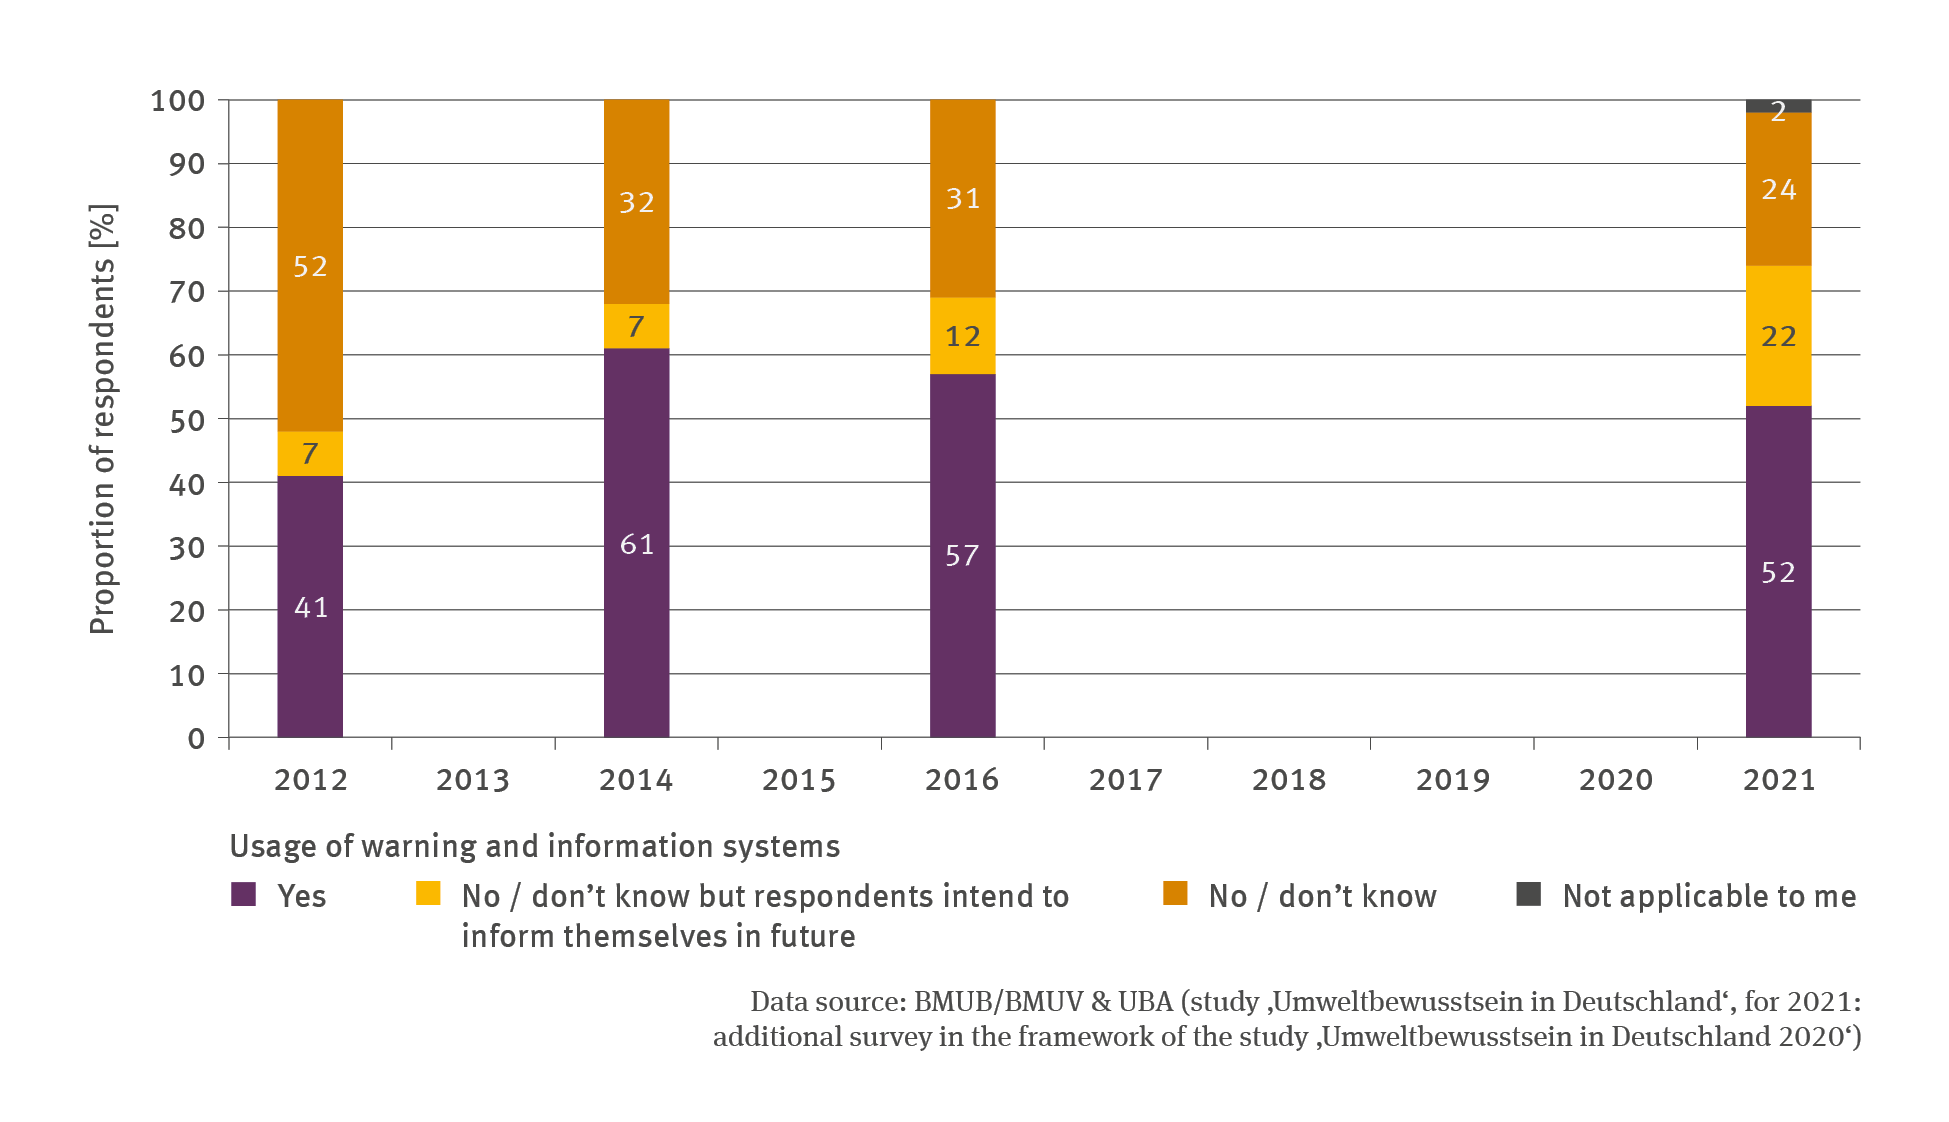
Source: BMUB/BMUV & UBA (study ‚Umweltbewusstsein in Deutschland‘/ for 2021: additional survey in the framework of the study ‚Umweltbewusstsein in Deutschland 2020‘)
Download image (81.77 kB)

The following contents contain this medium:

Tags

Short link: www.uba.de/m42704en