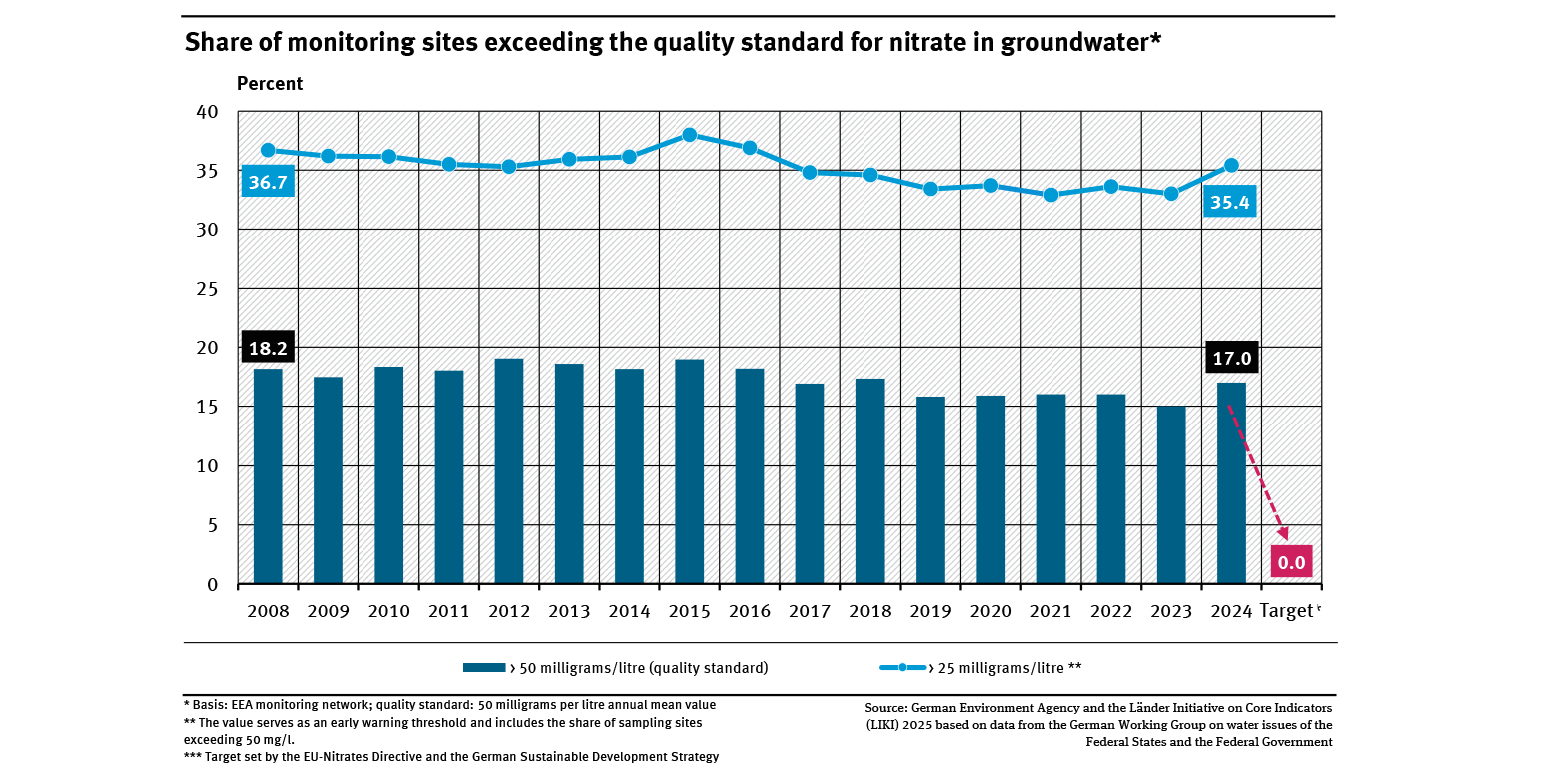
Skip to main content Skip to main menu Skip to footer

Data Search

Data Search

Here you will find diagrams, infographics, maps and tables for direct download.

Data Search

A graph shows the 5-year averages for 2003 to 2023 of the proportion of fulmars with stomachs containing over 0.1 grammes of plastic. The indicator has declined slightly and is at 48 %.

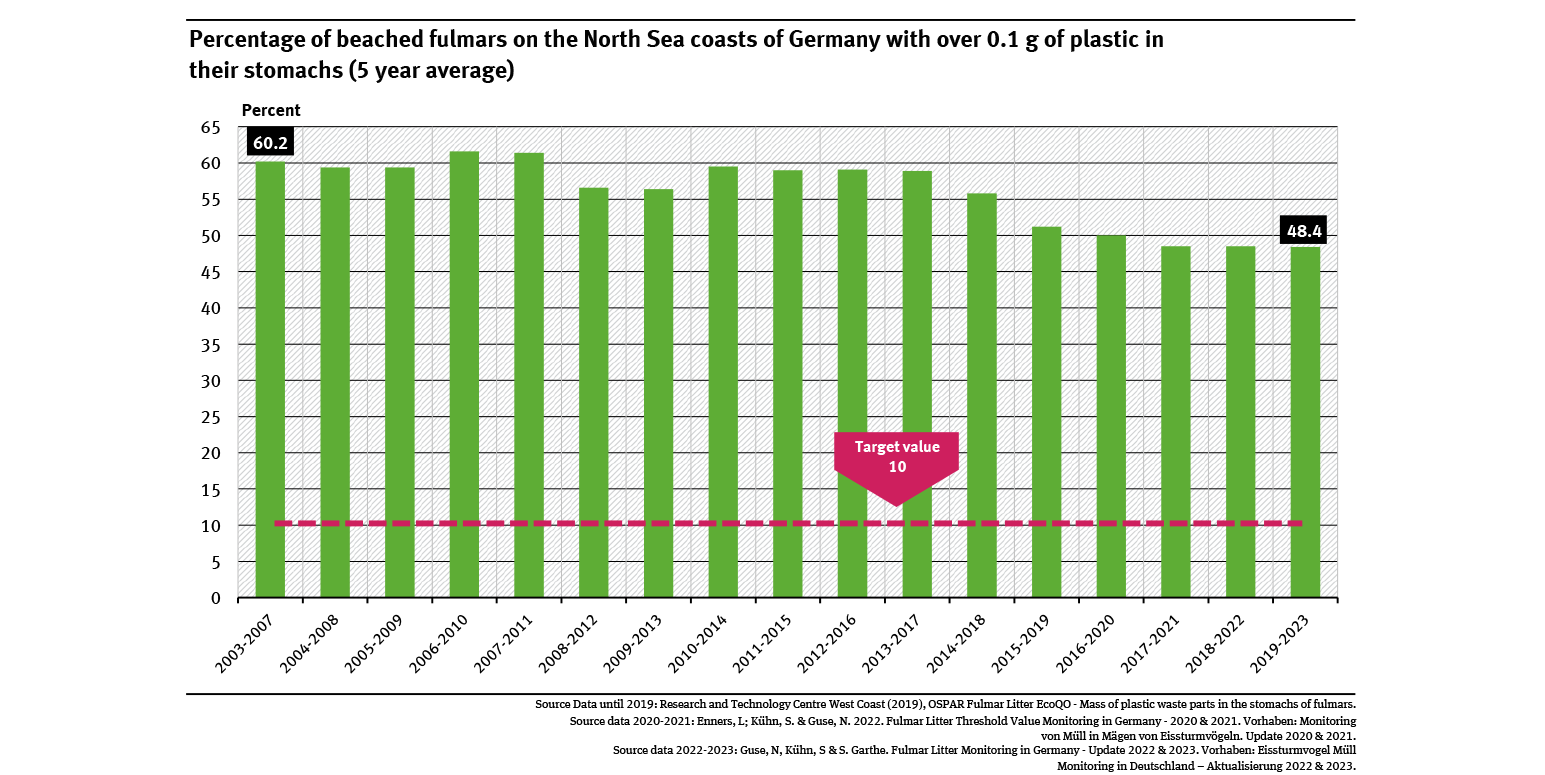
Percentage of beached fulmars on the North Sea coasts of Germany with over 0.1 g of plastic ...

  • Wasser
  • Diagramme
  • Umwelt-Indikatoren
  • Daten und Tabellen
Export data
A graph shows good and sufficient bathing water quality levels for coastal and inland waters (1992 to 2024). Bathing water quality increased significantly, especially in the 1990s. The target value of 100 % bathing waters with at least sufficient quality was almost reached in 2015 and has been constantly at a high level since then.

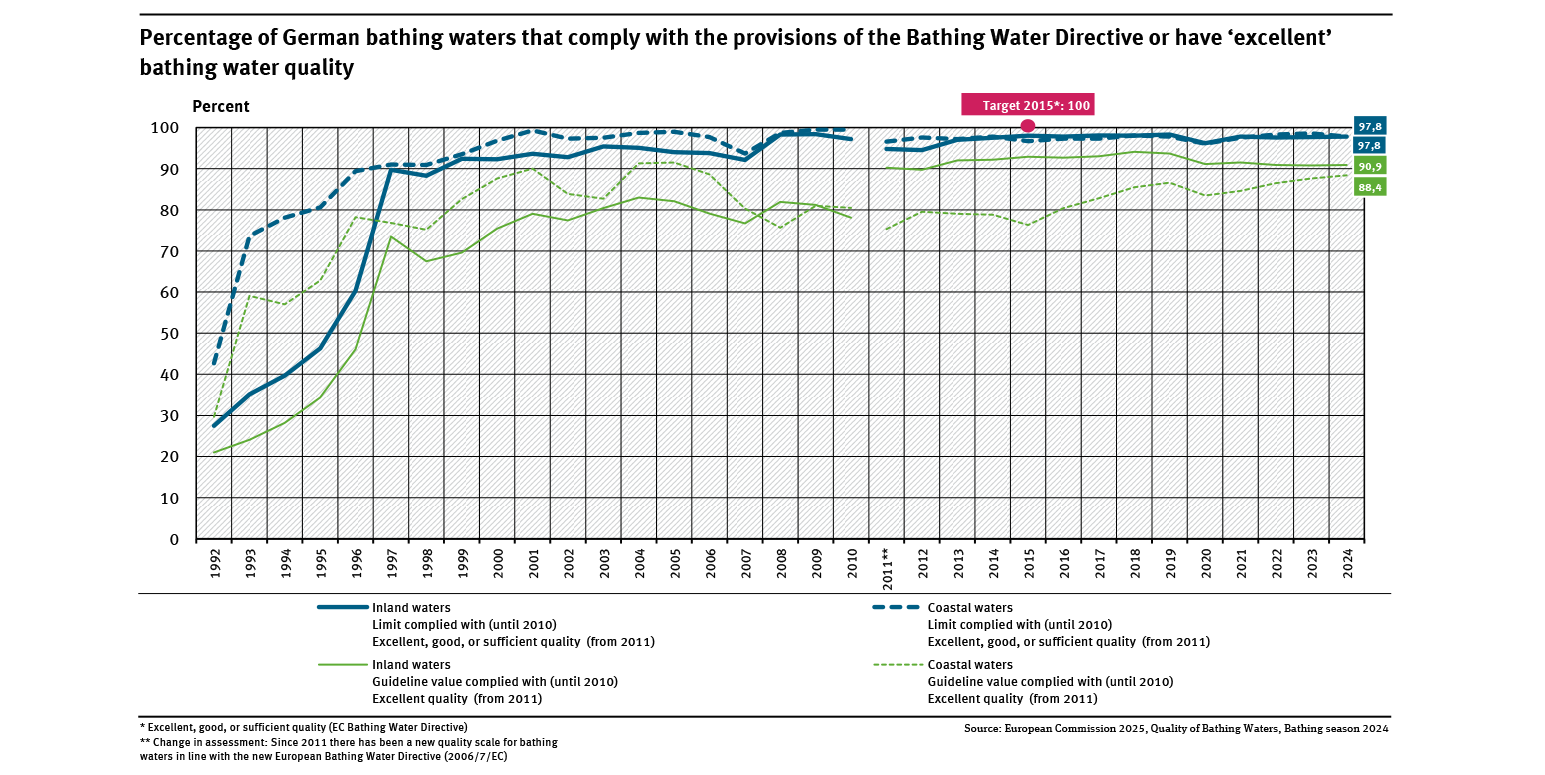
Percentage of German bathing waters that comply with the provisions of the Bathing Water Directive..

  • Wasser
  • Umwelt und Gesundheit
  • Diagramme
  • Umwelt-Indikatoren
  • Daten und Tabellen
Export data
A graph shows the change in the concentration of total nitrogen in all major rivers that discharge into the North and Baltic Sea in Germany and indicates the target value of 2.8 or 2.6 mg/L total nitrogen for North and Baltic Sea, respectively. The concentration value is calculated as the 5-year moving average of the flow-weighted mean concentration of all major rivers in milligrams total nitrogen per litre (mg/L).

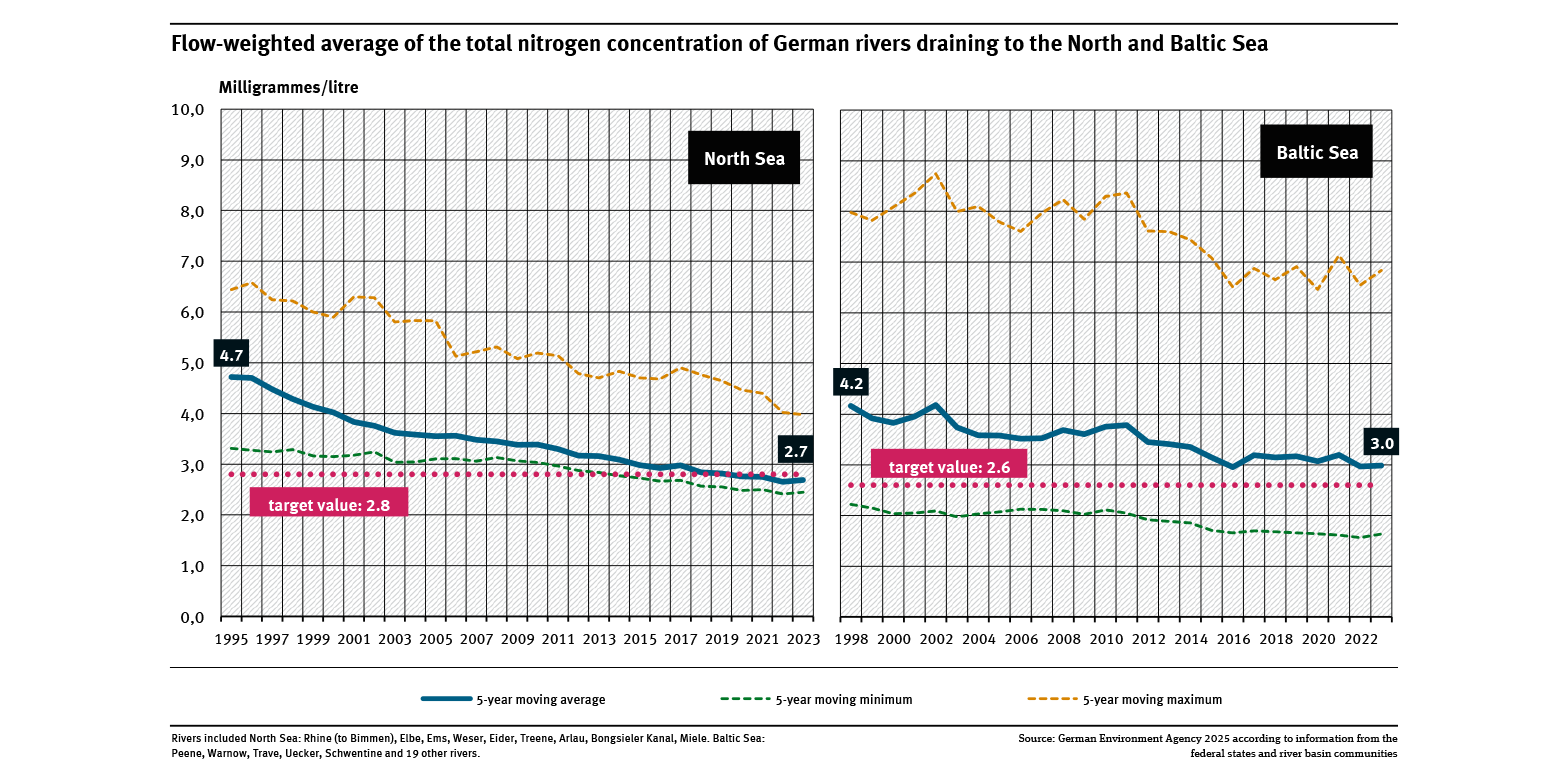
Outflow-weighted mean of the total nitrogen concentration of the North Sea and Baltic Sea inlets

  • Wasser
  • Diagramme
  • Umwelt-Indikatoren
  • Daten und Tabellen
Export data
A graph shows the water exploitation index for the years 1991 to 2022. Values are available for every three or four years. The index fell almost constantly and has been below the critical value of 20 percent since 2007. This presentation is based on the long-term potential water supply of 176 billion m³.

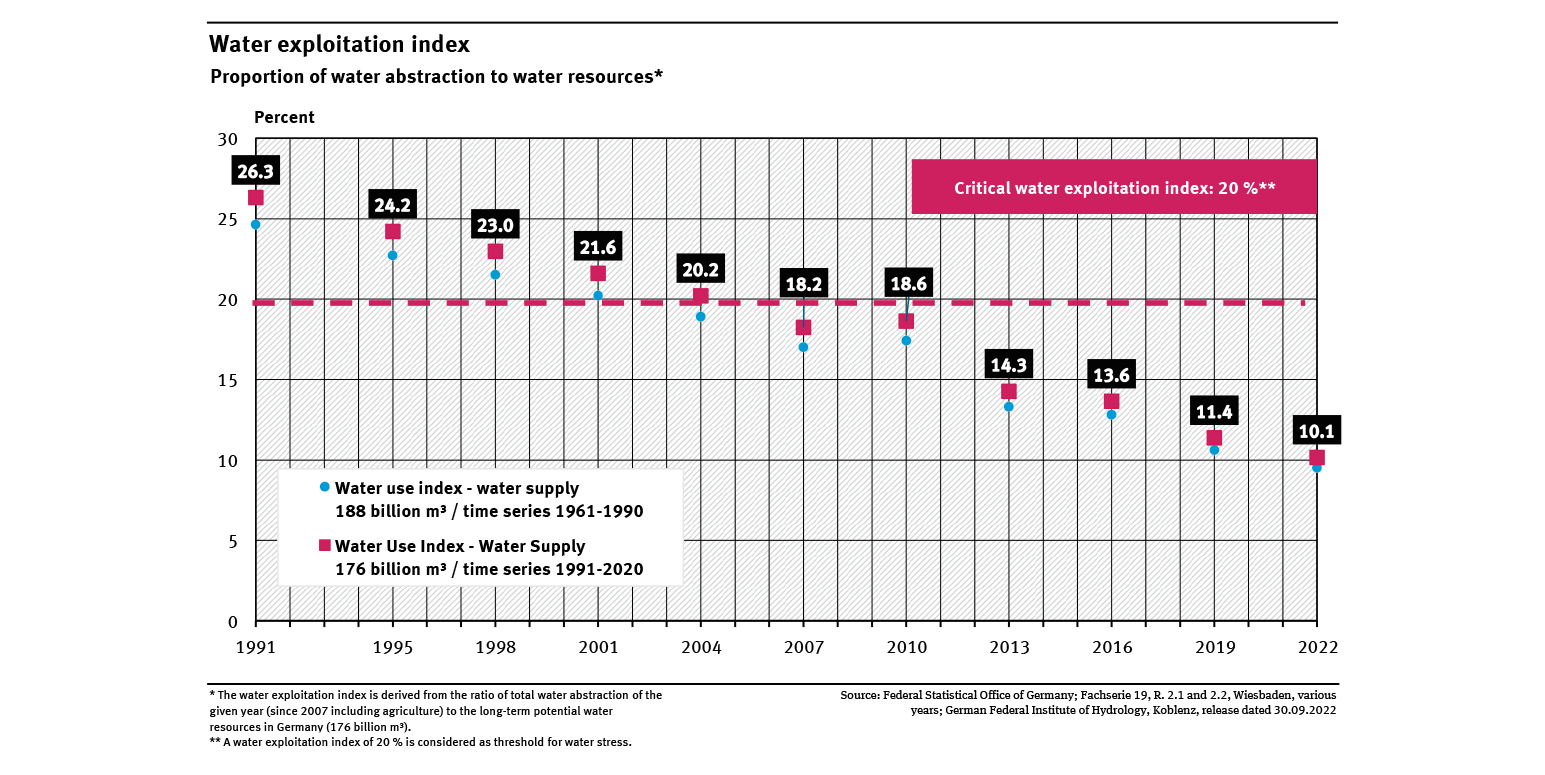
Water exploitation index

  • Wasser
  • Diagramme
  • Umwelt-Indikatoren
  • Daten und Tabellen
Export data
A graph shows the measuring points that do not comply with the orientation values for phosphorus for the years 1982 to 2023. These are divided into quality classes depending on the level of exceedance. The proportion without exceedances has increased. The proportion of medium and severe exceedances (QC IV) has fallen sharply.

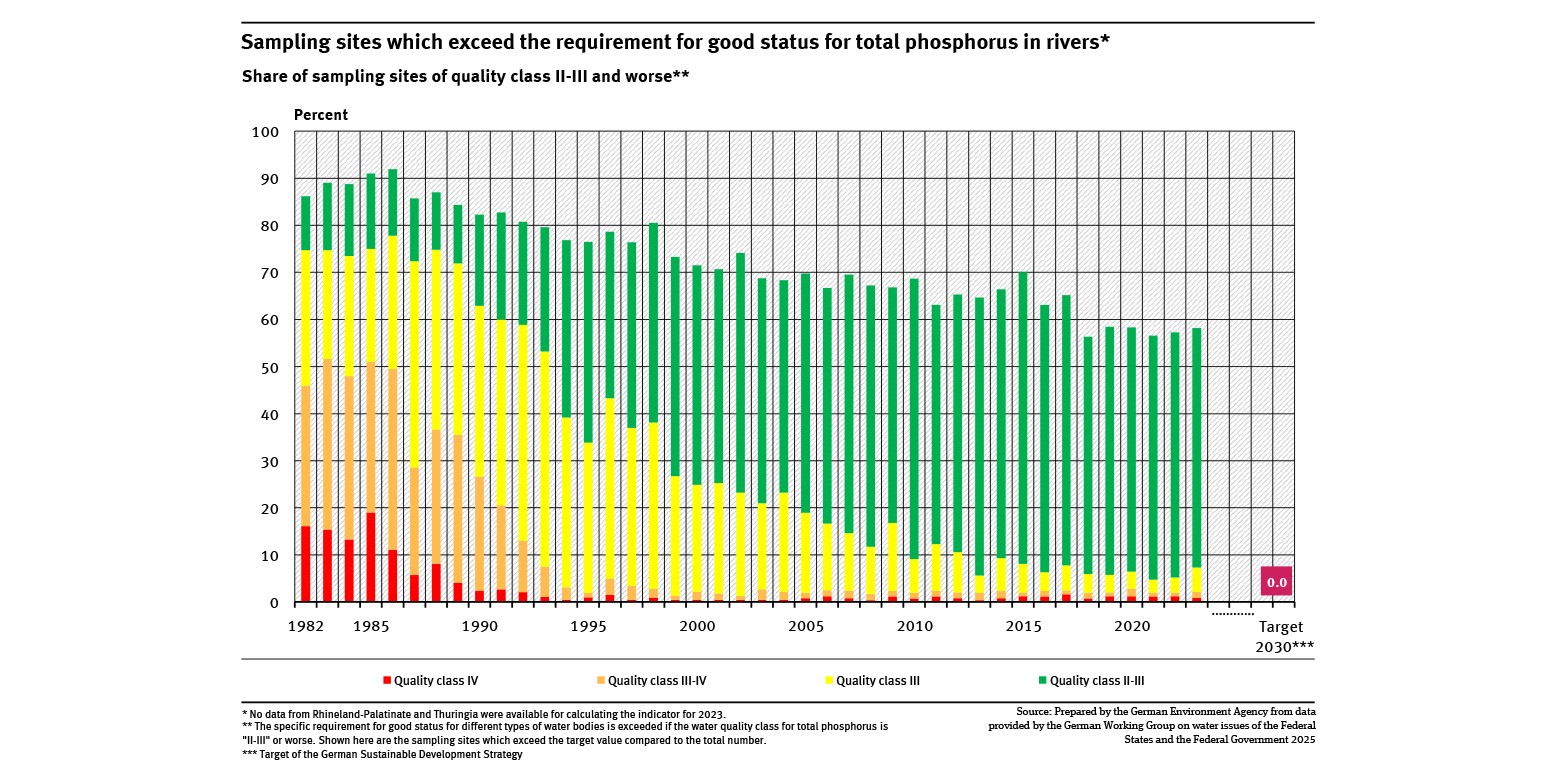
Sampling sites which exceed the requirement for good status for total phosphorus in rivers

  • Wasser
  • Diagramme
  • Umwelt-Indikatoren
  • Daten und Tabellen
Export data
A graph shows the proportion of groundwater sampling sites where nitrate measurements for the years 2008 to 2023 were above 25 and 50 milligrams per litre. In the period covered, neither sub-indicator has shown any significant change.

Proportion of sampling sites which exceed the target value for nitrate in ground water

  • Wasser
  • Diagramme
  • Umwelt-Indikatoren
  • Daten und Tabellen
Export data
The illustration RO-R-3 ’Priority and restricted areas reserved for (preventive) flood control’ contains a biaxial chart. A line shows the terrain of priority and restricted areas reserved for (preventive) flood control in terms of indexed values. The year 2009 is fixed at 100. Overall the time series shows the years 2009 to 2021. It shows a significantly rising trend. Especially in the periods from 2009 to 2012 and 2017 to 2021 respectively, the values are clearly increasing, ultimately to 188.

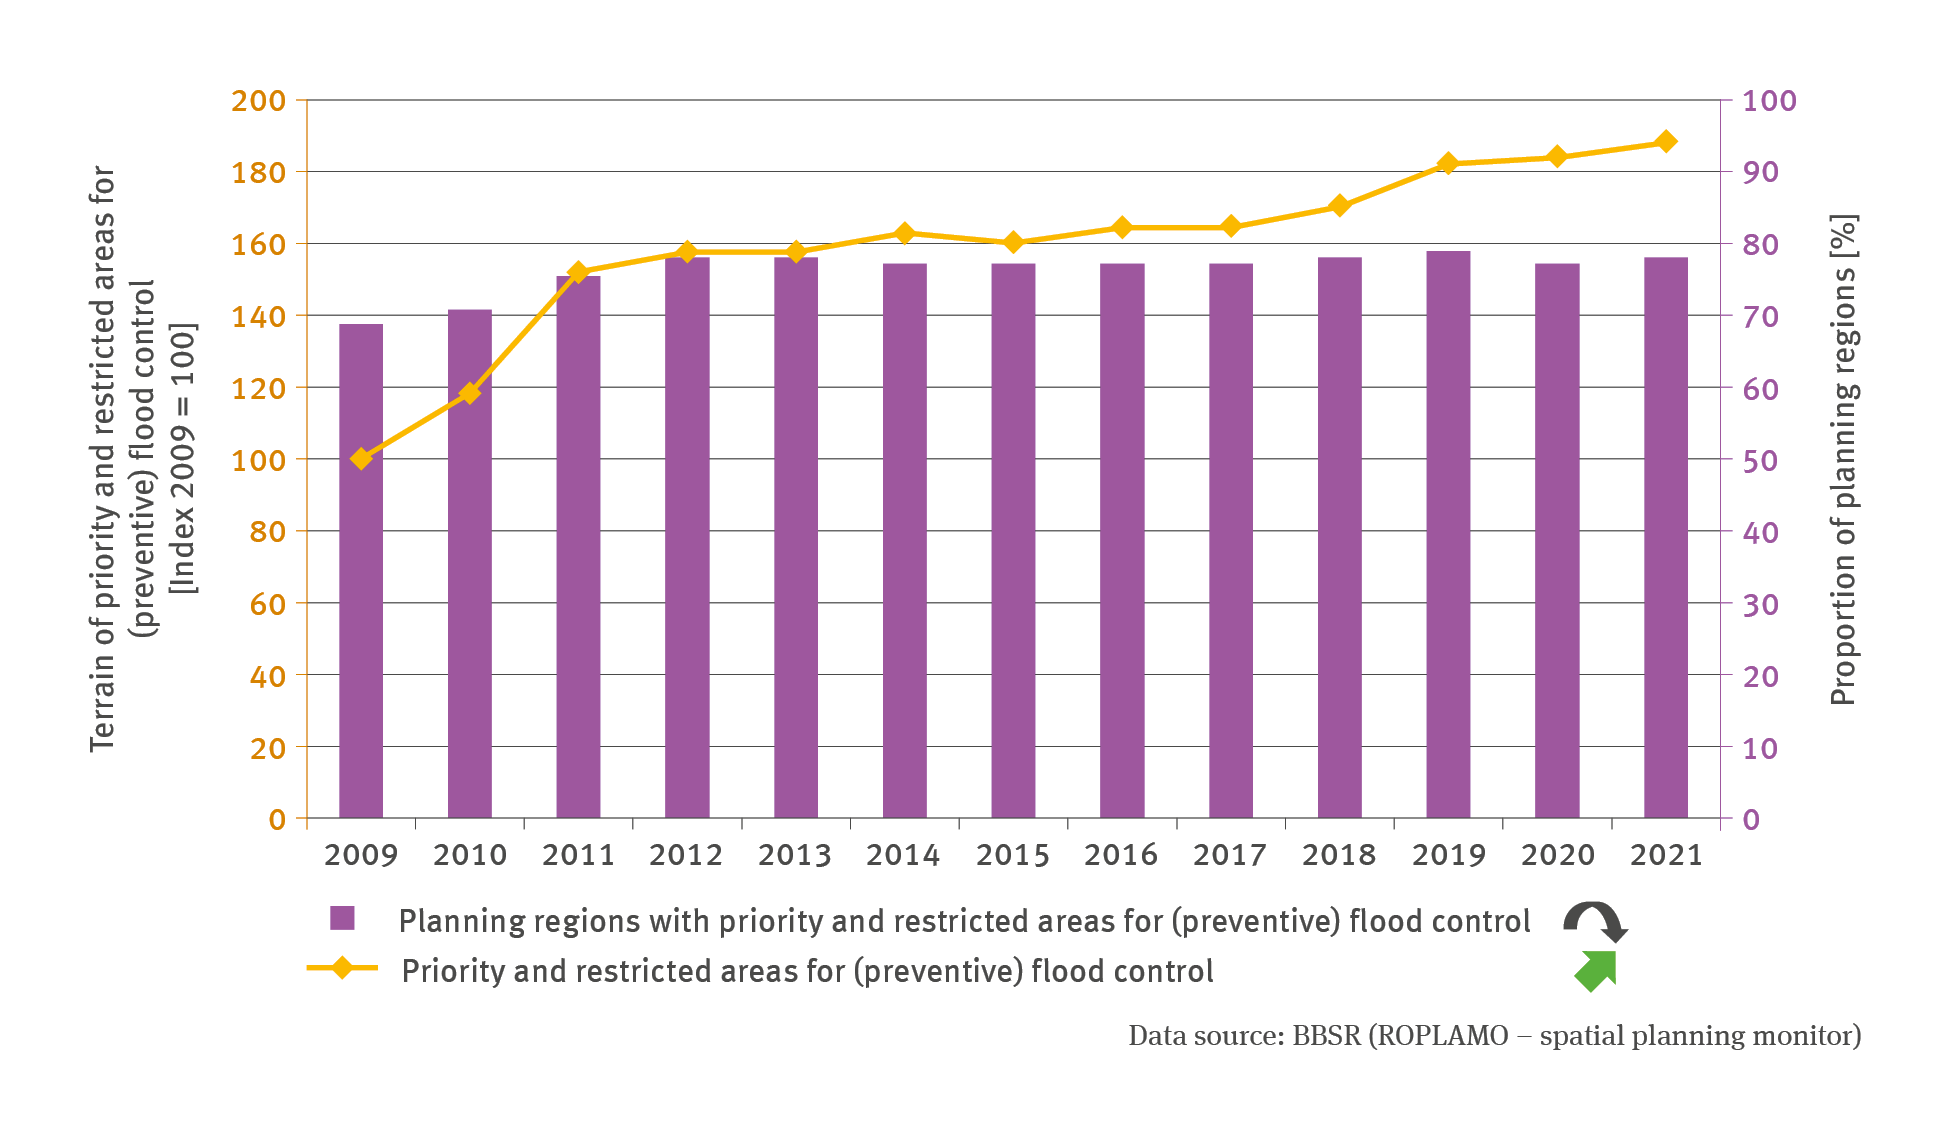
RO-R-3: Priority and restricted areas for (preventive) flood control

  • Klima
  • Fläche, Boden, Land-Ökosysteme
  • Wasser
  • Diagramme
Export data
PNG
The illustration RO-R-2 ’Priority and restricted areas reserved for groundwater conservation / drinking water abstraction’ contains a biaxial chart. A line shows the terrain of priority and restricted areas for groundwater conservation / drinking water abstraction in terms of indexed values. The year 2009 is fixed at 100. Overall the time series shows the years 2009 to 2021.

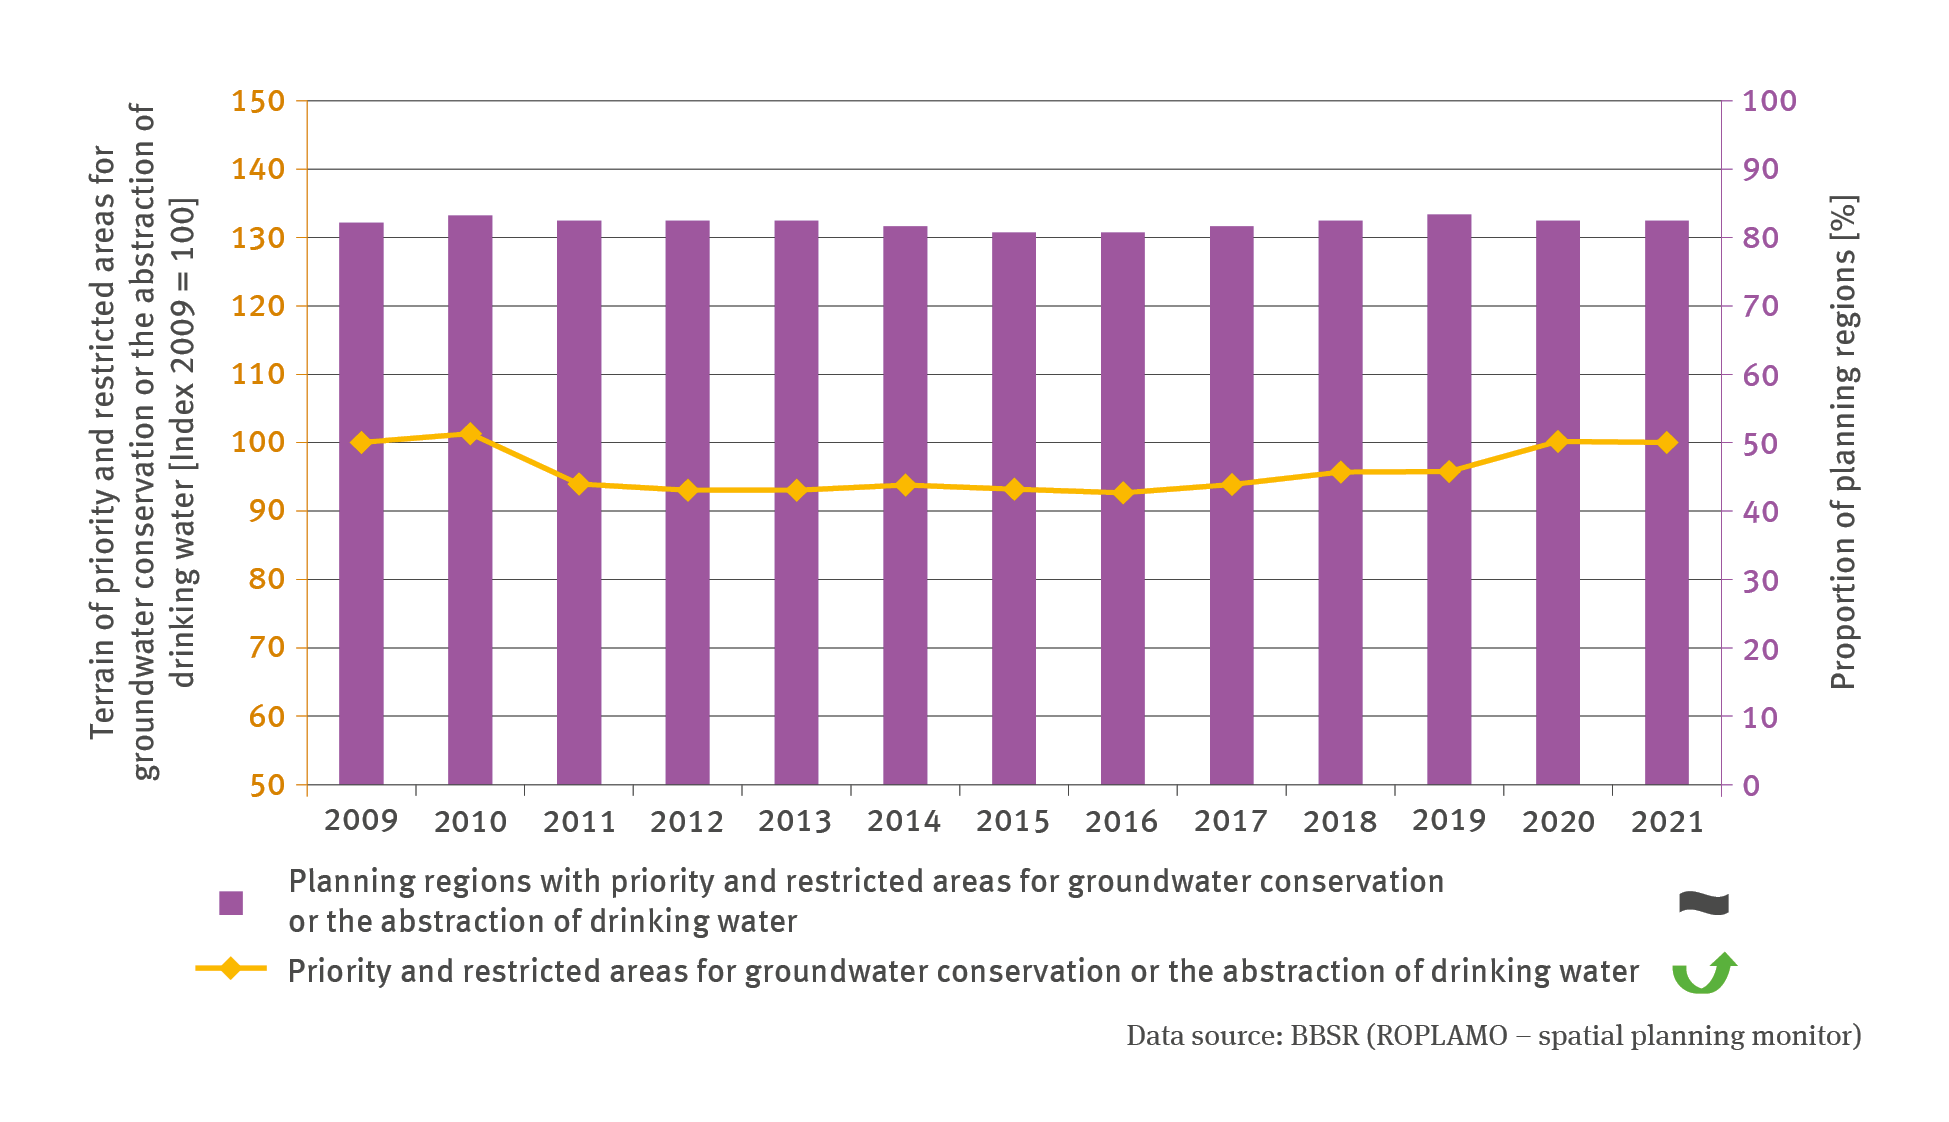
RO-R-2: Priority and reserved areas groundwater / drinking water

  • Klima
  • Fläche, Boden, Land-Ökosysteme
  • Wasser
  • Diagramme
Export data
PNG
The illustration TOU-I-1 ’Coastal bathing temperatures’ contains a line chart showing the duration of water temperatures in excess of 15 degrees Celsius in terms of the number of days, differentiated for the North Sea and the Baltic Sea for the period from 1992 and 1989 to 2021 respectively. There is a significantly rising trend in both cases.

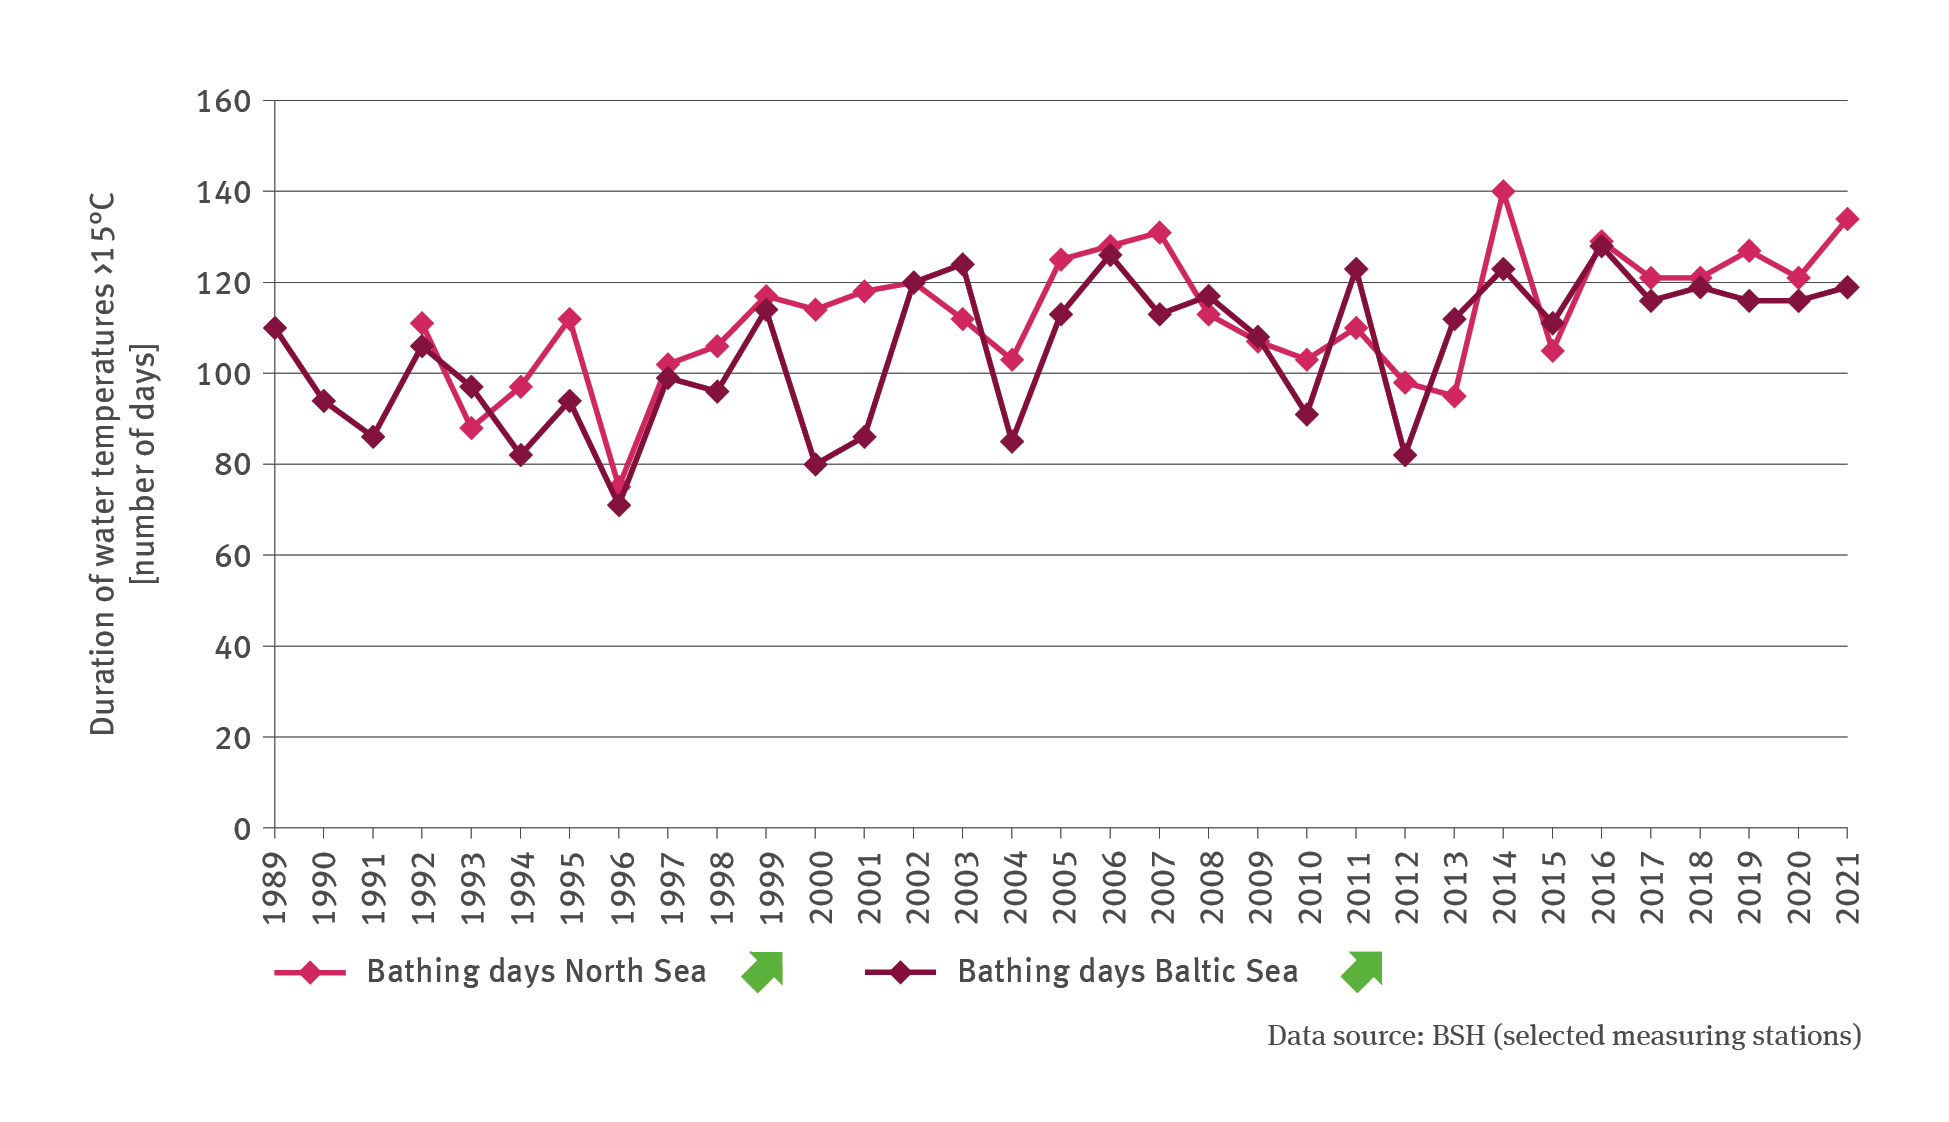
TOU-I-1: Coastal bathing temperatures

  • Klima
  • Wasser
  • Private Haushalte und Konsum
  • Diagramme
Export data
PNG
The illustration VE-I-3 ’Heavy rain impacting on roads’ shows stacked columns describing the percentage of the section length of federal trunk roads subjected to an exceedance of heavy rain at warning level 3 (tempest). Five categories are illustrated for the impacts, according to the number of hours concerned. 1 to 3 hours, more than 3 to 6 hours, more than 6 to 12 hours, more than 12 to 24 hours, and more than 24 hours. The highest category is represented in a few years only.

VE-I-3: Heavy rain impacting on roads

  • Klima
  • Wasser
  • Verkehr
  • Diagramme
Export data
PNG

You can also search in other data portals of the German Environment Agency

Short link: www.umweltbundesamt.de/n300701en