Skip to main content
Skip to main menu
Skip to footer
DE
Topics
Data
Publications
The UBA
back
Topics
Climate | Energy
Health
Chemicals
Economics | Consumption
Noise
Transport
Waste | Resources
Air
Water
Agriculture
Soil | Land
Sustainability | Strategies | International
Digitalisation
back
Climate | Energy
Climate change
European Methane Regulation
Climate Impacts and Adaptation
Climate protection and energy policy in Germany
Accelerating global climate action by 2030
Fluorinated Greenhouse Gases and Fully Halogenated CFCs
Renewable energies
Ten country reports on ambitious climate policy
Ambitious greenhouse gas mitigation in agriculture
Nationally Determined Contributions (NDC)
The Global Stocktake under the Paris Agreement
The 1.5°C goal of the Paris Agreement
Geoengineering
back
Climate change
Climate and greenhouse effect
back
Climate Impacts and Adaptation
News
Impacts of climate change
Adaptation to climate change
Competence center KomPass
back
Impacts of climate change
Monitoring Report 2023
Climate Impacts Germany
Risks and potential for adaptation
Climate models and scenarios
back
Monitoring Report 2023
Introduction
Development of Germany’s climate
Indicators of climate change impacts and adaptation
back
Indicators of climate change impacts and adaptation
Cluster Human Health
Cluster Water balance and water management
Cluster Coastal and marine protection
Cluster Fisheries
Cluster Soil
Cluster Agriculture
Cluster Woodland and forestry
Cluster Biological diversity
Cluster Building Sector
Cluster Energy industry
Cluster Transport, transport infrastructure
Cluster Trade and industry
Cluster Tourism industry
Cluster Financial services industry
Cluster Spatial, regional and urban development planning
Cluster Civic protection
Cluster Cross-sectional activities carried out at Federal level
back
Cluster Human Health
Effects chain – Example from the ‘human health’ action field
GE-I-1: Heat stress
GE-I-2: Heat-related mortalities
GE-I-3: Birch pollen burdens
GE-I-4: Ragweed pollen burden
GE-I-5: Pathogen vectors – case study
GE-I-6: Contamination of bathing waters by cyanobacteria burdens
GE-I-7: Health hazards from vibrios – case study
GE-I-8: Index – case study
GE-I-9: Ozone burden
GE-R-1 + 2: Heat warning service and Public awareness of health problems
GE-R-3: Information on pollen
GE-R-4: Submissions for the Mückenatlas
back
Cluster Water balance and water management
Effects chain – Example ‘water balance and water management’
WW-I-1: Terrestrially stored water
WW-I-2: Groundwater level and spring flow – Northern and Southern Region
WW-I-3: Mean discharge
WW-I-4: Floodwater
WW-I-5: Peak discharge values in watercourses
WW-I-6: Low water
WW-I-7: Water levels in lakes
WW-I-8: Water temperature in lakes
WW-I-9: Spring algal bloom in lakes
WW-I-10: Water temperature of watercourses
WW-R-1: Water use index
WW-R-2 + 3: GAK funds for and investments in flood protection
back
Cluster Coastal and marine protection
Effects chain – Example ‘coastal and marine protection’
KM-I-1: Water temperature in the sea
KM-I-2: Sea levels
KM-I-3: Height of storm surges
KM-I-4: Coastal morphology – case study
KM-I-5: Change of flow direction
KM-I-6: Pumping station performance – case study
KM-R-1: Investments in coastal protection
KM-R-2: Land protection dykes without safety deficit – case study
back
Cluster Fisheries
Effects chain – Example presentation from the ‘fisheries’ action field
FI-I-1: Distribution of thermophilic marine species
FI-I-2: Herring larvae in the Greifswalder Bodden
FI-I-3: Occurrence of thermophilic species in inland waters – case study
back
Cluster Soil
Effects chain – Example presentation from the ‘soil’ action field
BO-I-1 + 2: Soil water in agriculturally used soils and soil water in forest soils – case study
BO-I-3: Rainfall erosivity
BO-I-4: Temperature in the topsoil
BO-R-1: Humus contents in soils of arable land and grassland soils – case study
BO-R-2: Permanent grassland terrain
back
Cluster Agriculture
Effects chain – Example presentation from the ‘agriculture’ action field
LW-I-1: Agrophenological phase shifts
LW-I-2: Yield fluctuations
LW-I-3: Hailstone damage in agriculture
LW-I-4: Infestation with pest organism – case study
LW-R-1: Adaptation of management rhythms
LW-R-2 + 3: Cultivation and production of thermophilic arable crops and adaptation of the variety spectrum in viticulture
LW-R-4: Cultivation of thermophilic crops
LW-R-5: Sales and application of pesticides
LW-R-6: Agricultural irrigation
back
Cluster Woodland and forestry
Effects chain – Example presentation from the ‘woodland and forestry’ act
FW-I-1: Tree species composition in natural forest reserves - case study
FW-I-2: Incremental growth in timber
FW-I-3 + 4: Forest condition and dieback rate
FW-I-5: Damaged timber – extent of random use
FW-I-6 + 7: Endangered spruce stands and spruce bark beetle
FW-I-8: Forest fire hazards and forest fires
FW-R-1: Financial support for forest transformation
FW-R-2: Conservation of forest-genetic resources
FW-R-3: Humus reserves in forest soils
FW-R-4 + 5: Utilisation of raw timber and timber construction quota
FW-R-6: Silvicultural information on the theme of adaptation
back
Cluster Biological diversity
BD-I-1: Phenological changes in wild plant species
BD-I-2: Temperature index for bird species communities
BD-I-3: Temperature index of butterfly species communities
BD-R-1: Consideration of climate change in landscape programmes and framework plans
BD-R-2: Restoration of natural flood plains
BD-R-3: Protected areas
back
Cluster Building Sector
Effects chain – Example presentation from the ‘building sector’ action field
BAU-I-1 + 2: Heat stress in urban environments and summer heat island effect
BAU-I-3: Cooling degree days
BAU-I-4: Heavy rain in residential areas
BAU-I-5: Claims expenditure for property insurance
BAU-R-1: Recreation areas
BAU-R-2: Green roofs in cities
BAU-R-3: Investments in the energetic refurbishment of building envelopes
BAU-R-4: Insurance density of extended natural hazard insurance for residential buildings
back
Cluster Energy industry
EW-I-1+2: Weather-related disruptions in and unavailabilty of power supply
back
Cluster Transport, transport infrastructure
Effects chain – Example presentation from the ‘transport' action field
VE-I-1 + 2: Flood closures and low water restrictions on the Rhine
VE-I-3: Heavy rain impacting on roads
VE-I-4: Road accidents due to weather conditions and weather patterns
VE-I-5: Impacts on roads due to weather conditions and weather patterns
VE-I-6: Weather-related disruptions to the railway infrastructure
back
Cluster Trade and industry
Effects chain – Example presentation from the ‘trade and industry’ action
IG-I-1: Heat-related decrease in efficiency
IG-R-1: Perception of the relevance of physical climate risks in trade and industry
IG-R-2: Exposure of Germany’s foreign trade to global climate change
IG-R-3: Water procurement in the processing industry
back
Cluster Tourism industry
Effects chain – Example presentation from the ‘tourism industry’ action field
TOU-I-1: Coastal bathing temperatures
TOU-I-2: Snow cover for winter tourism
TOU-I-3: Market shares held by wider tourism areas
TOU-R-1: Seasonality of bed-nights in wider tourism areas
back
Cluster Financial services industry
Effects chain – Example presentation from the ‘financial services industry' action field
FiW-I-1:Claims ratio, combined ratio in homeowners’ comprehensive insurance
FiW-R-1: Public awareness of storm and flooding risks
FiW-R-2: Awareness of physical climate risks among financial services
back
Cluster Spatial, regional and urban development planning
RO-R-1: Priority and restricted areas reserved for wildlife and landscape conservation
RO-R-2: Priority and reserved areas groundwater / drinking water
RO-R-3: Priority and restricted areas for (preventive) flood control
RO-R-4: Priority and restricted areas reserved for special climate functions
RO-R-5: Increase in settlement and transport areas
RO-R-6: Land use for settlements in officially designated flood plains
back
Cluster Civic protection
Effects chain – Example presentation from the ‘civic protection’ action field
BS-I-1: Person hours due to weather-related damage events
BS-R-1: Information on how to act in a disaster situation
BS-R-2: Precautions taken among the population
BS-R-3: Exercise volume
BS-R-4: Active emergency relief responders in civic protection
back
Cluster Cross-sectional activities carried out at Federal level
HUE-1: Manageability of climate change impacts
HUE-2: Usage of warning and information services
HUE-3: Federal grants for promoting research projects on climate change impacts and adaptation
HUE-4: Adaptation to climate change at the municipal level
HUE-5: International finance for climate adaptation (from budgetary funds)
back
Climate models and scenarios
Introduction to Climate Projections
back
Adaptation to climate change
Regional and sectoral adaptation
Adaptation at the Federal Level
Adaptation at EU level
Adaptation in Companies
Adaptation tools
back
Competence center KomPass
KomPass Projects
back
Climate protection and energy policy in Germany
RESCUE – Resource-Efficient Pathways towards Greenhouse-Gas-Neutrality
back
RESCUE – Resource-Efficient Pathways towards Greenhouse-Gas-Neutrality
Scenario GreenLate
Scenario GreenMe
Scenario GreenLife
Scenario GreenSupreme
Methods
Main results
Conference on “Resource-Efficient Decarbonisation Pathways“
back
Fluorinated Greenhouse Gases and Fully Halogenated CFCs
Statutes and regulations
Application domains and emission reduction
Emissions and degradation products
back
Statutes and regulations
EU Regulation concerning fluorinated greenhouse gases
back
Application domains and emission reduction
Supermarket refrigeration
Commercial Refrigeration
Heat pumps
Building air conditioning
Moble air conditioning in cars, buses and railway vehicles
Eco-friendly transport refrigeration
Switchgear
back
Moble air conditioning in cars, buses and railway vehicles
Mobile air conditioning with climate-friendly refrigerant CO2
Mobile air conditioning with fluorinated refrigerants
Climate friendly mobile air conditioning for buses
Mobile air conditioning in rail vehicles
back
Emissions and degradation products
German emissions of fluorinated greenhouse gases
TFA as degradation product of fluorinated greenhouse gases
Persistent fluorinated greenhouse gases
back
Renewable energies
Renewable energies in figures
Guarantees of origin for renewable energy sources
Guarantees of regional origin for renewable energy sources
back
Nationally Determined Contributions (NDC)
Nationally Determined Contribution (NDC) design
back
The Global Stocktake under the Paris Agreement
Results of the Global Stocktake in the new NDCs
back
Health
Environmental medicine
Environmental impact on people
Assessing environmentally-related health risks
Commissions and Working Groups
Environment and Health: newsletters and series
WHO Collaborating Centre for Air Quality Management
back
Environmental medicine
Autism Spectrum Disorder
COPD
Environmental pollution and diseases of the elderly
Allergies
Headaches
Multiple Chemical Sensitivity (MCS)
The Sick Building Syndrome (SBS)
back
Environmental impact on people
Chemical substances
Environmental justice – Environment, health and social conditions
Special Exposure Situations
Climate change and health
Indoor air hygiene
Mould
Nanomaterial
back
Chemical substances
Endocrine disruptors
Formaldehyde
Fragrances
Lead at Christmas and on New Year's Eve
Volatile Organic Compounds (VOC)
back
Environmental justice – Environment, health and social conditions
Research project “Environmental justice in urban areas”
Pilot project on environmental justice in German municipalities
back
Special Exposure Situations
Emissions from wood and coal burning stoves in residential areas
Holi – Festival of colours and dust
Ozone and open air sport events
back
Indoor air hygiene
Substances in building products
Ventilation to combat "stale" air
back
Substances in building products
Harmonisation of health assessment – LCI values and EU-LCI values
back
Assessing environmentally-related health risks
2nd International Conference on Human Biomonitoring, Berlin
Environmental burden of disease
Epidemiology
Epigenetics and Environmental Influences
Health-related exposure assessment
Human biomonitoring
Human biomonitoring in Europe
Environmental Specimen Bank
German Environmental Survey, GerES
HBMC2020
ALISE: Aligned Study for Environmental Health
back
Health-related exposure assessment
Database for health-related exposure assessment
back
Human biomonitoring
Cooperation for the promotion of human biomonitoring
back
Human biomonitoring in Europe
HBM4EU: European Human Biomonitoring Initiative
Project DEMOCOPHES
back
German Environmental Survey, GerES
German Environmental Survey, GerES VI (2023-2024)
German Environmental Survey 2014-2017, GerES V
German Environmental Survey 2003-2006 for Children, GerES IV
German Environmental Survey 1997-1999, GerES III
German Environmental Survey 1990-1992, GerES II
German Environmental Survey 1985-1986, GerES I
back
German Environmental Survey 1997-1999, GerES III
Survey 1990-1992 in Comparison with Survey 1997-1999
back
Commissions and Working Groups
Human Biomonitoring Commission
Indoor Air Hygiene Commission
German Committee on Indoor Guide Values
Committee for Health-related Evaluation of Building Products
Environmental Medicine Commission
back
Human Biomonitoring Commission
Reference and HBM Values
Opinion of the Human Biomonitoring Commission (HBM)
Members
back
Indoor Air Hygiene Commission
Members of the Indoor Air Hygiene Commission
back
Environment and Health: newsletters and series
UMID: Environment and Human Health – Information Service
Newsletter WHO CC Air Hygiene
WHO CC Air Hygiene Report
Telegram: environment + health
back
UMID: Environment and Human Health – Information Service
UMID: Notes for authors
back
Chemicals
Information about chemicals in consumer products
Pharmaceuticals
Biocides
Classification and labelling of chemicals
Cleaning agents and laundry detergents
Environmental Specimen Bank network
International Chemicals management
PARC – Partnership for the Assessment of Risks from Chemicals
Plant protection products
Water Monitoring of the Future
REACH – What is it?
Chemical research at UBA
Substances hazardous to waters
Dioxins
Nanotechnology
back
Pharmaceuticals
Pharmaceuticals and the environment
Database - Pharmaceuticals in the environment
back
Biocides
Environmental risk assessment of antifouling products in Germany
Sustainable Control of Harmful Organisms
Workshop: Non-Chemical Alternatives for Rodent Control (NoCheRo)
back
Sustainable Control of Harmful Organisms
Projects
SuMaHO-principles for Management of Harmful Organisms
International information offers
Non-biocidal substitution options for curative wood preservatives
Non-biocidal alternatives as substitution options for rodenticide
Non-biocidal alternatives as substituts for insecticides
Non-biocidal substitution for biocidal antifouling coatings
back
Classification and labelling of chemicals
CLP Regulation
back
International Chemicals management
Sustainability evaluation of case studies
Chemical Leasing
SAICM
Stockholm Convention
Sustainable Chemistry Conference 2015
Sustainable Chemistry
back
Sustainable Chemistry
ChemSelect – assessing the sustainability of chemicals
back
REACH – What is it?
Advancing REACH
AskREACH
Non-extractable residues in persistence assessment
PMT and vPvM substances under REACH
REACH for Consumers
back
Advancing REACH
Assessing and regulating of chemical mixtures under REACH
back
AskREACH
AskREACH: Survey for Companies
AskREACH: Survey for Consumers
Meetings „Compliance Digital“
back
Chemical research at UBA
Artificial stream and pond system
Testing Facility of Pests of Public Health Importance
back
Artificial stream and pond system
News
Projects
Publications
Technology
Visiting and directions
back
Projects
Effect study "Irgarol"
Fate-study Irargol
back
Nanotechnology
Research and development projects
Good to know about nanomaterials
Advanced materials
back
Economics | Consumption
Green procurement
GreenTech Atlas 2025
Value factors for the Monetization of Environmental Impacts
Products
Climate-neutral lifestyle: Consumers lead the way
Industrial sectors
Innovative production processes
Plant safety
Electronical reporting data
back
Green procurement
Incorporating green procurement into your organizational practice
Recommendations for your tender
Life cycle costing
Environmental aspects in contract award procedures
Research projects
Bibliography and links
back
Products
Categorizing textile products for setting ecodesign requirements
Toxic substances in products
Building Products
Flame Retardants in Products
back
Toxic substances in products
Legal provisions
Problematic substance properties
back
Building Products
European testing procedure for emissions from construction products
EU law for construction products
Blue Angel for Building Products and Furnishings
NonHazCity 3 Interreg Project
Odours from building products
Environmental product declarations for construction products
back
EU law for construction products
New Concepts for European Construction Product Standards
EU Construction Products Regulation
Format for the mandatory designation of construction products
back
Innovative production processes
Nanotechnology: Opportunities and Risks
back
Plant safety
State of the art in safety technology
Acute Exposure Guideline Levels (AEGL)
Risk management in river basins
Natural Hazards Triggering Technical Accidents (Natech)
Examples of Good Practice In Natech Risk Management
back
Noise
Traffic noise
Noise effects
back
Noise effects
Circulatory diseases
back
Transport
Sustainable mobility
Economic aspects of transport
Transport law
back
Waste | Resources
Economic and legal dimensions of resource conservation
Product stewardship and waste management
Resource conservation and environmental policy
Resource conservation in the manufacturing and consumption domain
Resource use and its consequences
Resources Commission at the Federal Environment Agency (KRU)
Transfrontier shipment of wastes
Waste disposal
Waste management
back
Economic and legal dimensions of resource conservation
Economic impact
Leveraging cost reduction potential through resource efficiency
Rebound effects
Resource conservation law
back
Product stewardship and waste management
Batteries
Electrical and electronic waste
End-of-life-vehicles
Packaging
Plastics
back
Electrical and electronic waste
Electrical and Electronic Equipment Act
back
Resource conservation and environmental policy
International strategies and programmes
back
Resource conservation in the manufacturing and consumption domain
Digitalisation and natural resources
Factor X - Intelligent use of natural resources
Leisure sector and natural resources
Resource use in Germany
back
Transfrontier shipment of wastes
Focal Point to the Basel Convention (Germany)
Information requirements
Legal Basis
Notification procedure
Prosecution of Illegal Waste Shipments
Statistics concerning transfrontier shipment of waste
back
Waste disposal
Landfill
Mechanical-biological treatment
Organic-waste treatment
Thermal treatment
Waste collection and transport
back
Waste management
Climate protection and waste management
Waste prevention
Waste regulations
Waste statistics
Waste technology transfer
Waste types
back
Waste prevention
Food waste in the catering sector
back
Waste types
Commercial municipal waste
Hazardous waste
Waste classes
back
Hazardous waste
Waste containing asbestos
Waste oil
Wastes containing POPs and PCB
back
Air
Air pollutants at a glance
Reactive nitrogen
Air Quality Control in Europe
back
Air pollutants at a glance
Benzene
Benzo(a)pyrene in particulate matter
Heavy Metals in Particulate Matter (PM10)
Particulate matter (PM10)
Carbon monoxide
Ozone
Sulphur dioxide
Nitrogen dioxide
back
Heavy Metals in Particulate Matter (PM10)
Arsenic in particulate matter
Cadmium in particulate matter
Lead in particulate matter
Nickel in particulate matter
back
Particulate matter (PM10)
Low-emission zones in Germany
back
Air Quality Control in Europe
AUSTAL / BESTAL - Overview
AUSTAL / BESTAL - Download
AUSTAL / BESTAL - FAQ
AUSTAL / BESTAL - Known and resolved problems
Deprecated files & changes
back
Water
Rivers
Water Resource Management
Drinking water
Seas
Economic issues
Digitalization water management
Antarctic
Extreme Events / Climate Change
back
Rivers
The Oder River under stress
Assessment of watercourses
Metals
Nutrients in watercourses
Chemicals
Persistent Organic Pollutants (POPs)
Active Pharmaceutical Ingredients (API)
Pesticides
Pollutant emissions into surface waters
River Restoration
back
Assessment of watercourses
Chemical
Water body structure
back
Water Resource Management
Water Reuse
National Water Strategy
back
Water Reuse
New EU Regulation on Minimum Requirements for Water Reuse
Questions and Answers on Water Reuse
Research Project PU2R
back
Drinking water
Distributing drinking water
Safe management of drinking water supplies
Protocol on Water and Health
Small-scale drinking water supplies
WHO Collaborating Centre for Research on Drinking-water Hygiene
back
Distributing drinking water
Approval and Harmonization – 4MS-Initiative
Evaluation Criteria and Guidelines
back
Safe management of drinking water supplies
Joint research project on the reuse of filter backwash water
back
Seas
Maritime shipping
Marine governance
Deep-sea mining
Seas under pressure - Ocean acidification due to CO₂
Use and Impact
Monitoring and assessment
Enforcement in the maritime domain
back
Deep-sea mining
Risks for the environment
Framework under international law: Part XI of the Convention
ISA: Organs, decision-making processes and operating principles
Benefit Sharing
The Mining Code of the ISA
Regional Environmental Management Plans
back
Antarctic
The German Environment Agency and the Antarctic
Antarctica
Human presence in the Antarctic
Travellers to the Antarctic
Applying for a permit to travel to the Antarctic
Antarctic Treaty System
Chemical contamination in the Antarctic
International activities in and around the Antarctic
back
The German Environment Agency and the Antarctic
Underwater noise
Non-native species
Inspections in the Antarctic
Monitoring projects in the Antarctic
back
Underwater noise
Airguns - an underestimated disruptive factor
back
Monitoring projects in the Antarctic
Whale monitoring in the Antarctic
Environmental monitoring on King George Island
Satellite-based penguin monitoring
back
Antarctica
The geography of the Antarctic
Geology of the Antarctic
Climate of the Antarctic
Flora of the Antarctic
Fauna of the Antarctic
back
Human presence in the Antarctic
Discovery, exploration and conservation of Antarctica
Research and logistics in the perpetual ice
Tourists in Antarctica
back
Travellers to the Antarctic
Travelling by cruise ship to Antarctica
Visitor Guidelines for the Antarctic
Yachting in Antarctica
Antarctica from a bird’s eye view
Individual tourism in Antarctica
Media professionals in Antarctica
back
Applying for a permit to travel to the Antarctic
Permitting procedure in Germany
Overview of application forms
back
Antarctic Treaty System
Antarctic Treaty
Conservation of Antarctic Marine Living Resources
Protocol on Environmental Protection to the Antarctic Treaty
Act Implementing the Protocol on Environmental Protection (AIEP)
Convention for the Conservation of Antarctic Seals
back
Chemical contamination in the Antarctic
Developing a concept for a Polar Environmental Monitoring Program
back
International activities in and around the Antarctic
Antarctic Treaty Consultative Meeting (ATCM)
Committee for Environmental Protection (CEP)
Parties' reporting obligations
Protected Areas under the CAMLR-Convention
Protected Areas in Antarctica
International research in Antarctica
International Association of Antarctica Tour Operators
back
Protected Areas in Antarctica
Protection and management of areas under PEPAT
back
Extreme Events / Climate Change
Floods
Stabilizing our Landscape Water Balance
back
Floods
Flood Risk Management
Flood prevention
Flood warning
back
Agriculture
Ecological impact of farming
Toward ecofriendly farming
back
Ecological impact of farming
Ammonia, dust and odour emissions
Compost and sewage sludge
Fertilizer
Nitrogen
Nitrous oxide and methane
Pesticides
Pharmaceuticals
Threats to biodiversity
Tilling
back
Toward ecofriendly farming
Kommission Landwirtschaft (Agricultural Expert Panel, KLU)
Organic farming
The Common Agricultural Policy (CAP)
back
Soil | Land
Learning about and experiencing soil
Pressures on soil
Contaminated sites
Soil protection
Soil science
Soil protection at international level
Commissions and advisory boards
back
Learning about and experiencing soil
Soil related travel destinations in Germany
back
Pressures on soil
Soil pollutants
Paving and construction
Soil loss – any soil crumb counts
Soil compaction
Soil biodiversity loss
back
Soil loss – any soil crumb counts
Soil loss by water erosion
Soil loss by wind erosion
back
Contaminated sites
Site remediation
Remediation technology
Activities at the federal level
FAQs
back
Activities at the federal level
Research and funding
Large scale ecological projects
Networks, joint regional-state-federal groups, associations
Military and armament contaminated sites
back
Large scale ecological projects
Large scale projects under the administrative agreement
back
Soil protection
Precautionary soil protection
Soil protection law
back
Soil science
Soil development
Soil functions
Soil of the Year
back
Soil protection at international level
International soil governance
back
Commissions and advisory boards
Soil investigation advisory council (FBU)
back
Sustainability | Strategies | International
Corona crisis & environmental and sustainability policy
SDGs: A challenge for sustainability policy
Consequences of Ukraine Crisis for Sustainability & Environment
Environmental awareness in Germany
Environmental law
Information as an instrument
International cooperation
Recognition of environmental and nature protection associations
Structural policy
Spatial and Settlement Development
International policy and knowledge transfer
The UBA research agenda “Urban environmental protection”
back
SDGs: A challenge for sustainability policy
Assessments of SDG Interactions in Transformation Pathways
Betrachtung von SDG-Wechselwirkungen in Transformationspfaden
back
Environmental awareness in Germany
Shaping environmental policy in a socially responsible way
back
Environmental law
Environmental administrative offences and environmental crime
International environmental law
Access to environmental information
Lawful Rights of Participation
Access to Justice
Laws of environmental liability, harm and criminal actions
Immission control law
Environmental protection in specific law
Better Environmental Regulation
Environmental Compliance Assurance
back
International environmental law
Geoengineering-Governance
back
Environmental protection in specific law
Agricultural law
Mining law
Public building law
Spatial planning law
back
International cooperation
Sino-German Track-II-Dialogue
Alpine Convention
Environmental protection and peacekeeping
back
Recognition of environmental and nature protection associations
Legal background to the Environmental Appeals Act
Preconditions for Recognition
Helpful hints on gaining recognition
back
Spatial and Settlement Development
Sustainable lifestyles: NiCE - From niche to centre
back
International policy and knowledge transfer
Federal Environment Ministry's Advisory Assistance Programme
Project Database: Advisory Assistance Programme
UNEP / UNESCO / BMU Training Programme
The twinning tool
back
Digitalisation
European Earth Observation Programme Copernicus
Green IT
Digital Sustainability
UBA application lab for AI and Big Data
back
Green IT
Digital services / Cloud computing
back
Digital Sustainability
Serious Gaming and Sustainability
Coalition for Digital Environmental Sustainability (CODES)
back
Publications
Cart
back
The UBA
About us
Fachbibliothek Umwelt (Environmental Library)
UBA offices
Corona Sustainability Compass
TES Academy
back
About us
Organizational structure of the UBA
Mission Statement
Environmental management at UBA
back
Organizational structure of the UBA
President
Vice-President
Central Office Division Z
Division I
Division II
Division III
Division IV
Division V
back
Mission Statement
Environmental guidelines
back
Fachbibliothek Umwelt (Environmental Library)
Erhard Collection: „Waste – A look back”
back
UBA offices
Visit us
back
Visit us
How to reach UBA
Guided tours
Visits by professionals or delegations
Service & Contact
Press
Newsletter
High contrast
Topics
Topics
Climate | Energy
Climate | Energy
Climate change
European Methane Regulation
Climate Impacts and Adaptation
Climate protection and energy policy in Germany
Accelerating global climate action by 2030
Fluorinated Greenhouse Gases and Fully Halogenated CFCs
Renewable energies
Ten country reports on ambitious climate policy
Ambitious greenhouse gas mitigation in agriculture
Nationally Determined Contributions (NDC)
The Global Stocktake under the Paris Agreement
The 1.5°C goal of the Paris Agreement
Geoengineering
Health
Health
Environmental medicine
Environmental impact on people
Assessing environmentally-related health risks
Commissions and Working Groups
Environment and Health: newsletters and series
WHO Collaborating Centre for Air Quality Management
Chemicals
Chemicals
Information about chemicals in consumer products
Pharmaceuticals
Biocides
Classification and labelling of chemicals
Cleaning agents and laundry detergents
Environmental Specimen Bank network
International Chemicals management
PARC – Partnership for the Assessment of Risks from Chemicals
Plant protection products
Water Monitoring of the Future
REACH – What is it?
Chemical research at UBA
Substances hazardous to waters
Dioxins
Nanotechnology
Economics | Consumption
Economics | Consumption
Green procurement
GreenTech Atlas 2025
Value factors for the Monetization of Environmental Impacts
Products
Climate-neutral lifestyle: Consumers lead the way
Industrial sectors
Innovative production processes
Plant safety
Electronical reporting data
Noise
Noise
Traffic noise
Noise effects
Transport
Transport
Sustainable mobility
Economic aspects of transport
Transport law
Waste | Resources
Waste | Resources
Economic and legal dimensions of resource conservation
Product stewardship and waste management
Resource conservation and environmental policy
Resource conservation in the manufacturing and consumption domain
Resource use and its consequences
Resources Commission at the Federal Environment Agency (KRU)
Transfrontier shipment of wastes
Waste disposal
Waste management
Air
Air
Air pollutants at a glance
Reactive nitrogen
Air Quality Control in Europe
Water
Water
Rivers
Water Resource Management
Drinking water
Seas
Economic issues
Digitalization water management
Antarctic
Extreme Events / Climate Change
Agriculture
Agriculture
Ecological impact of farming
Toward ecofriendly farming
Soil | Land
Soil | Land
Learning about and experiencing soil
Pressures on soil
Contaminated sites
Soil protection
Soil science
Soil protection at international level
Commissions and advisory boards
Sustainability | Strategies | International
Sustainability | Strategies | International
Corona crisis & environmental and sustainability policy
SDGs: A challenge for sustainability policy
Consequences of Ukraine Crisis for Sustainability & Environment
Environmental awareness in Germany
Environmental law
Information as an instrument
International cooperation
Recognition of environmental and nature protection associations
Structural policy
Spatial and Settlement Development
International policy and knowledge transfer
The UBA research agenda “Urban environmental protection”
Digitalisation
Digitalisation
European Earth Observation Programme Copernicus
Green IT
Digital Sustainability
UBA application lab for AI and Big Data
Data
Publications
The UBA
The UBA
About us
Fachbibliothek Umwelt (Environmental Library)
UBA offices
Corona Sustainability Compass
Service & Contact
Press
Newsletter
High contrast
Deutsch
Search
0
Menu
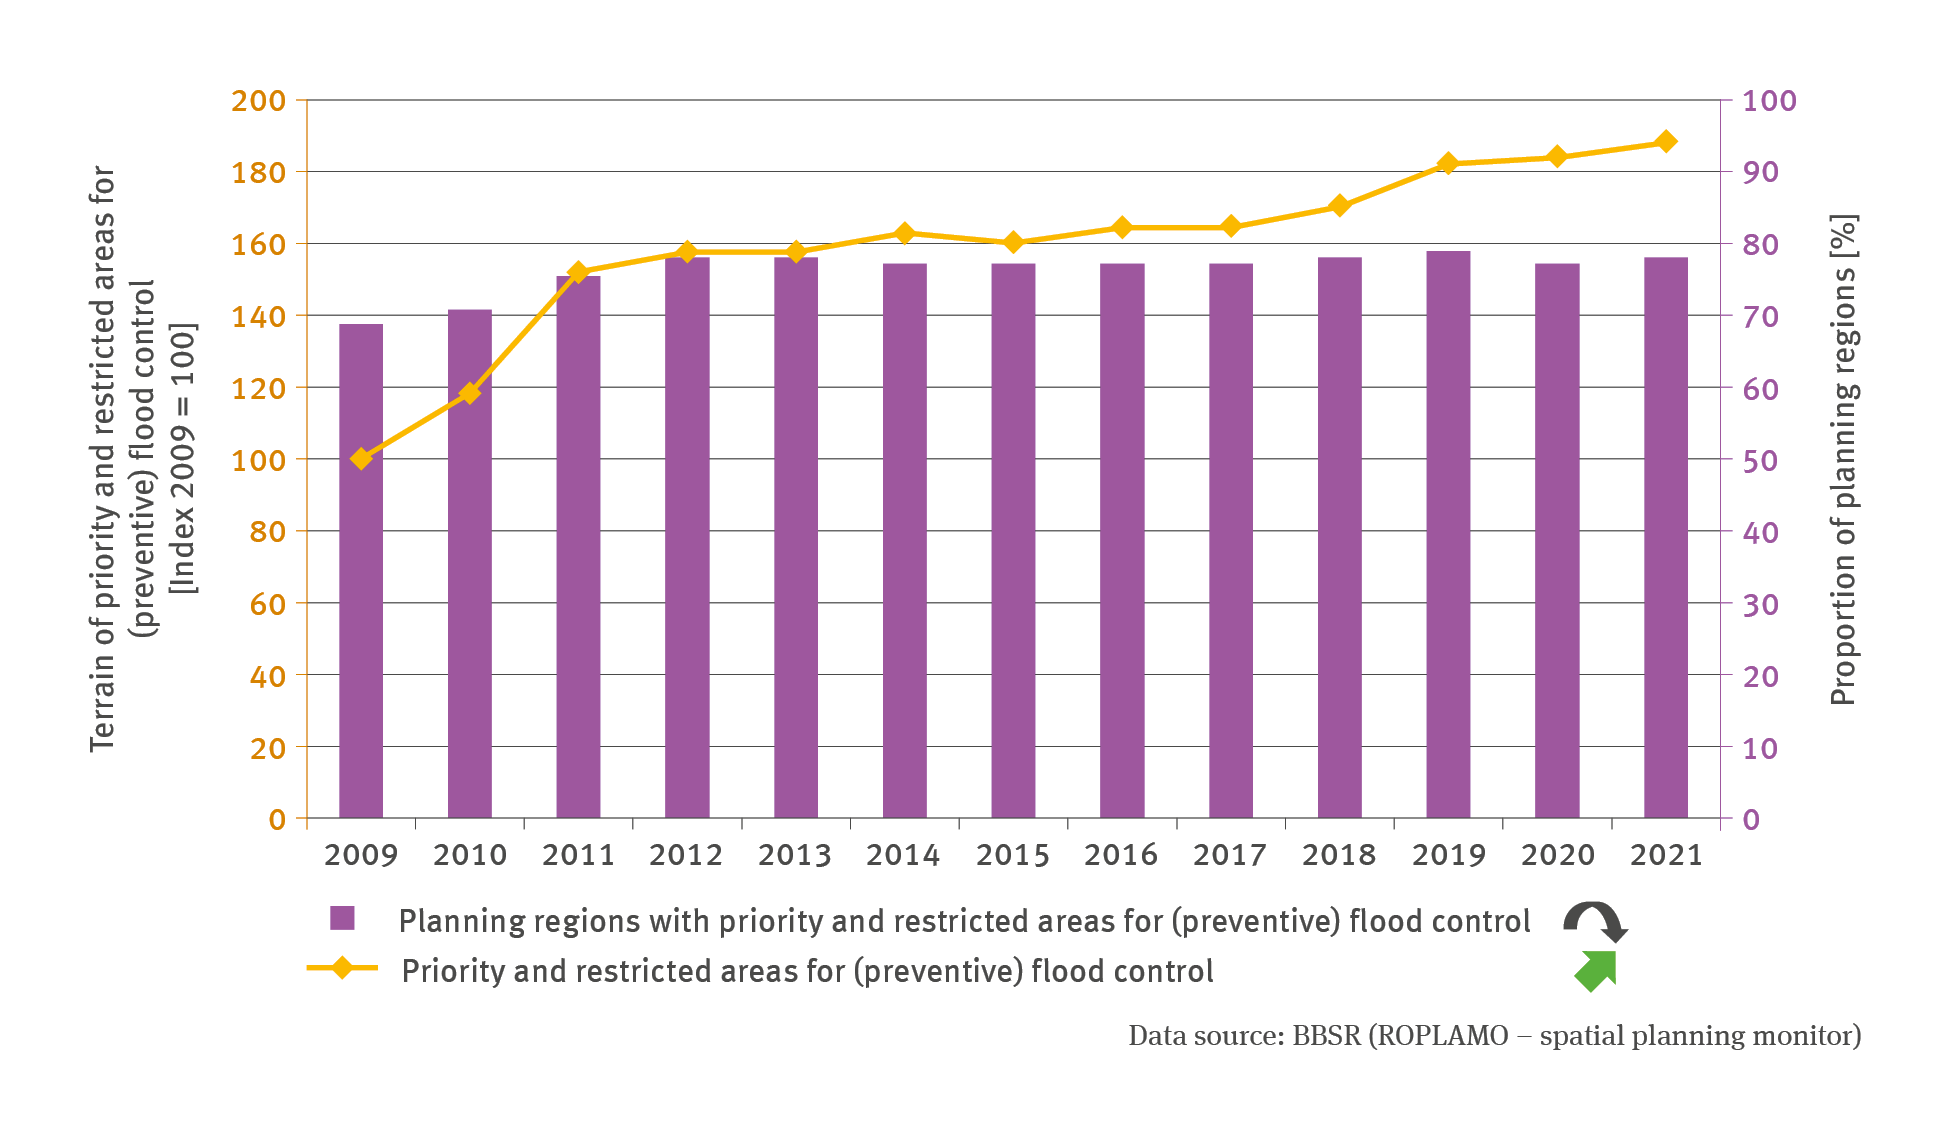
RO-R-3: Priority and restricted areas for (preventive) flood control
Source: BBSR (ROPLAMO - spatial planning monitor)
Download image
(108.52 kB)
The following contents contain this medium:
RO-R-3: Priority and restricted areas for (preventive) flood control
Tags
Competence Centre on Climate Impacts and Adaptation
Short link:
www.uba.de/m42767en
Top