Data Search


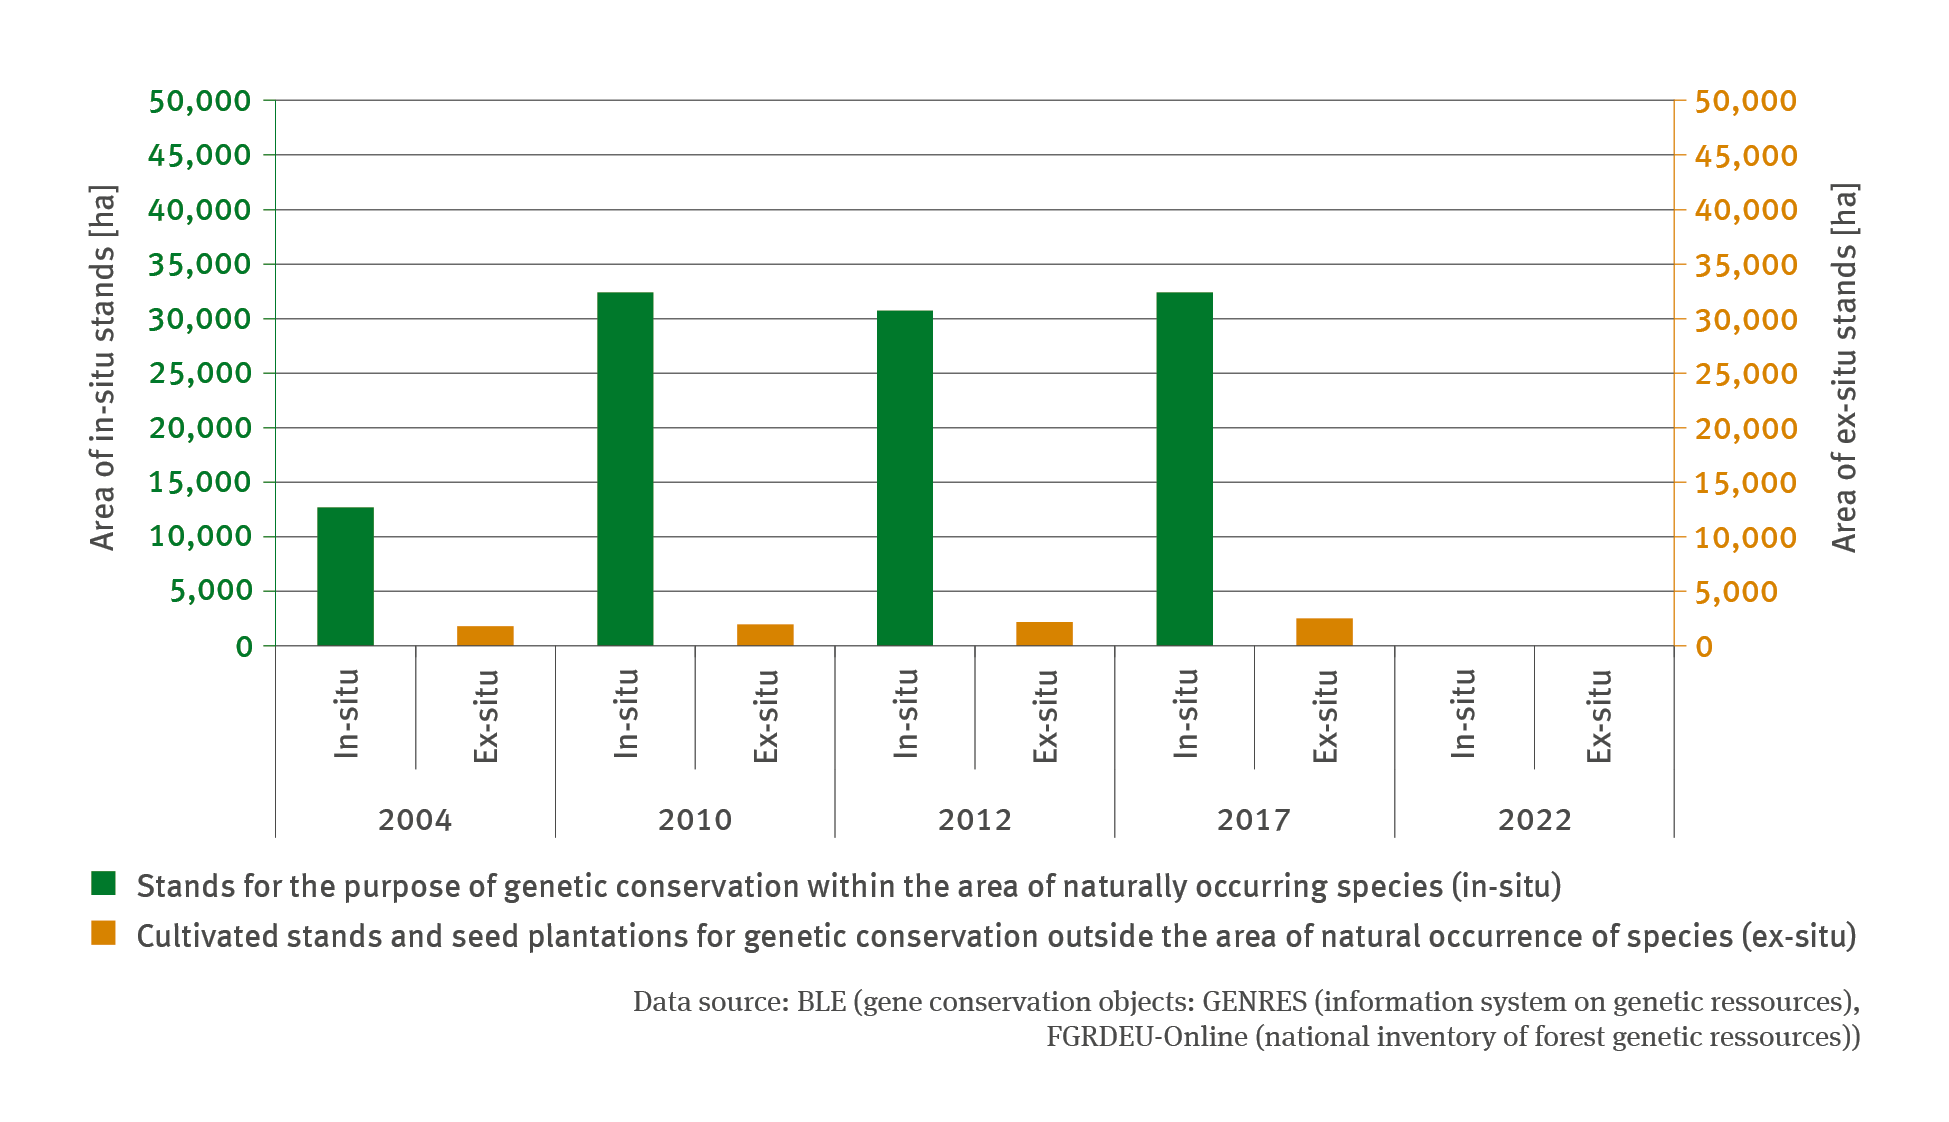
FW-R-2: Conservation of forest-genetic resources
- Klima
- Land- und Forstwirtschaft
- Diagramme
Export data


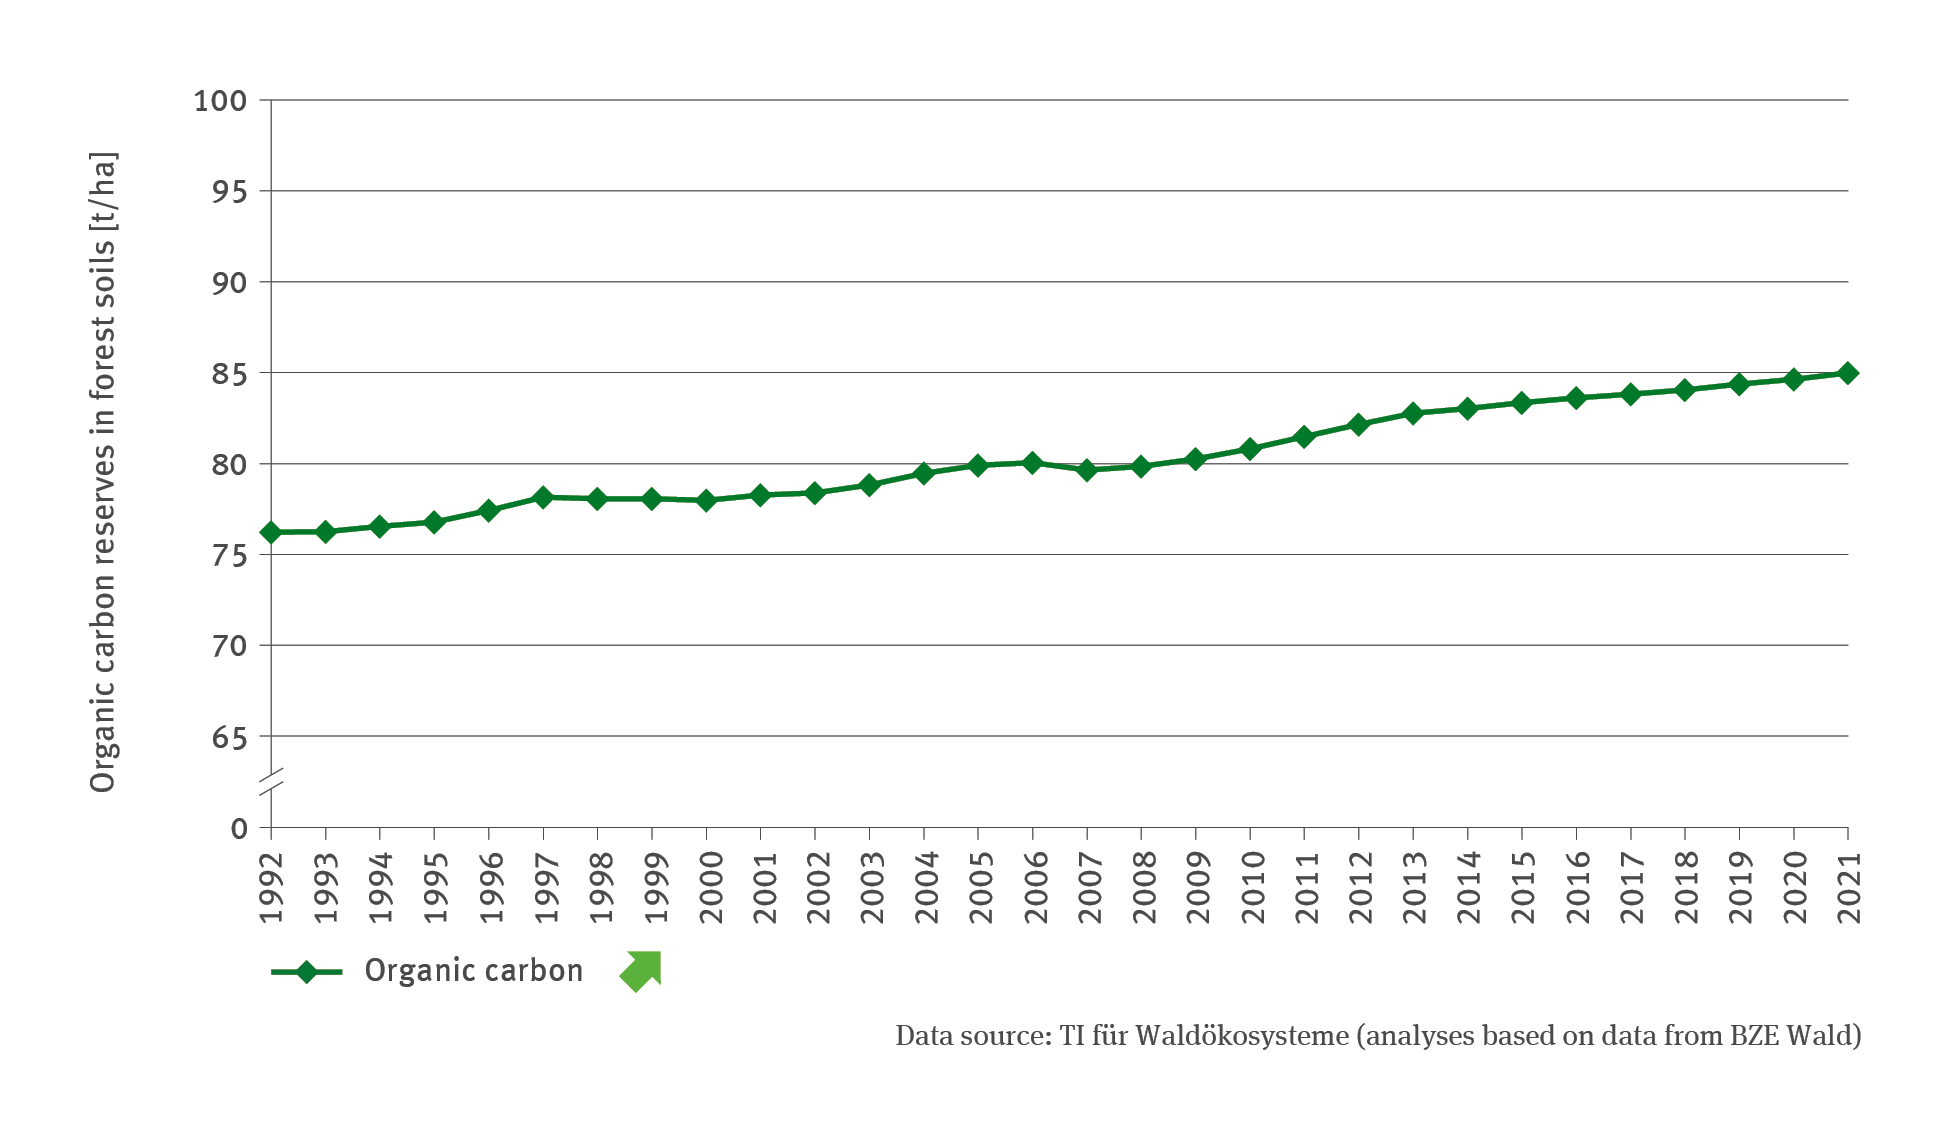
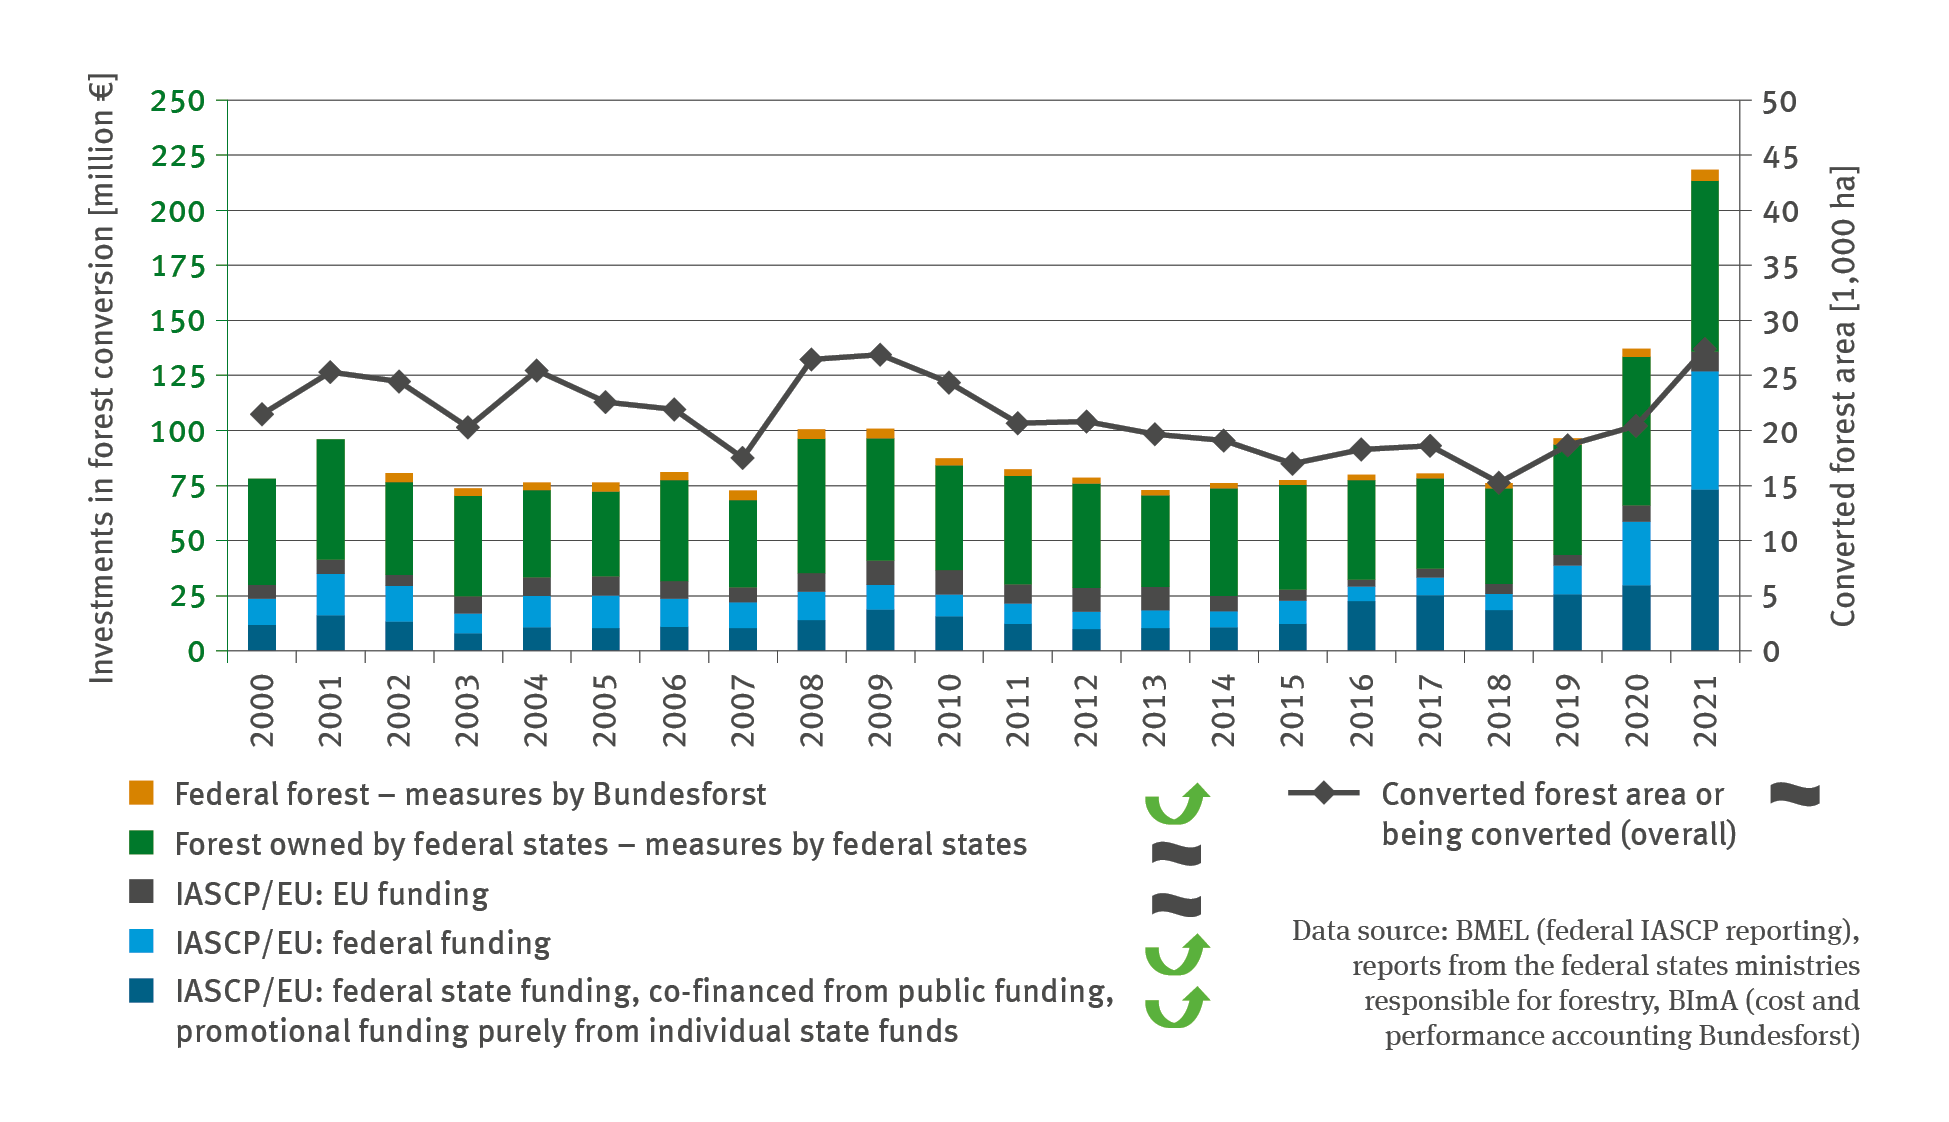
FW-R-1: Financial support for forest transformation
- Klima
- Land- und Forstwirtschaft
- Diagramme
Export data

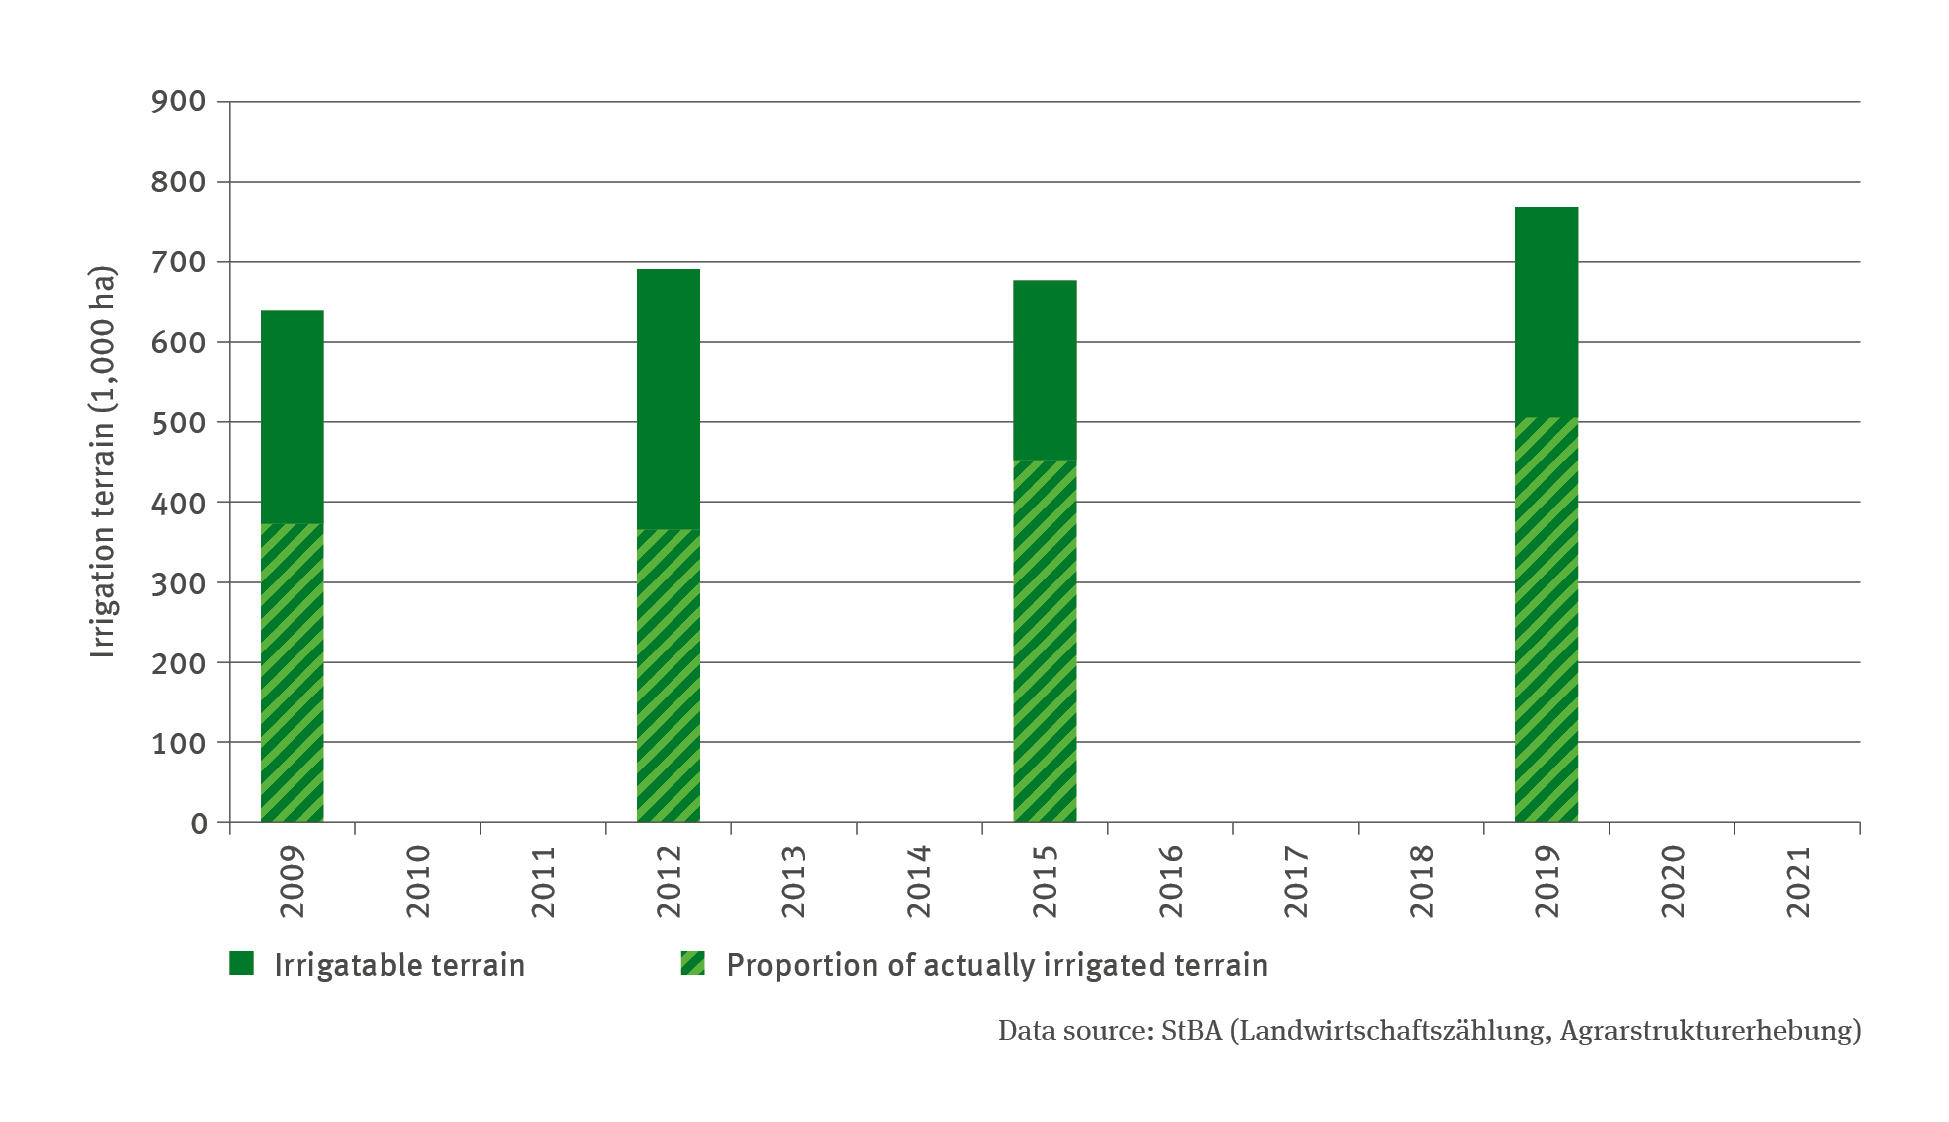
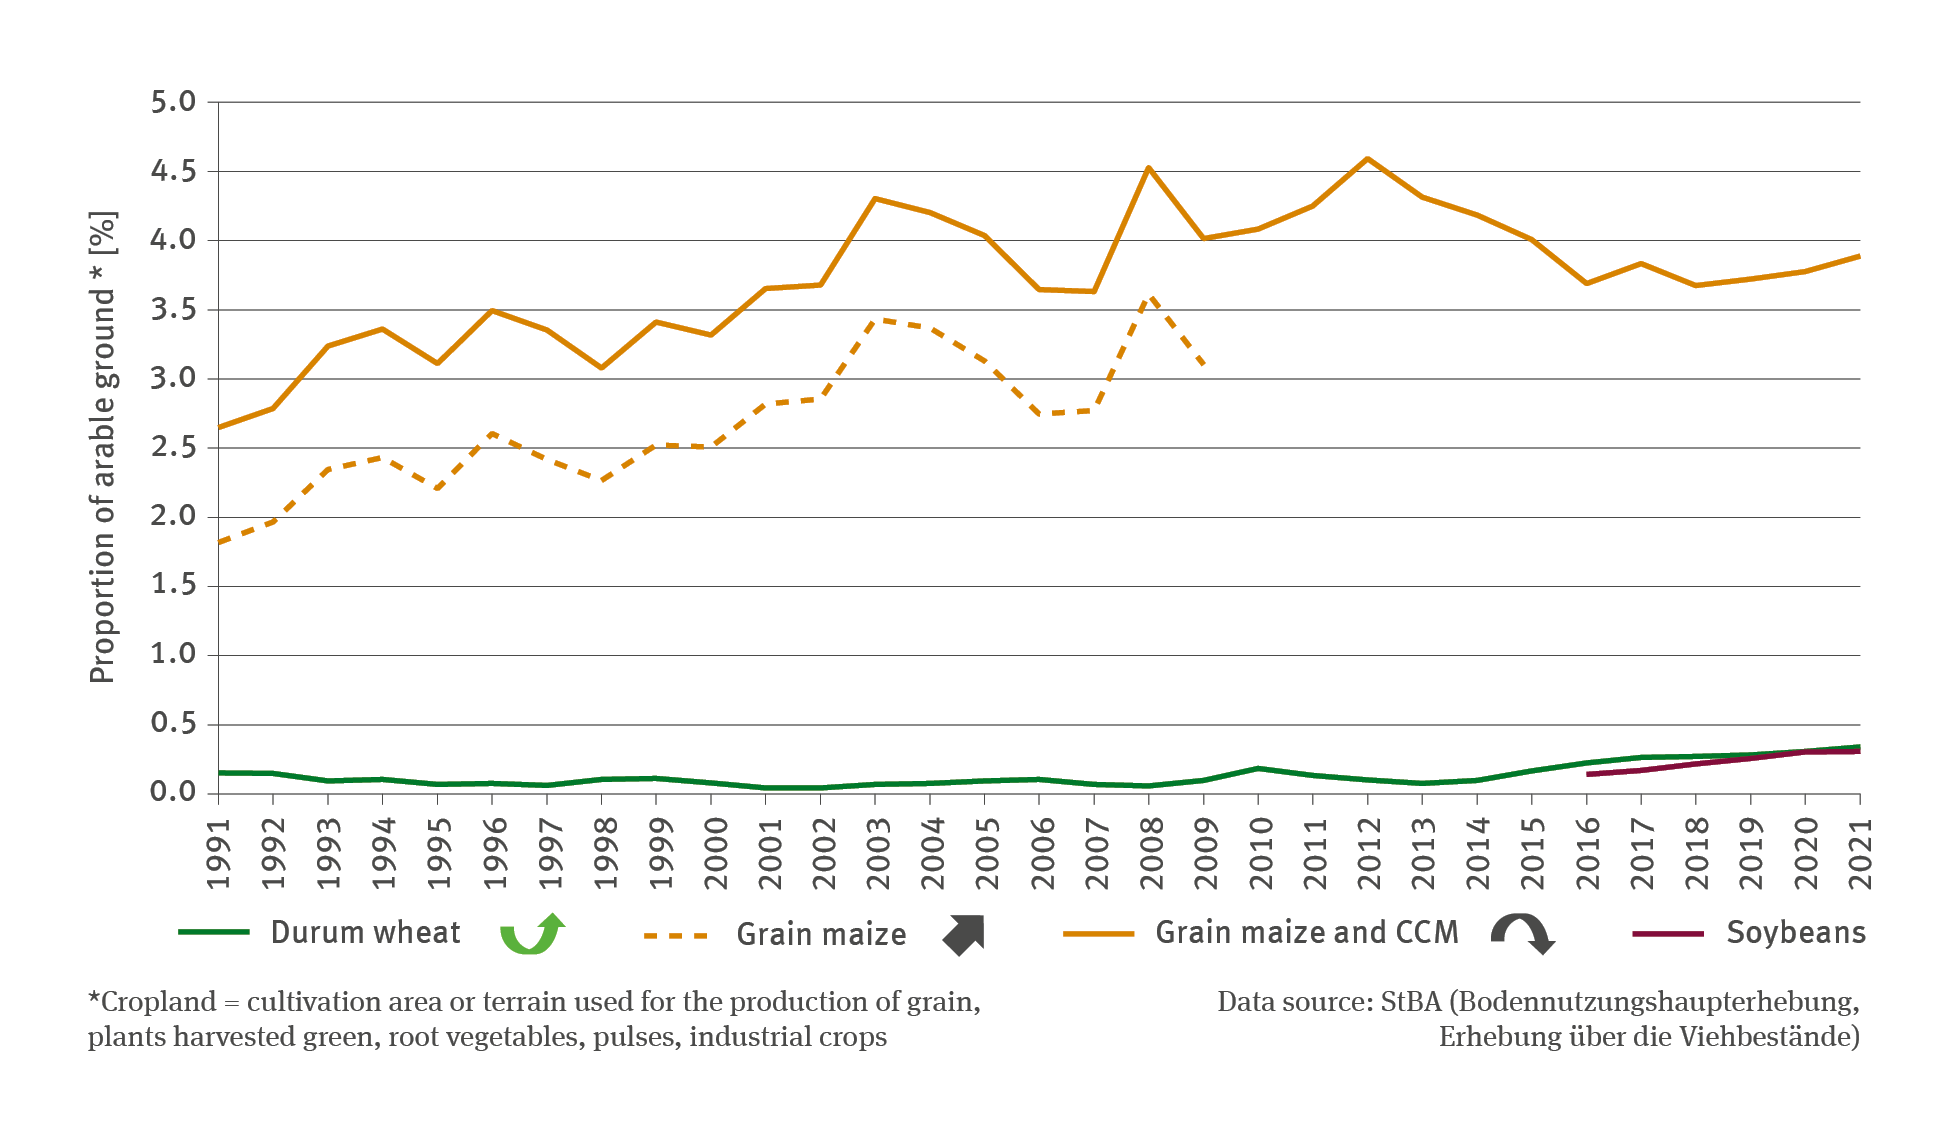
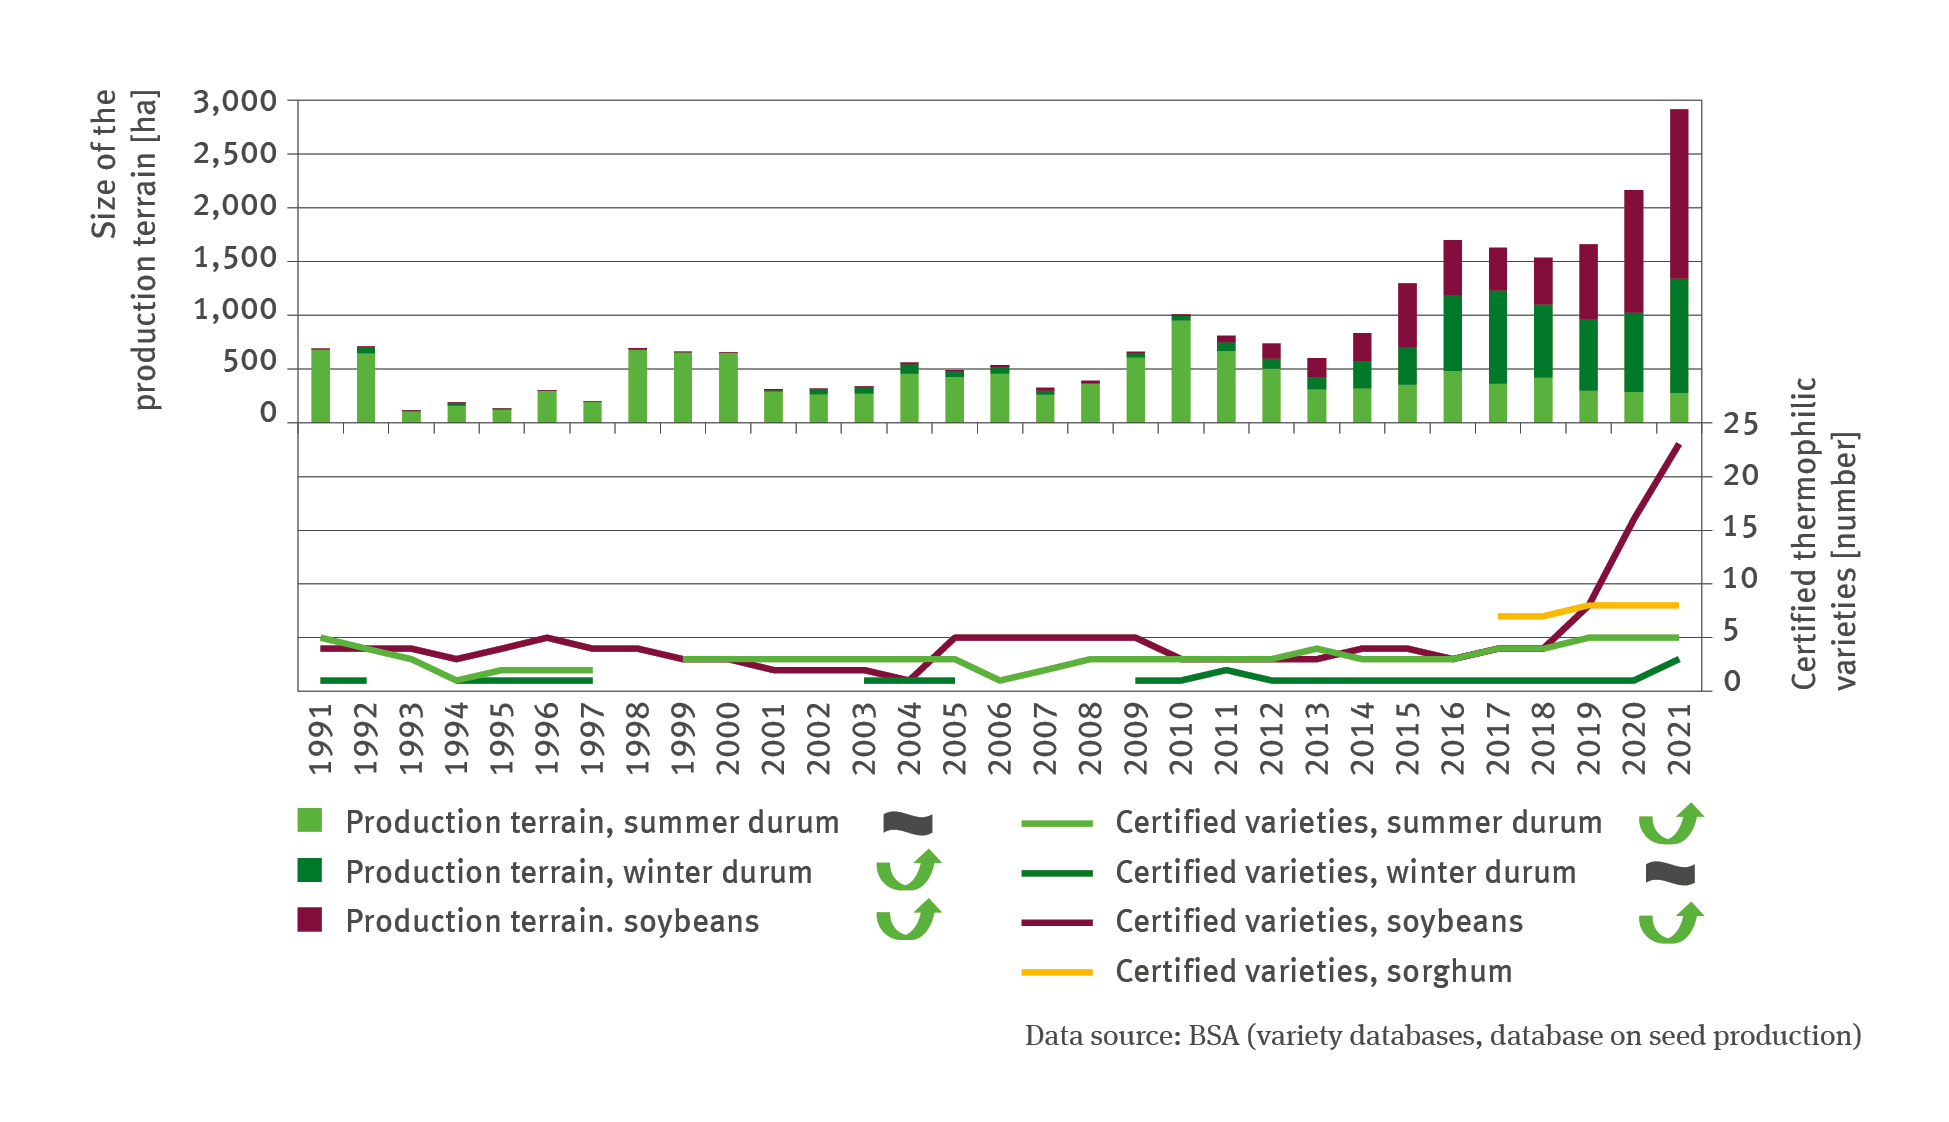
LW-R-2: Cultivation and propagation of thermophilic arable crops
- Klima
- Land- und Forstwirtschaft
- Diagramme
Export data


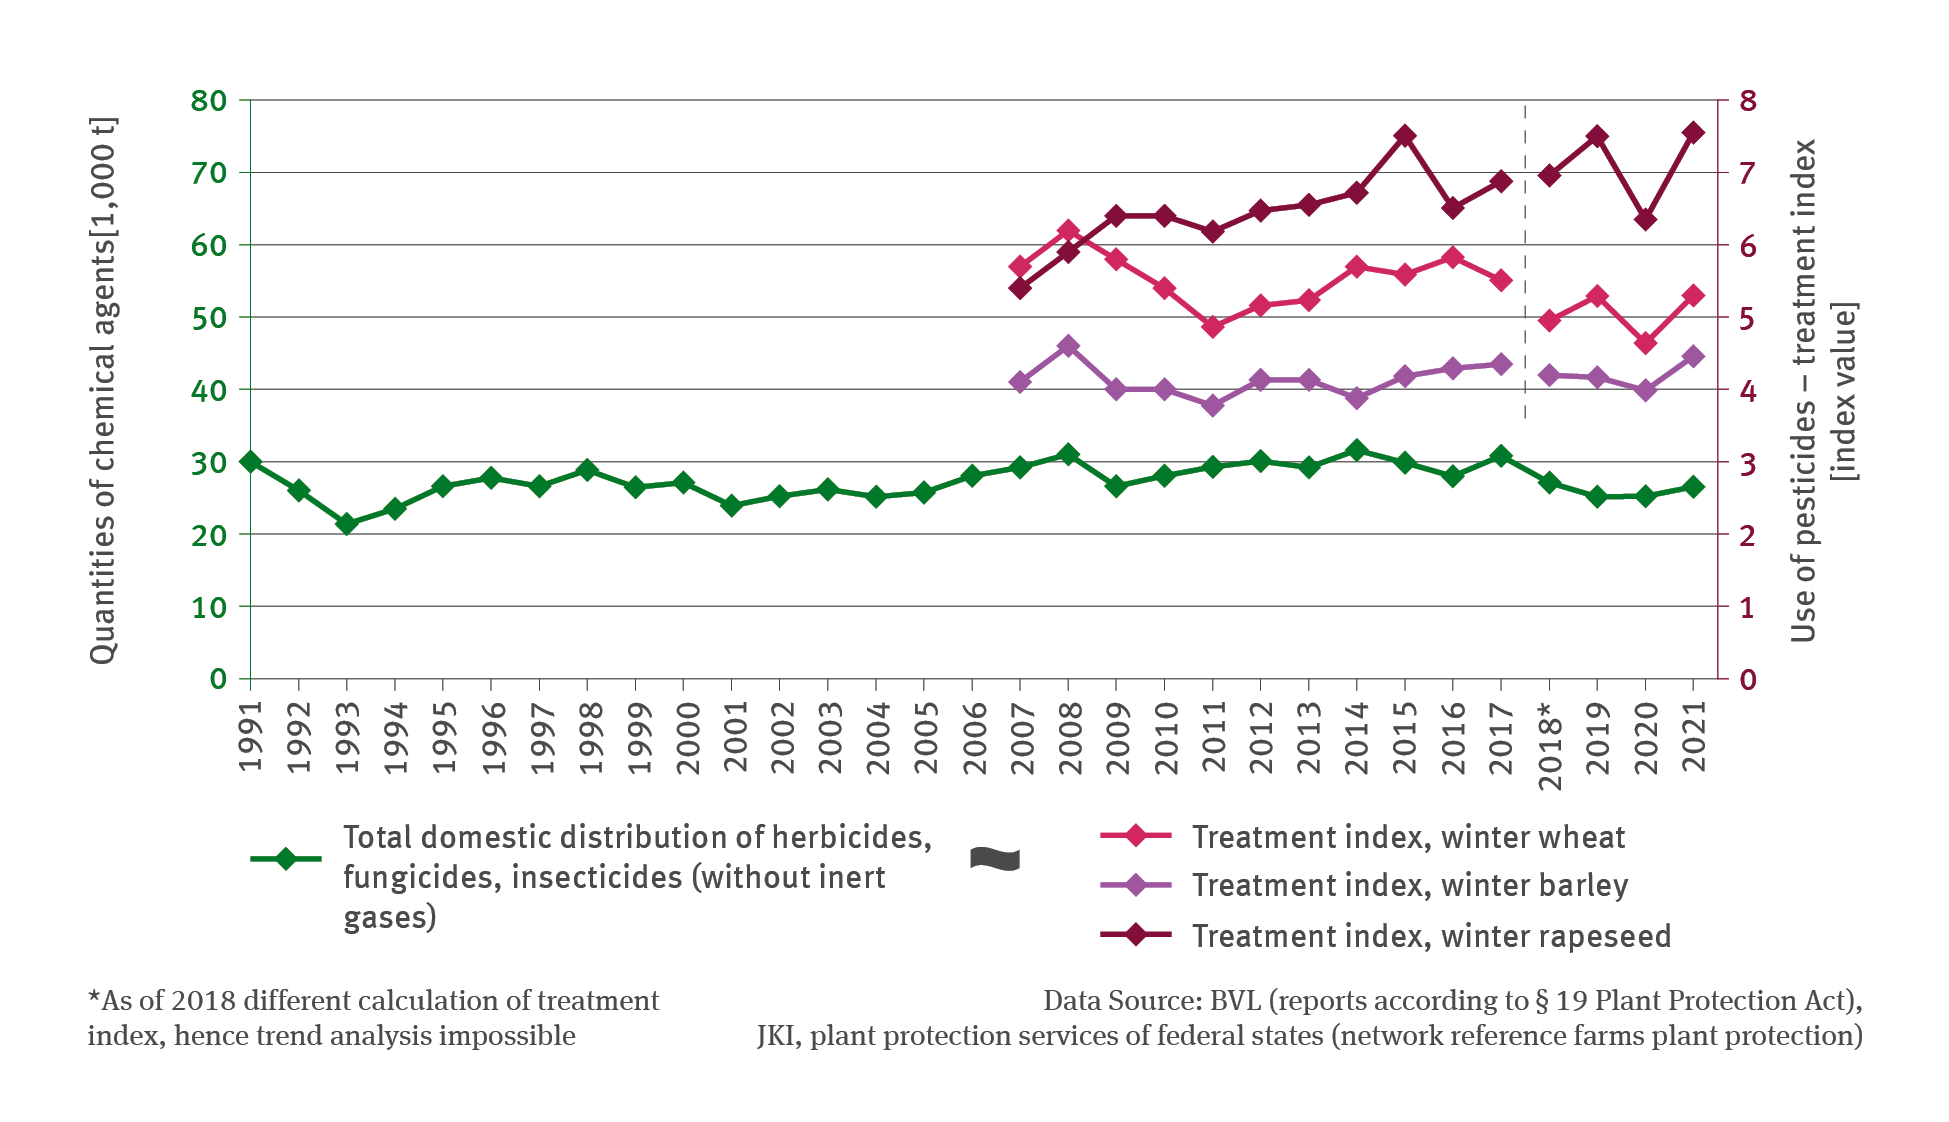
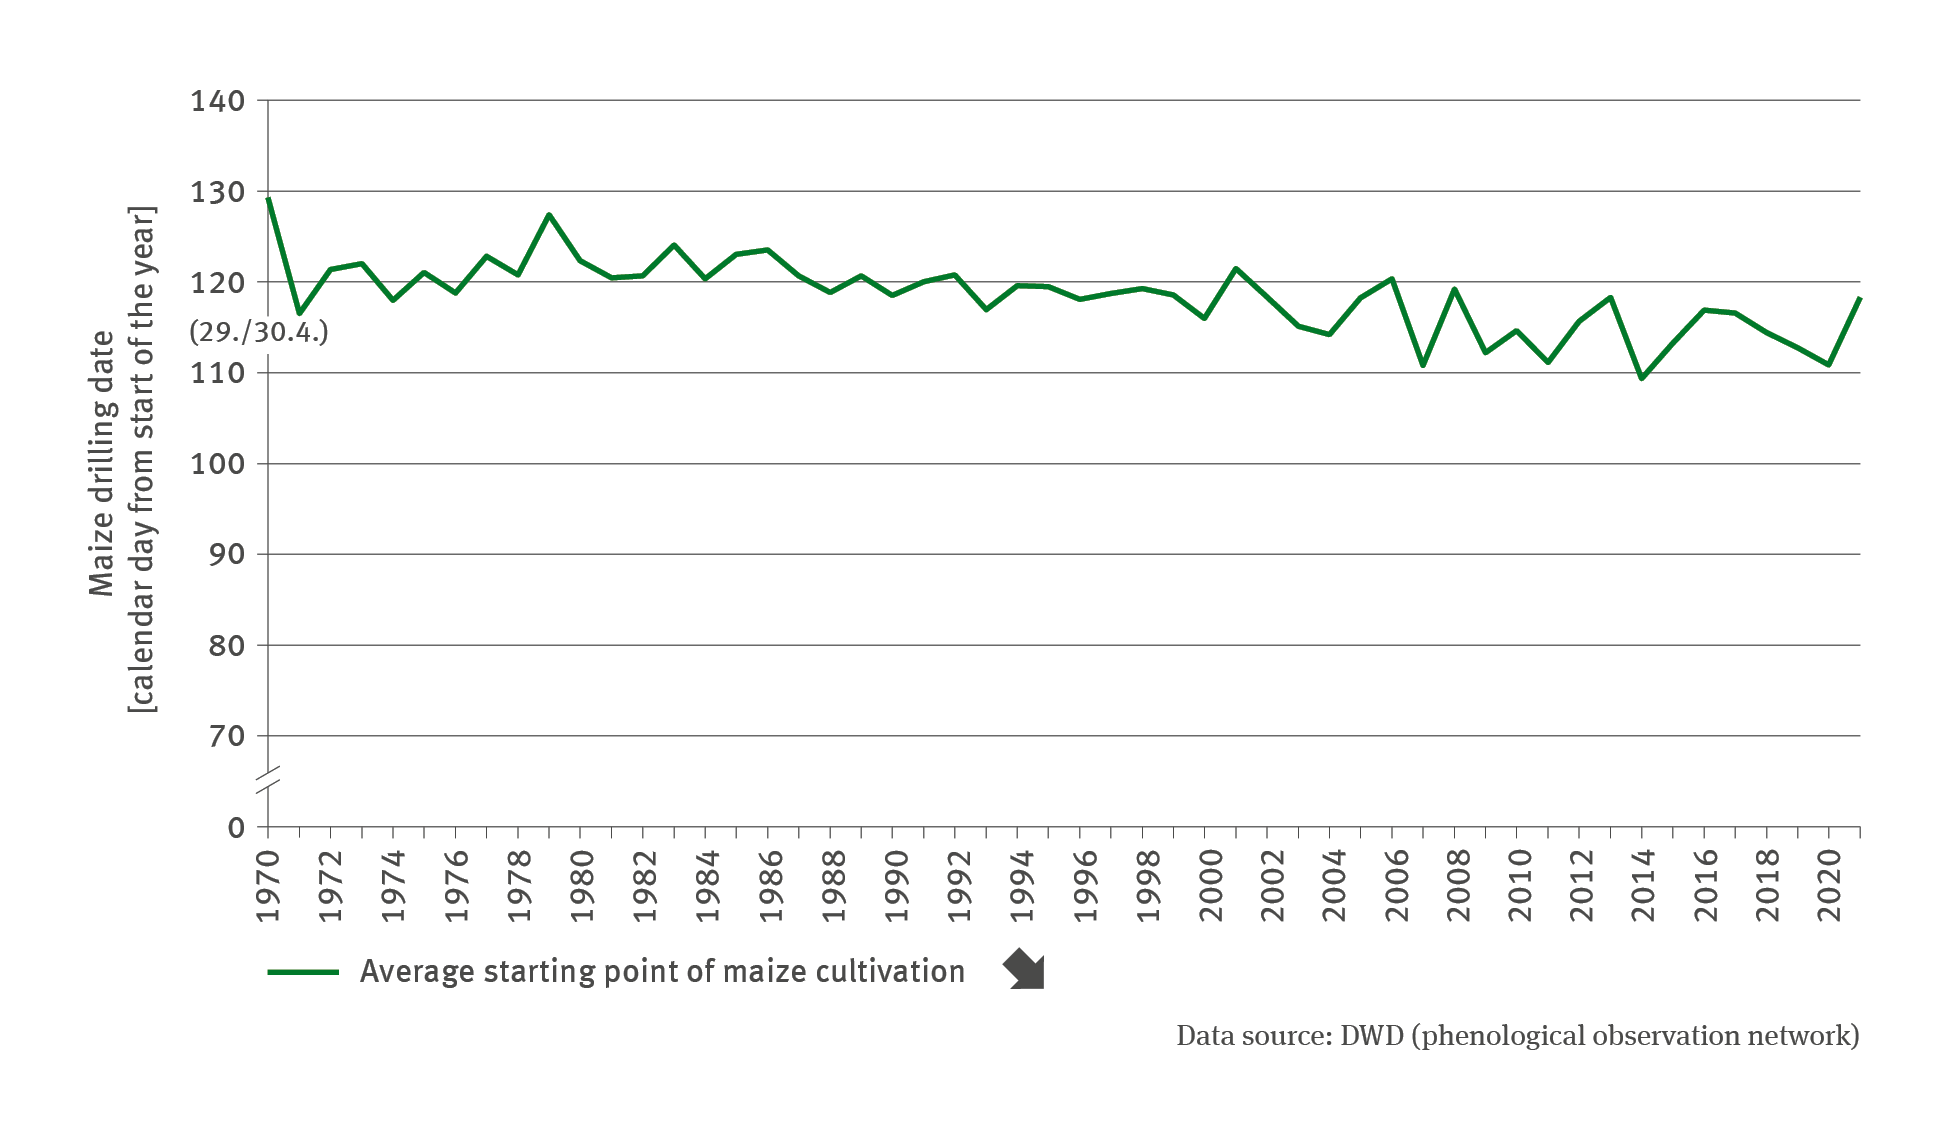
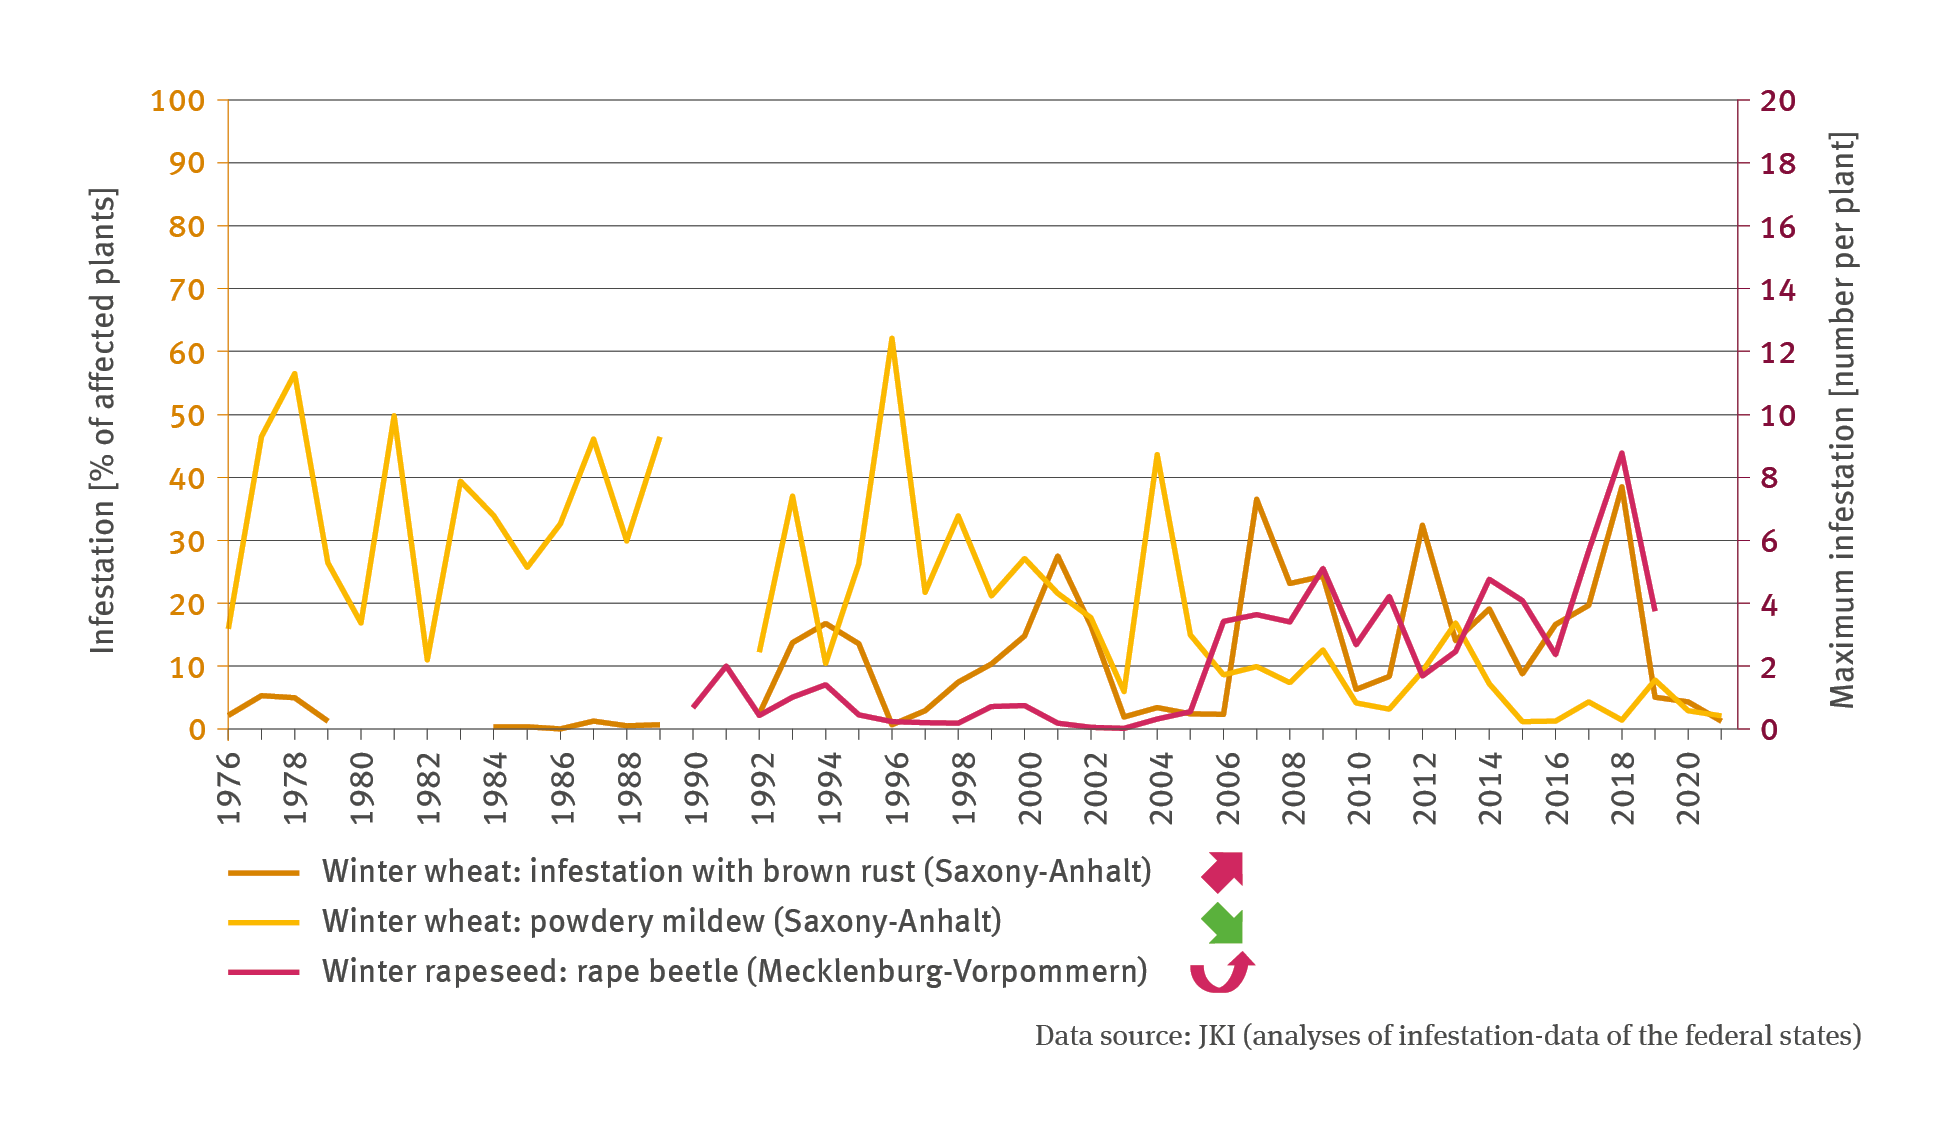
LW-I-4: Infestation with pest organism – case study
- Klima
- Land- und Forstwirtschaft
- Diagramme
Export data