Data Search

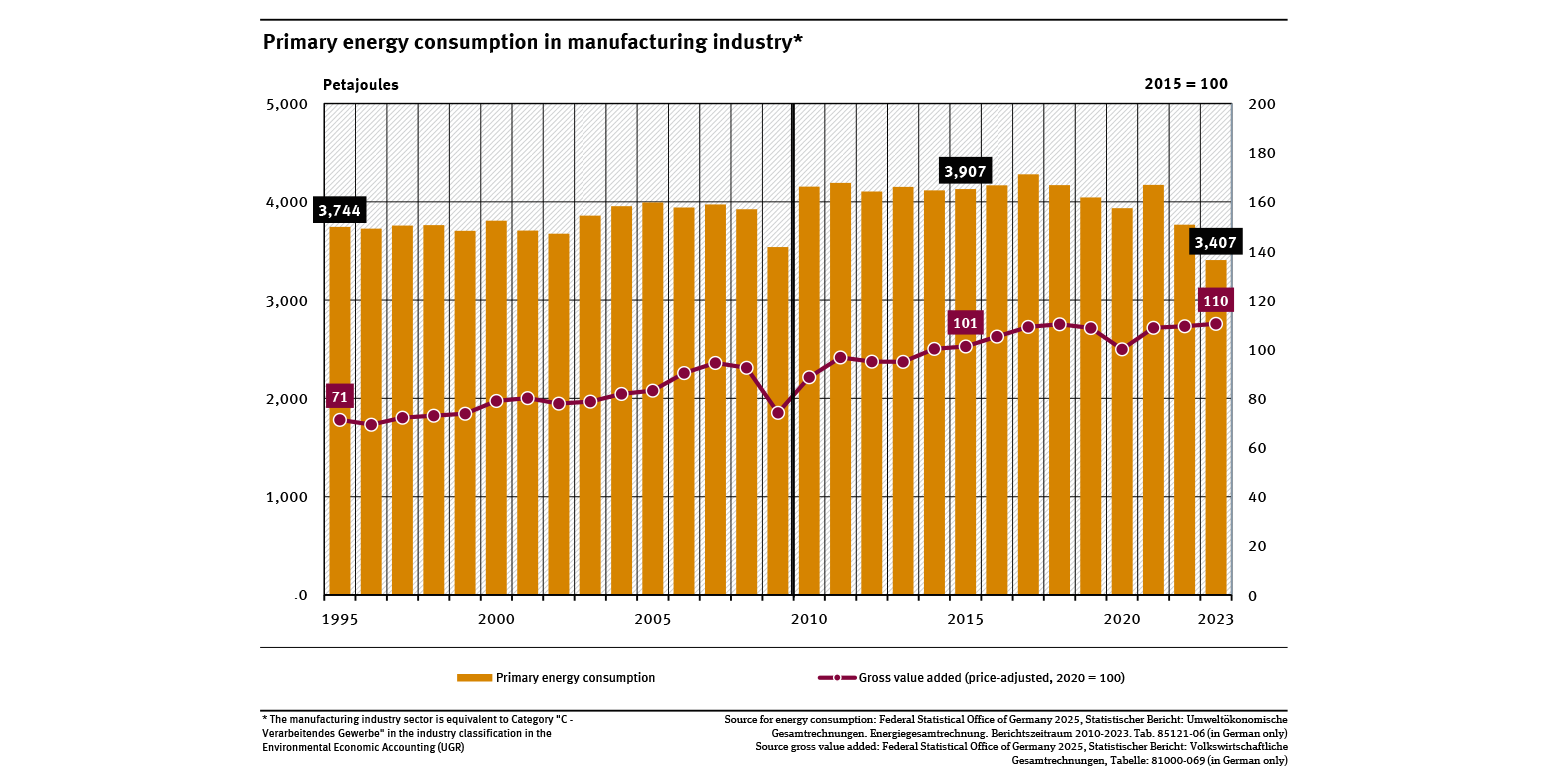
Primary energy consumption in manufacturing industry
- Energie
- Umwelt und Wirtschaft
- Diagramme
- Umwelt-Indikatoren
- Daten und Tabellen

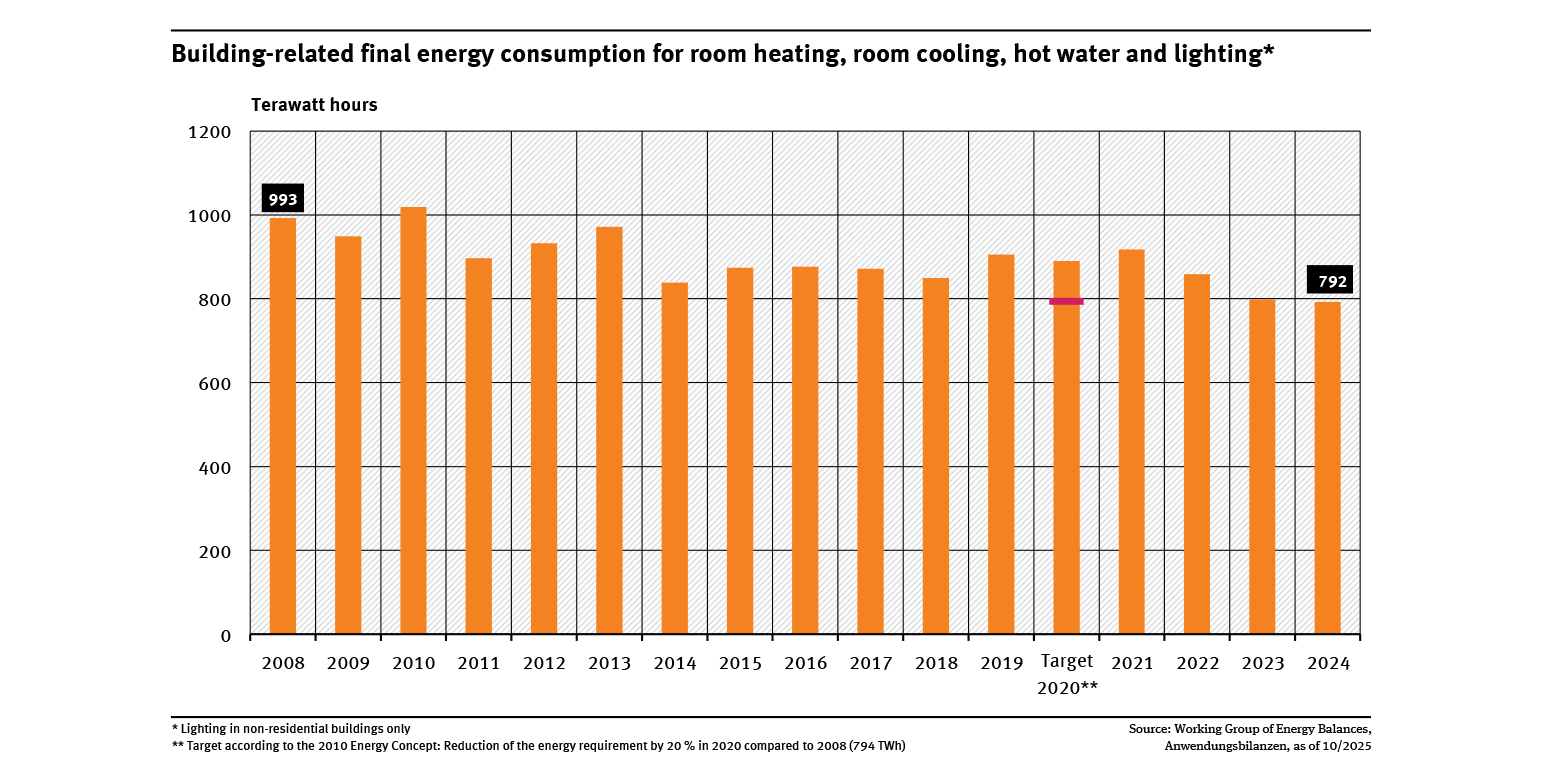
Building-related final energy consumption for room heating, room cooling, hot water and lighting
- Energie
- Diagramme
- Umwelt-Indikatoren
- Daten und Tabellen

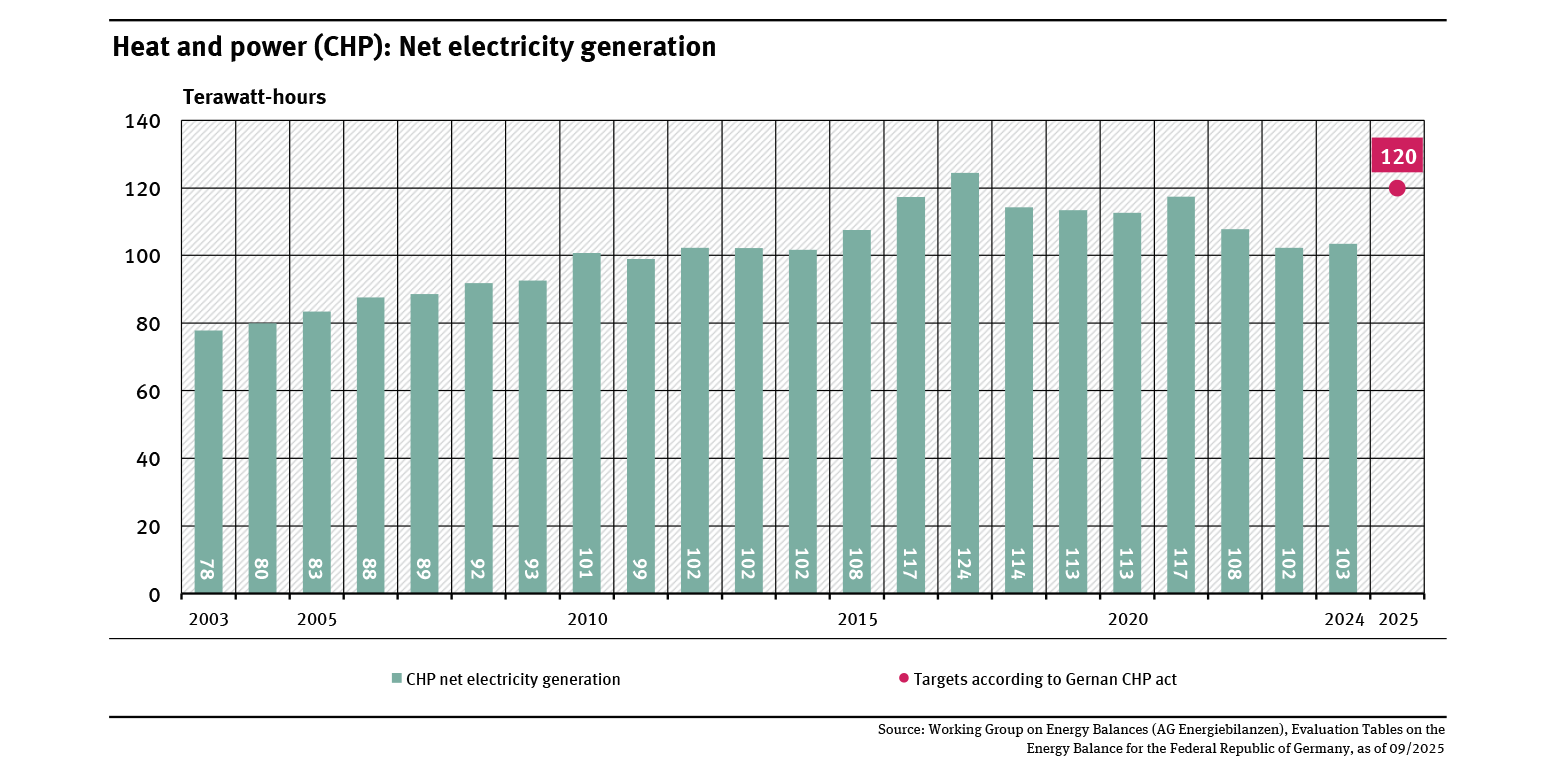
Heat and power (CHP): Net electricity generation
- Energie
- Diagramme
- Umwelt-Indikatoren
- Daten und Tabellen

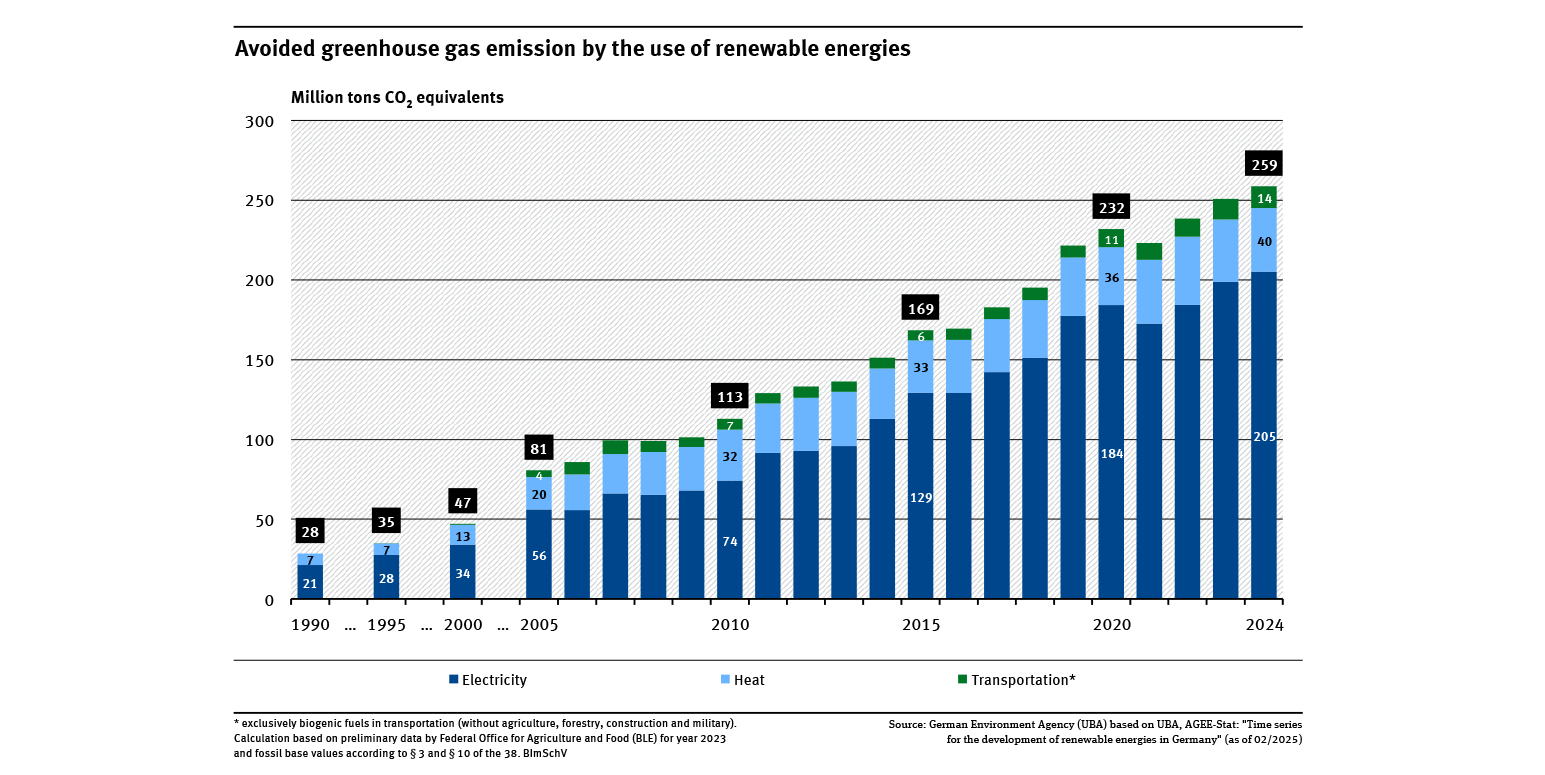
Greenhouse gas emissions avoided through the use of renewable energy sources
- Klima
- Energie
- Diagramme
- Umwelt-Indikatoren
- Daten und Tabellen

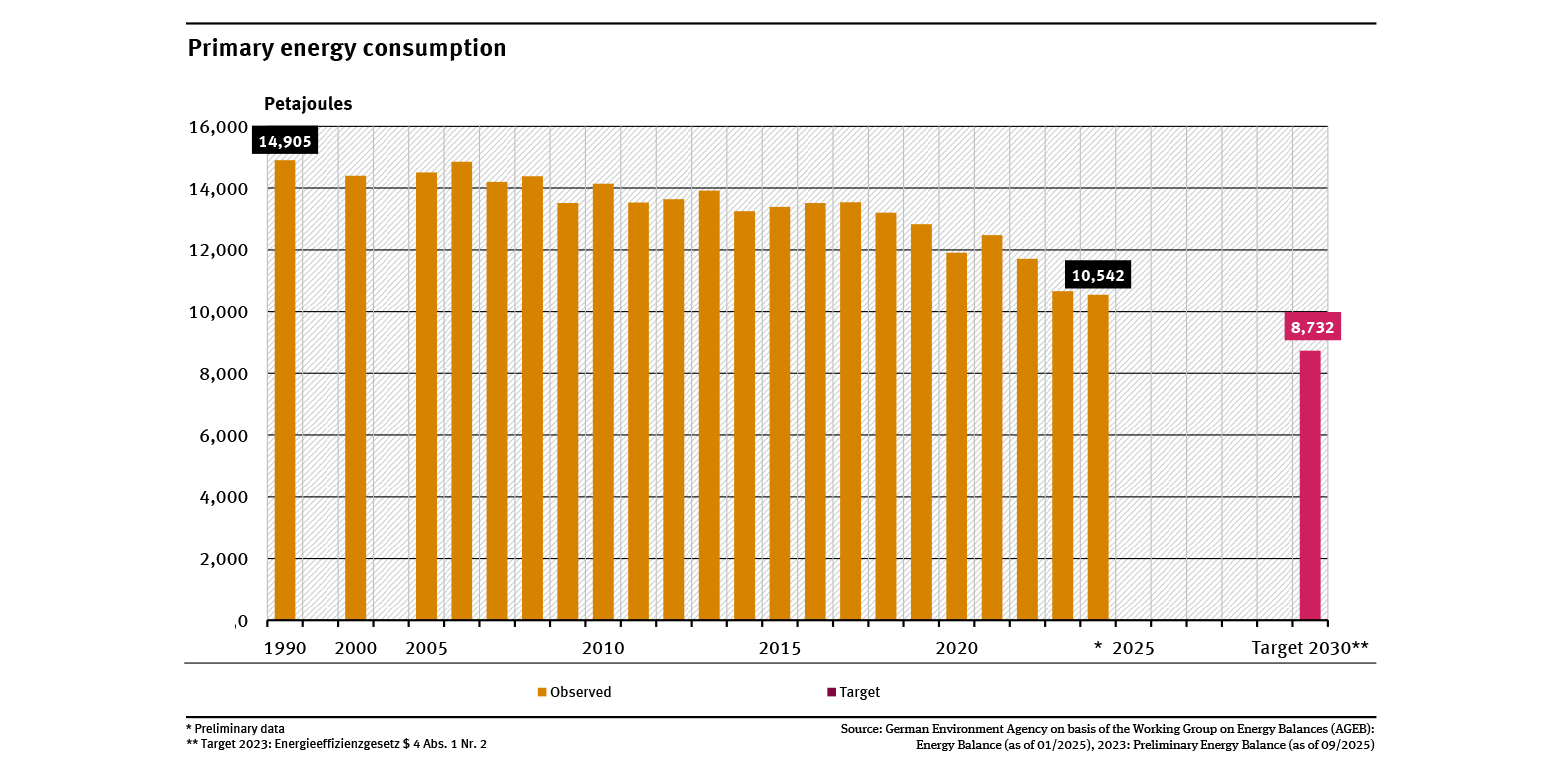
Development of primary energy consumption
- Energie
- Diagramme
- Umwelt-Indikatoren
- Daten und Tabellen

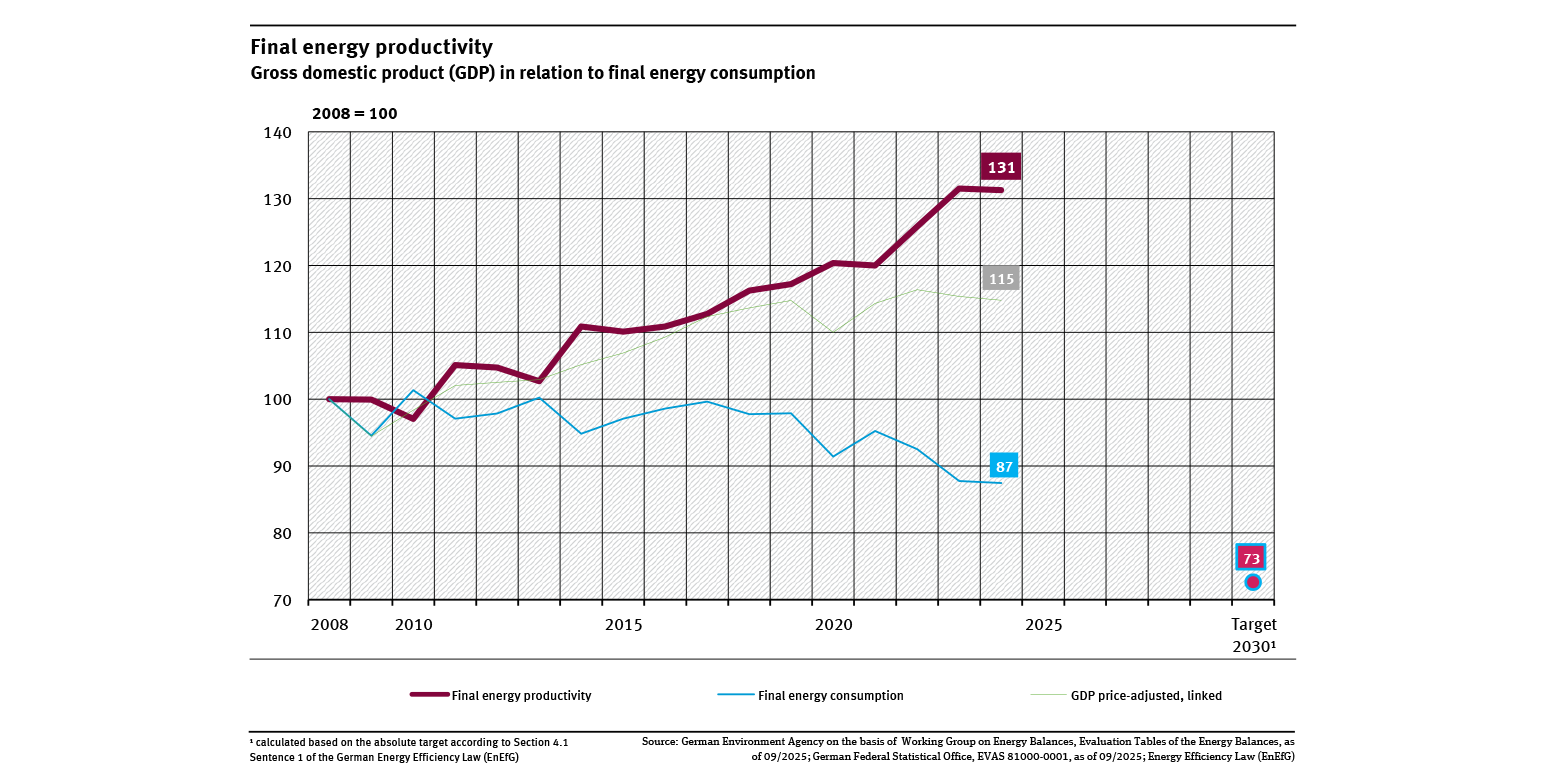
Final energy productivity
- Energie
- Diagramme
- Umwelt-Indikatoren
- Daten und Tabellen

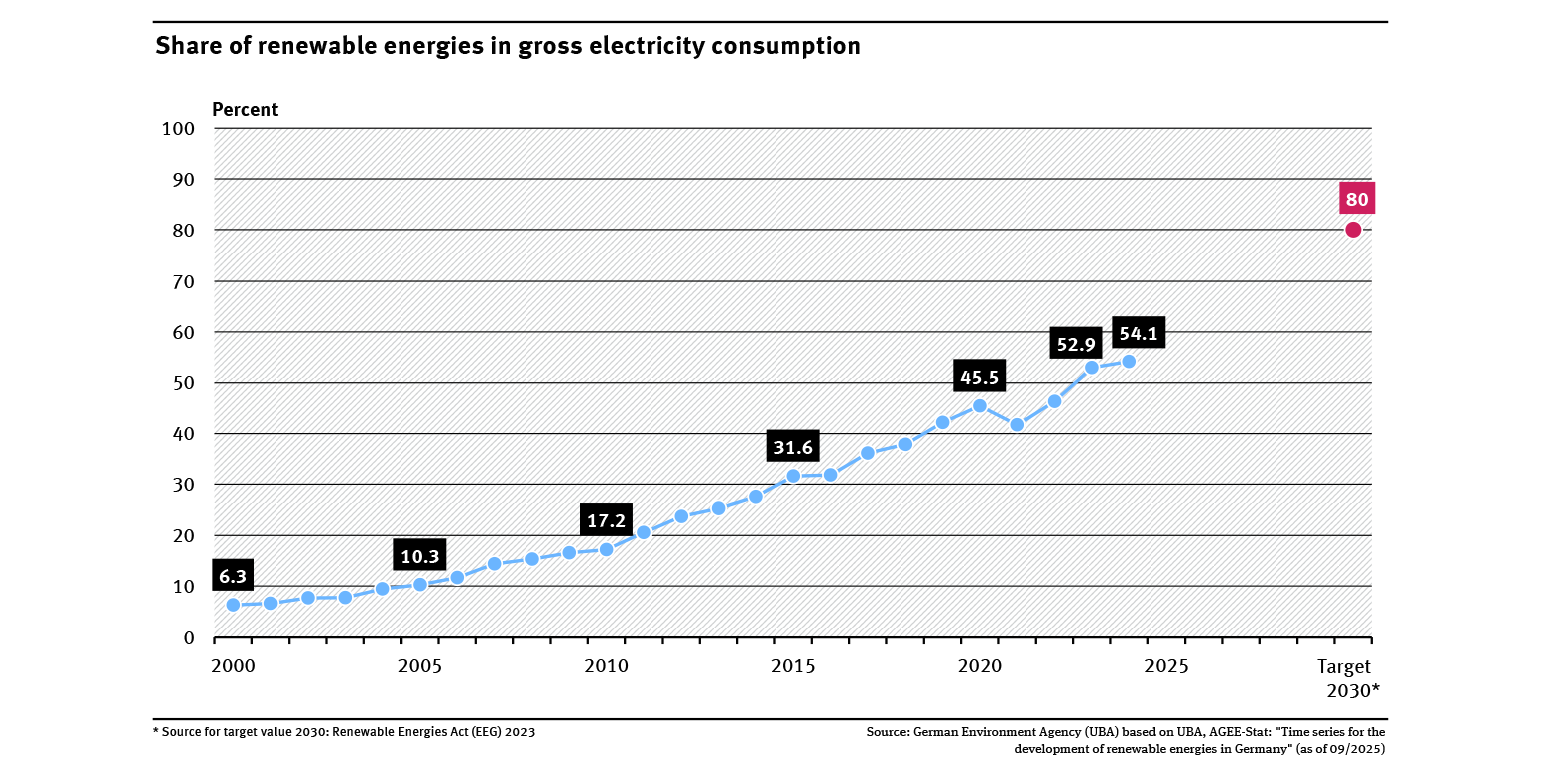
Share of renewable energies in gross electricity consumption
- Energie
- Diagramme
- Umwelt-Indikatoren
- Daten und Tabellen

Time series for the development of renewable energy sources based on statistical data from the Working Group on Renewable Energy-Statistics (AGEE-Stat) in Germany (XLSX-file)
- Klima
- Energie
- Diagramme
- Infografiken
- Daten und Tabellen
Export data

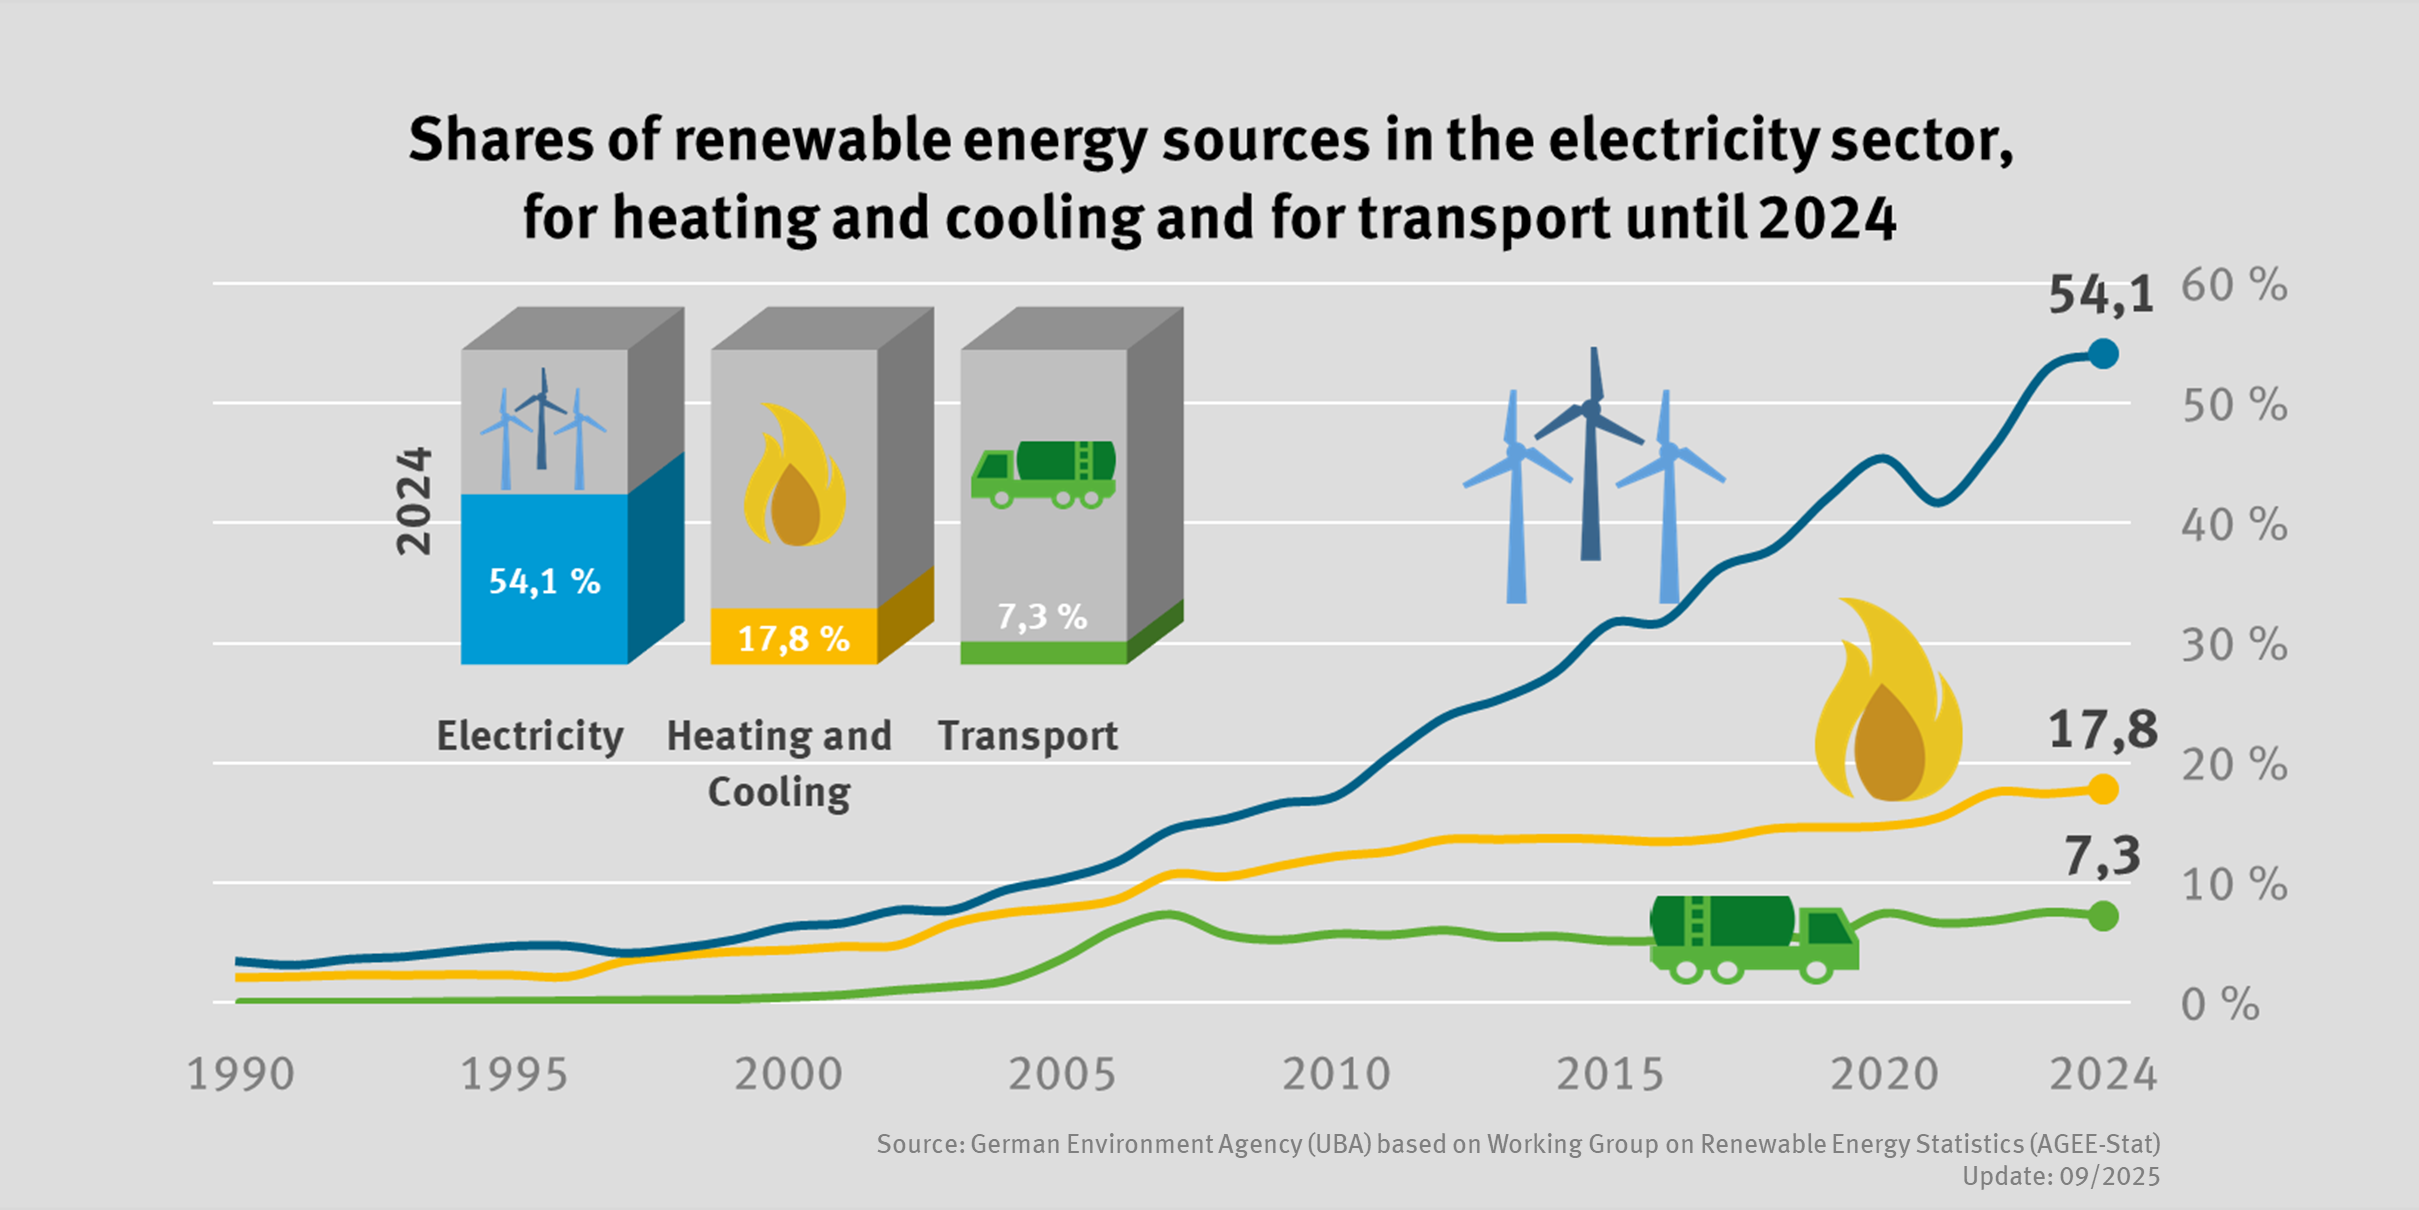
Development of renewable energy shares for electricity, heat and transport
- Energie
- Infografiken
Export data

Final energy consumption
- Energie
- Diagramme
- Umwelt-Indikatoren
- Daten und Tabellen