Data Search

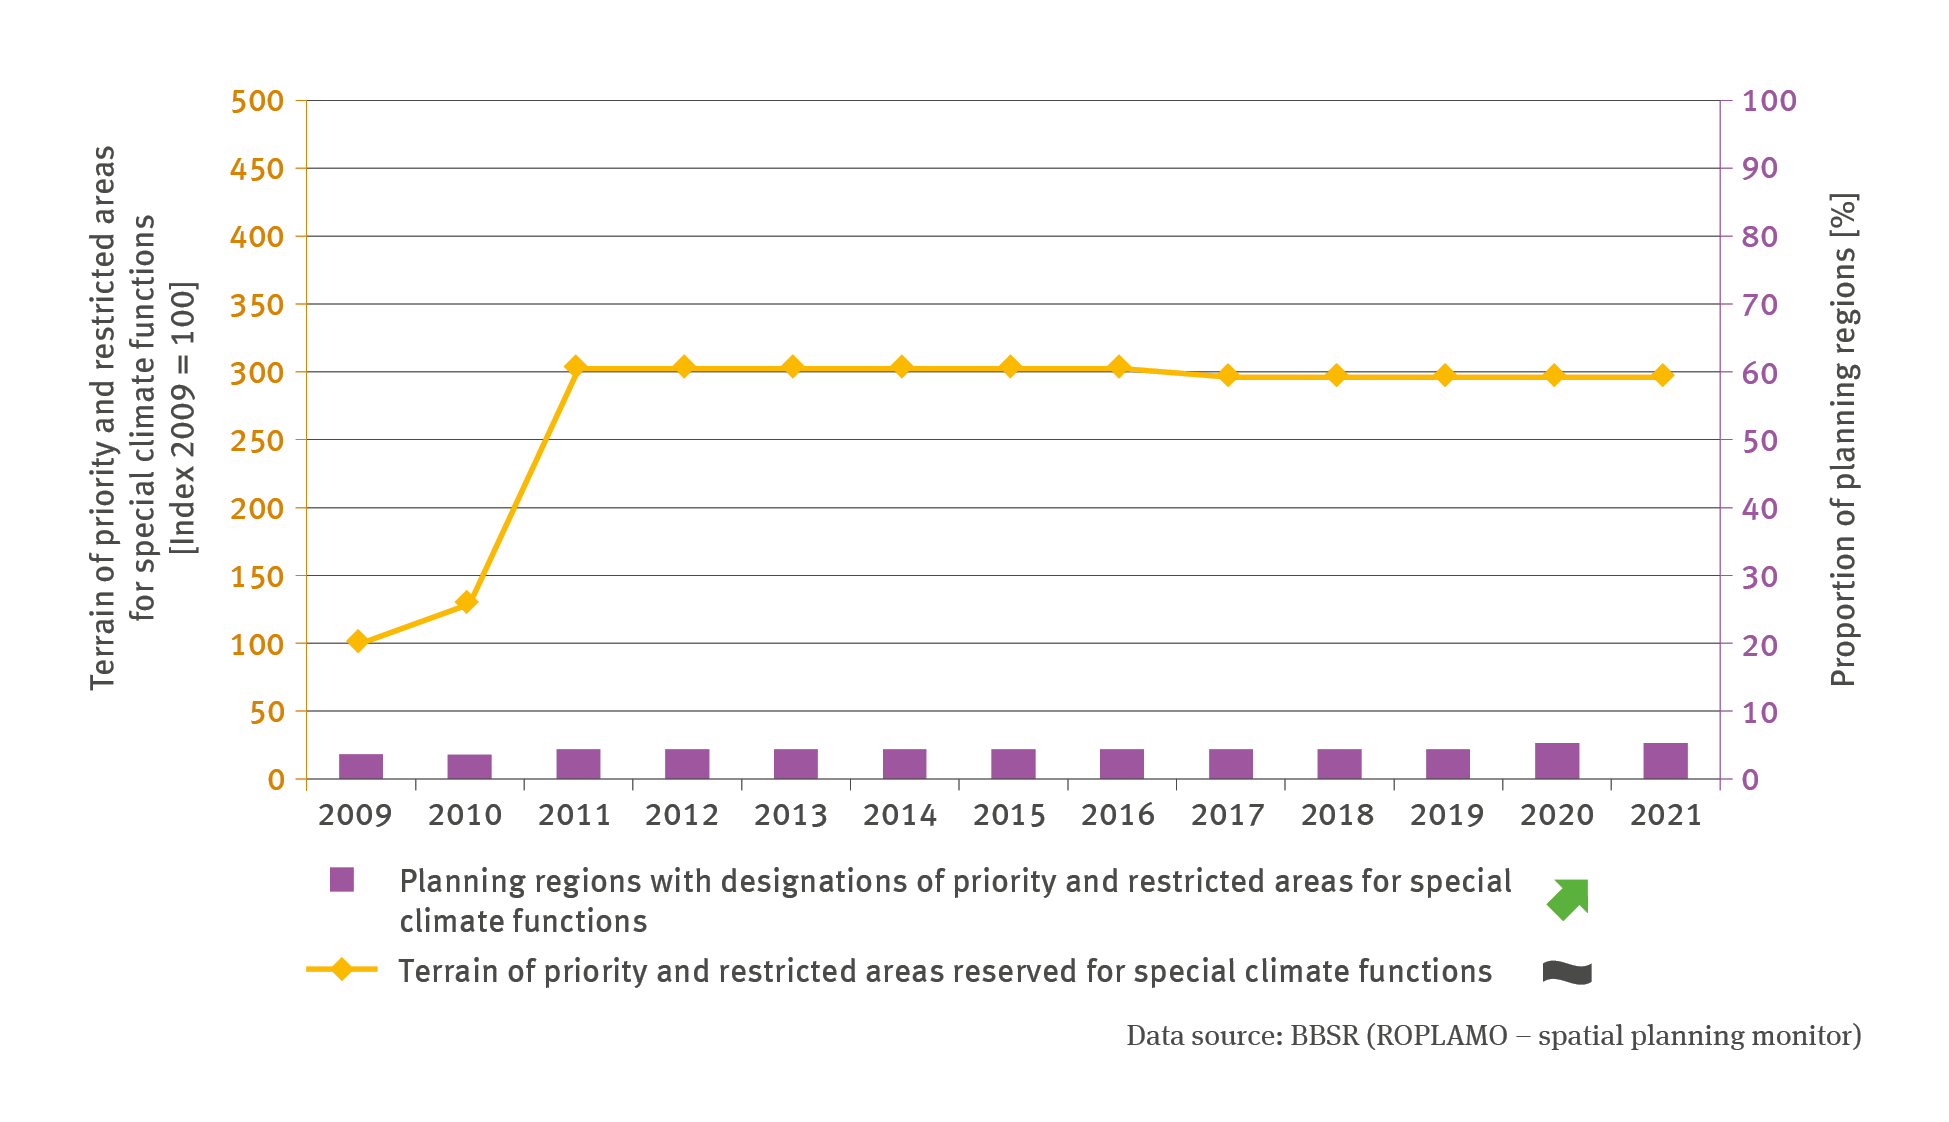
RO-R-4: Priority and restricted areas reserved for special climate functions
- Klima
- Fläche, Boden, Land-Ökosysteme
- Diagramme
Export data

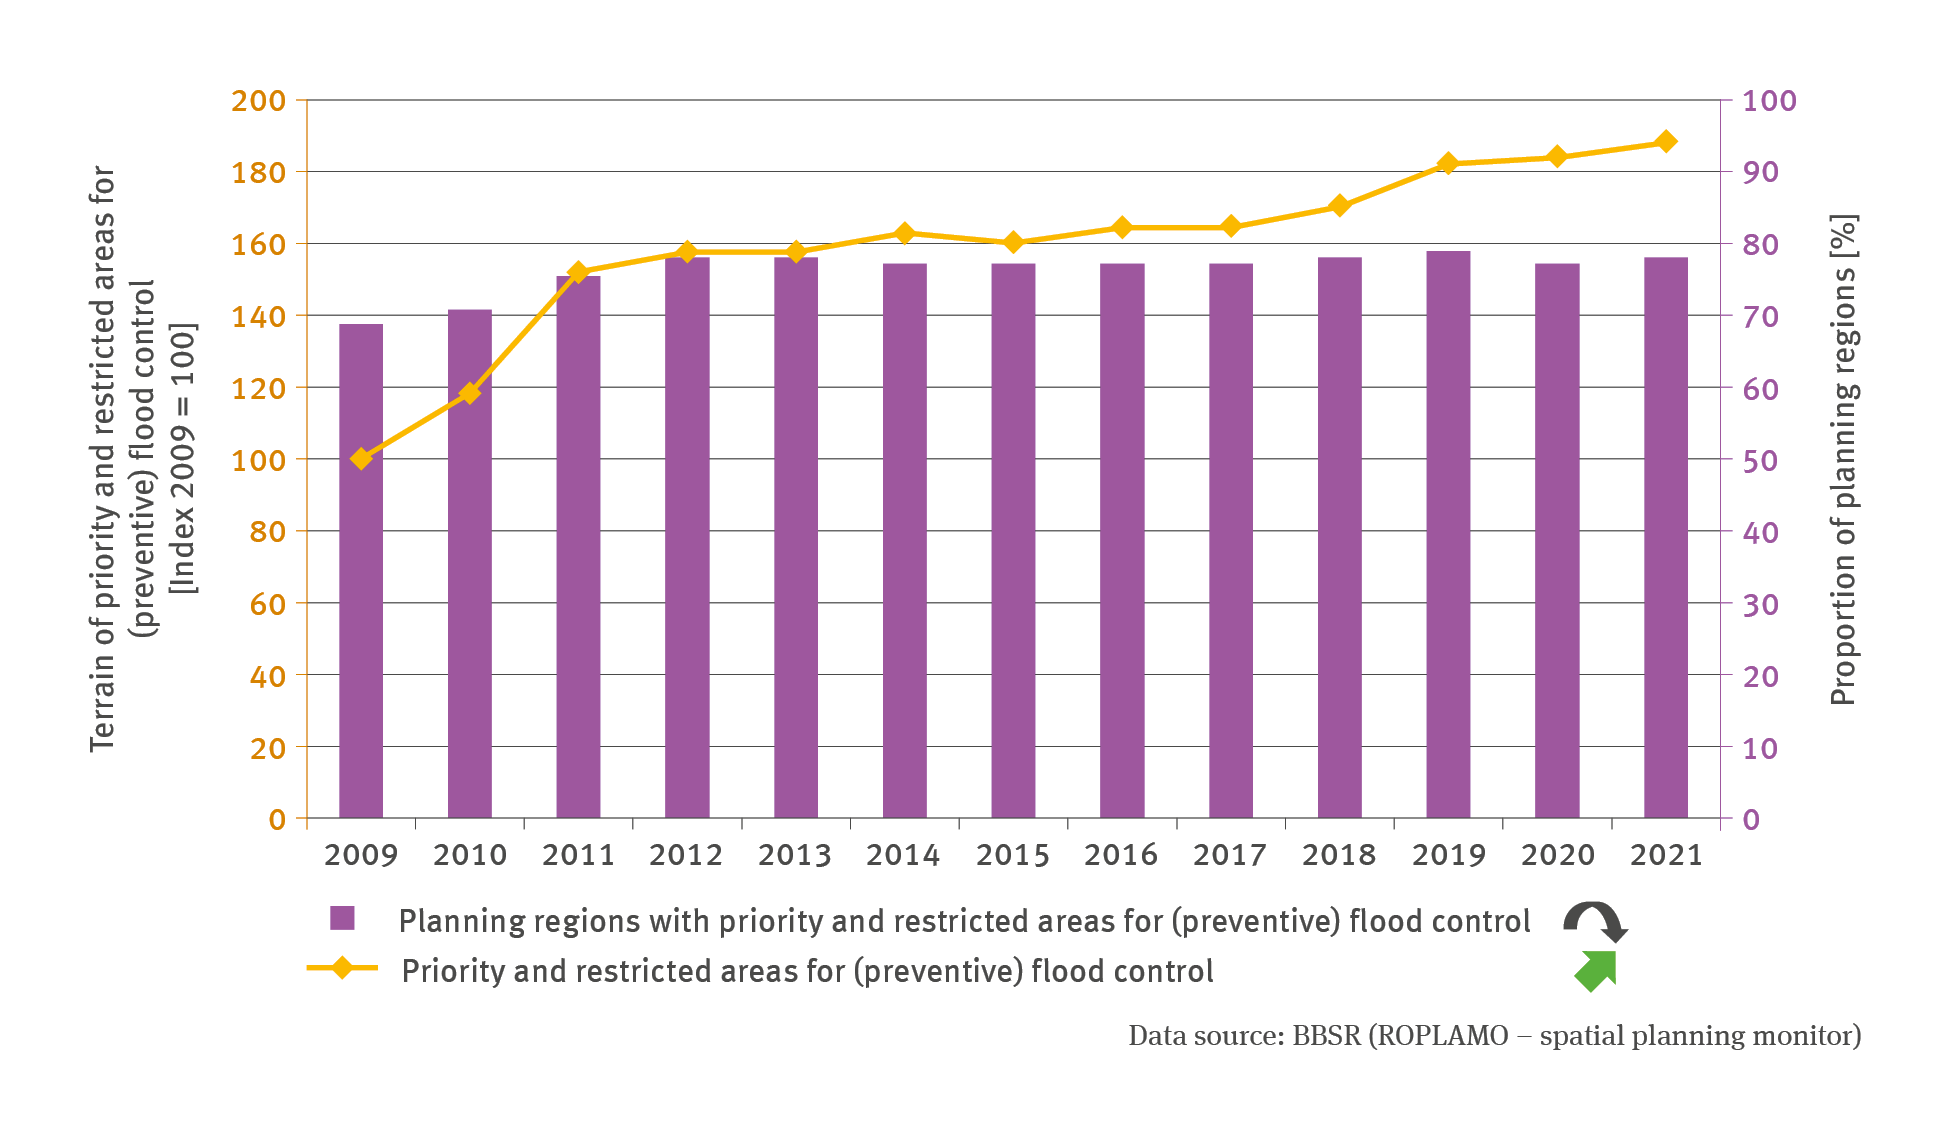
RO-R-3: Priority and restricted areas for (preventive) flood control
- Klima
- Fläche, Boden, Land-Ökosysteme
- Wasser
- Diagramme
Export data

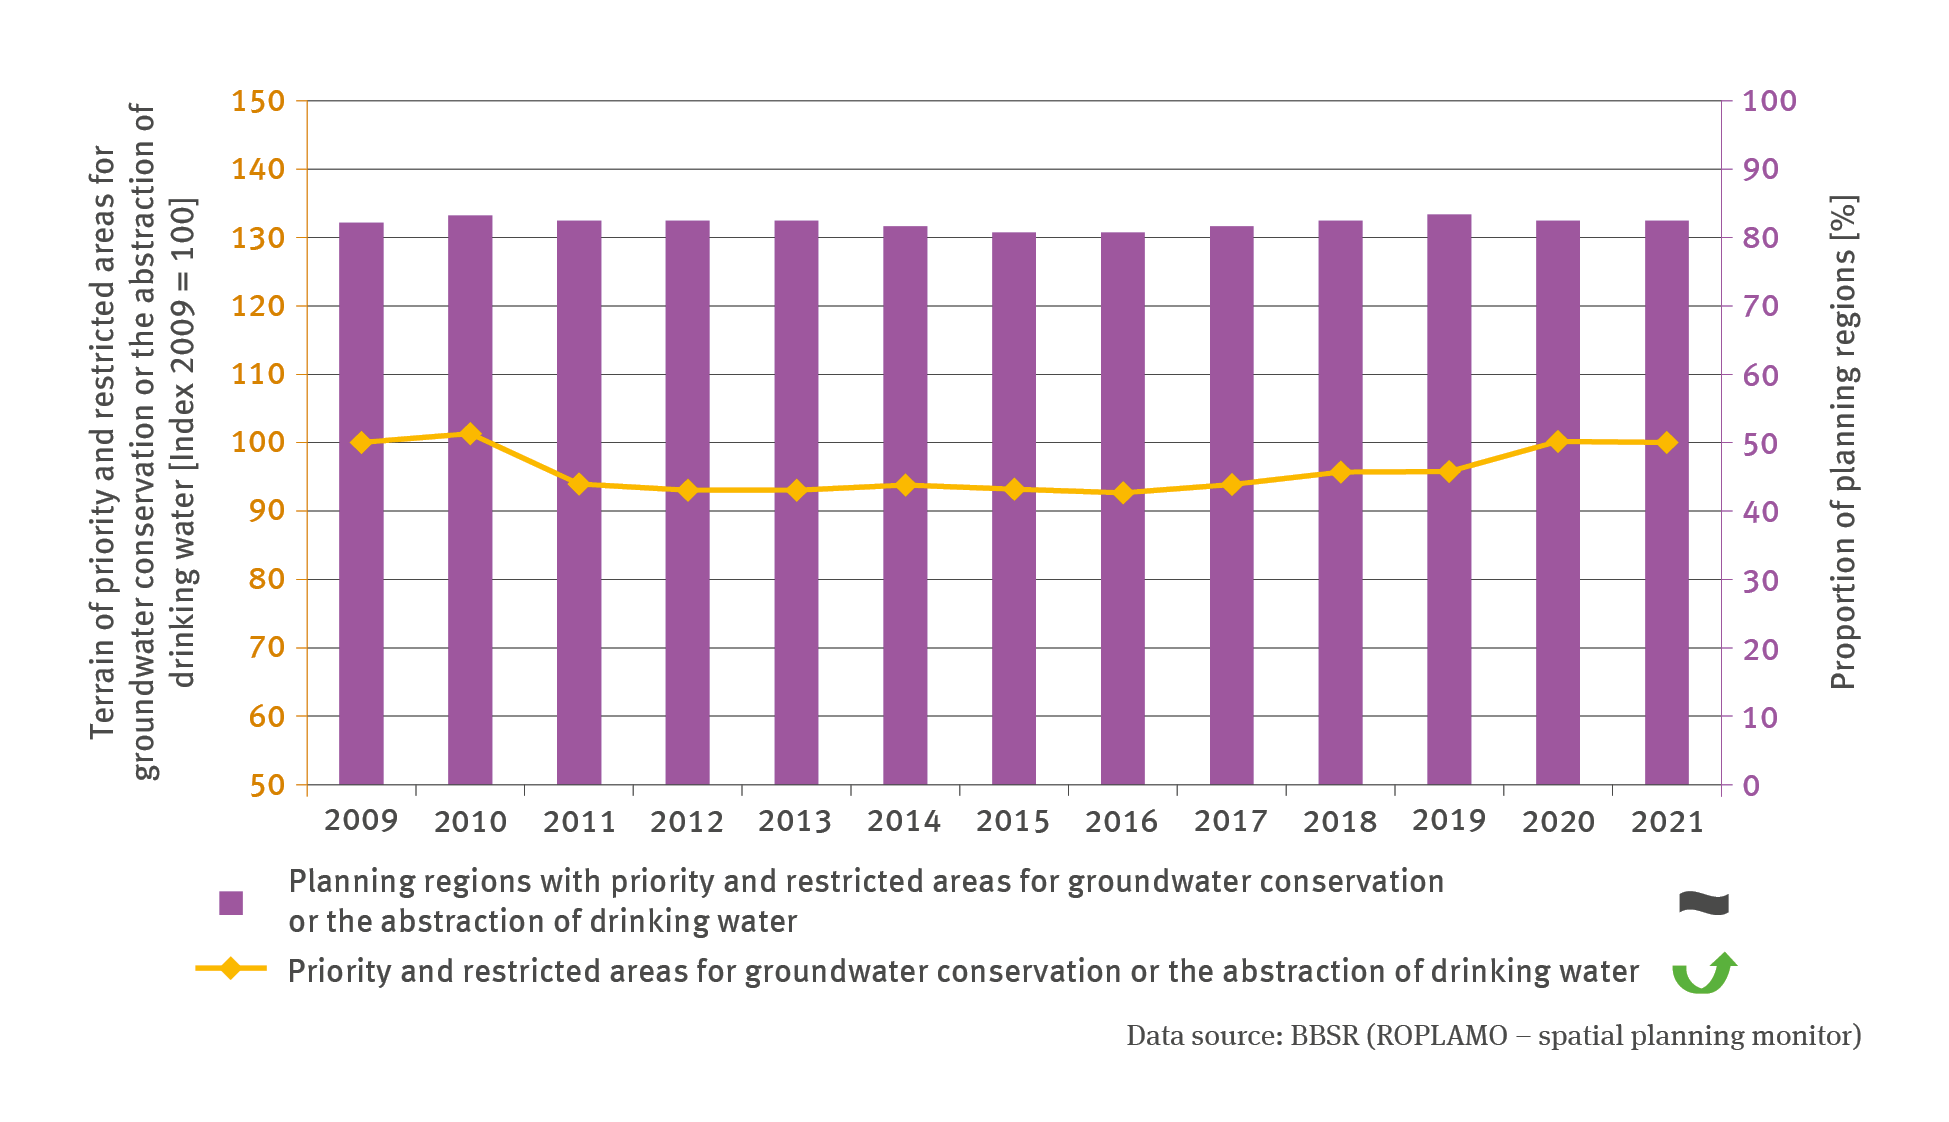
RO-R-2: Priority and reserved areas groundwater / drinking water
- Klima
- Fläche, Boden, Land-Ökosysteme
- Wasser
- Diagramme
Export data

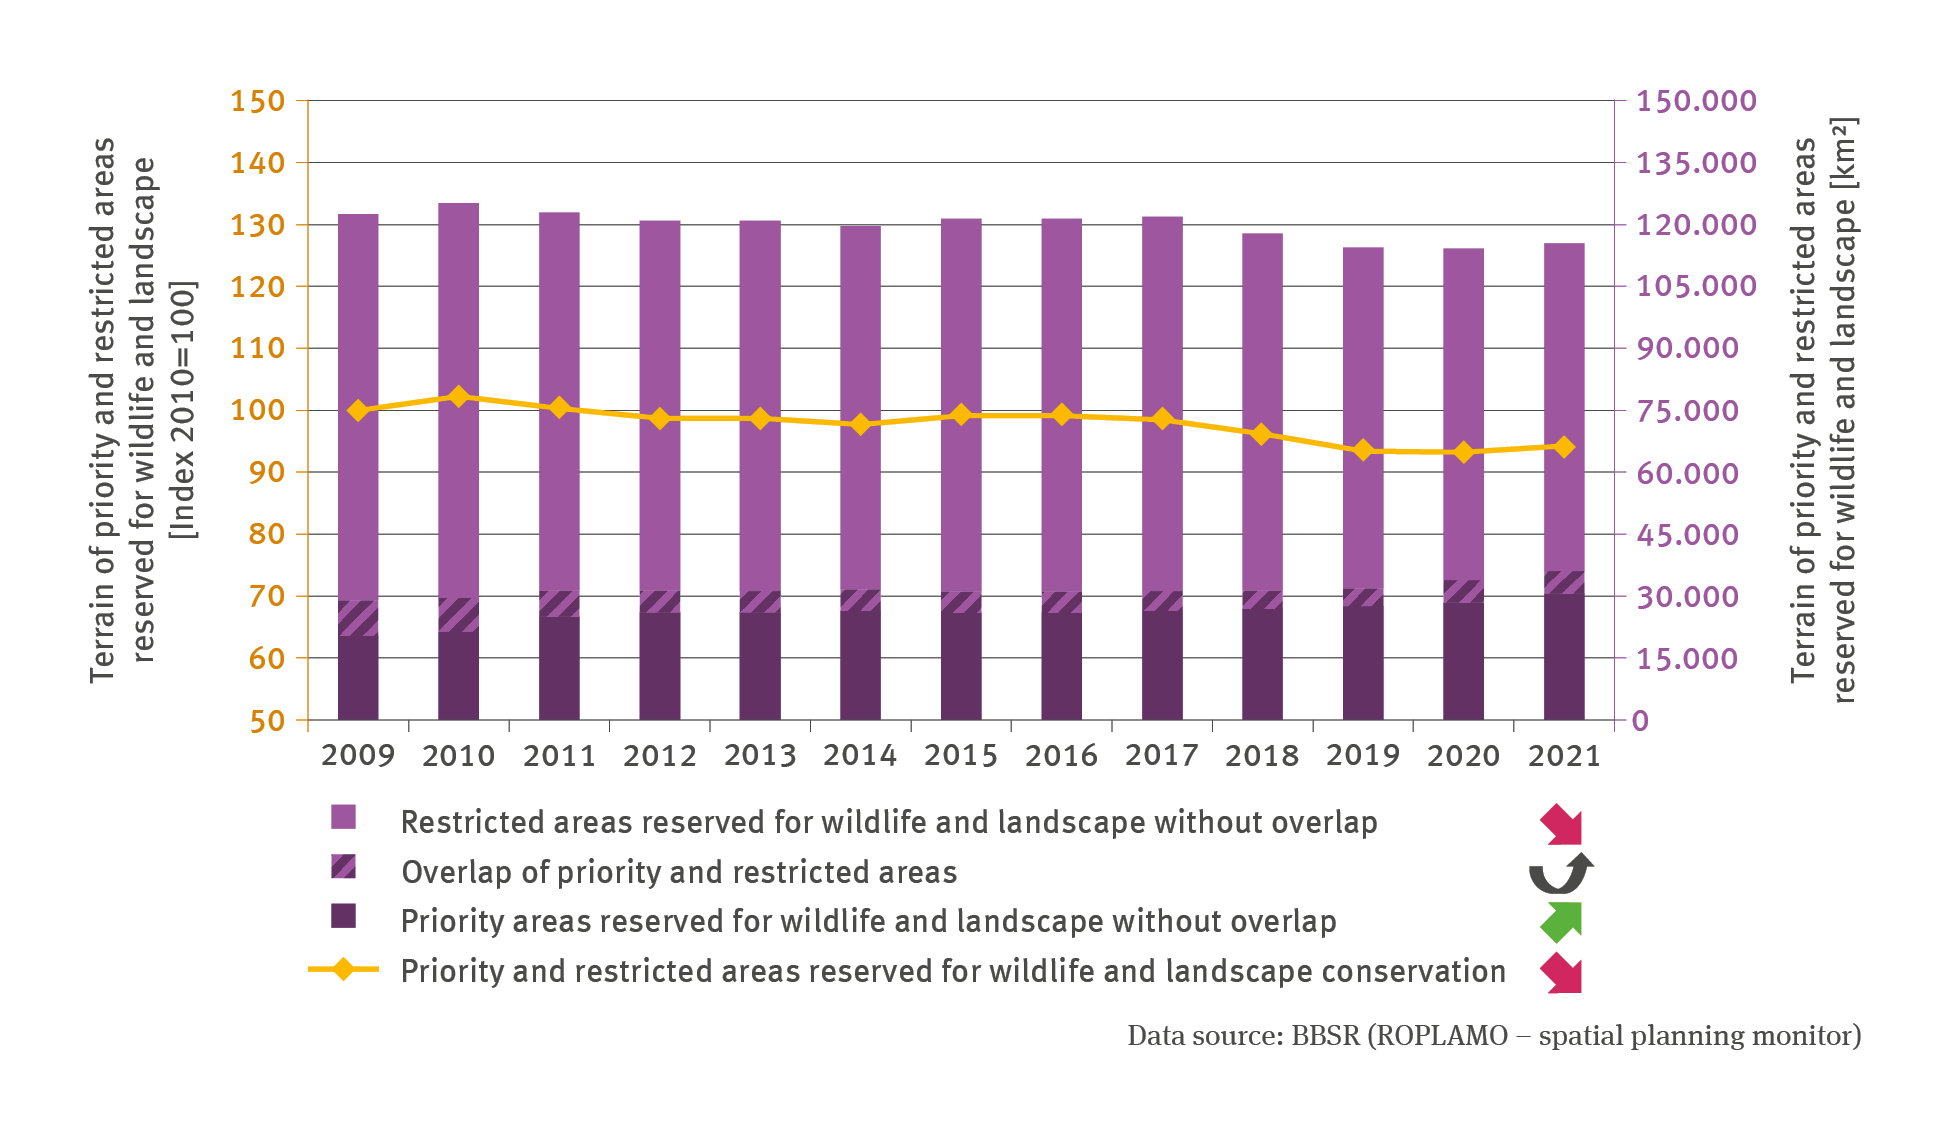
RO-R-1: Priority and restricted areas reserved for wildlife and landscape conservation
- Klima
- Fläche, Boden, Land-Ökosysteme
- Diagramme
Export data

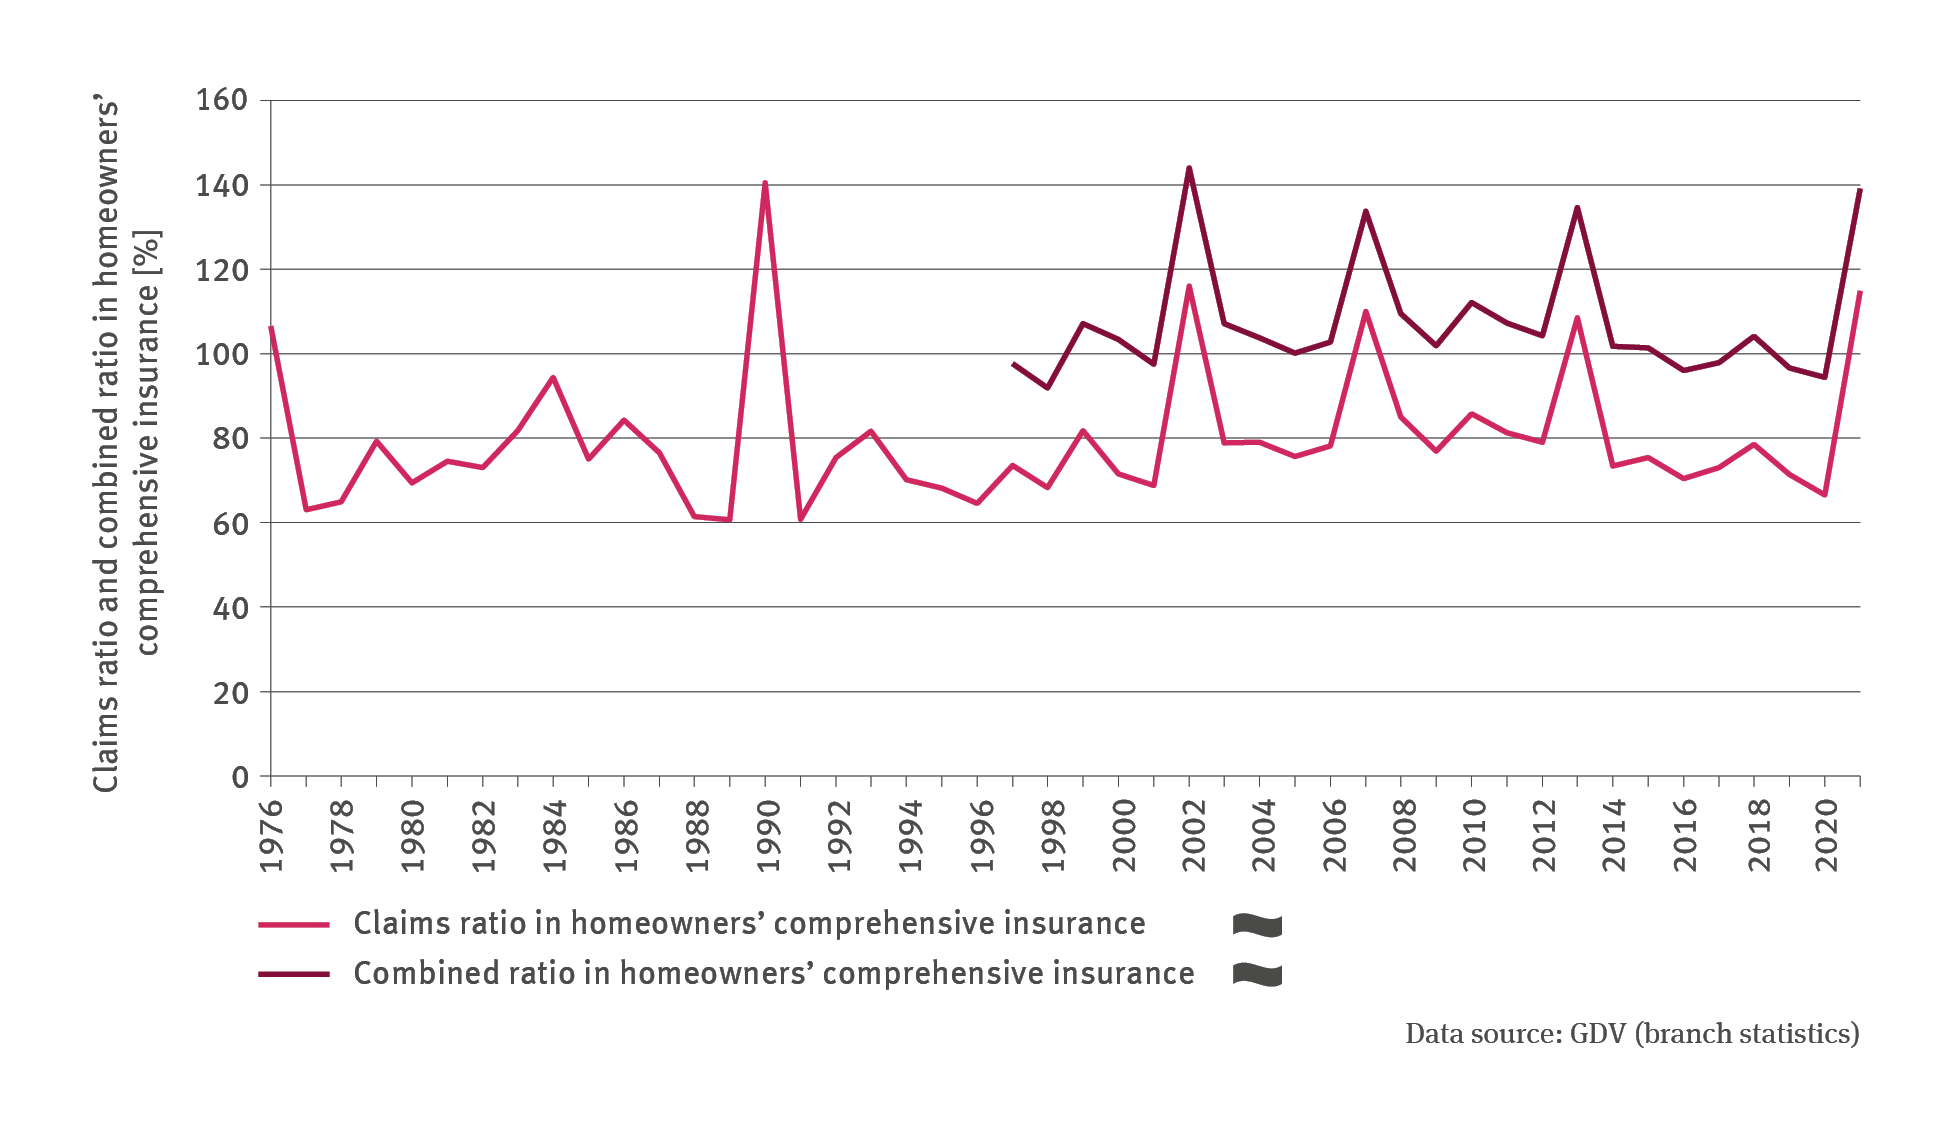
FiW-I-1: Claims ratio and combined ratio in homeowners’ comprehensive insurance
- Klima
- Umwelt und Wirtschaft
- Diagramme
Export data

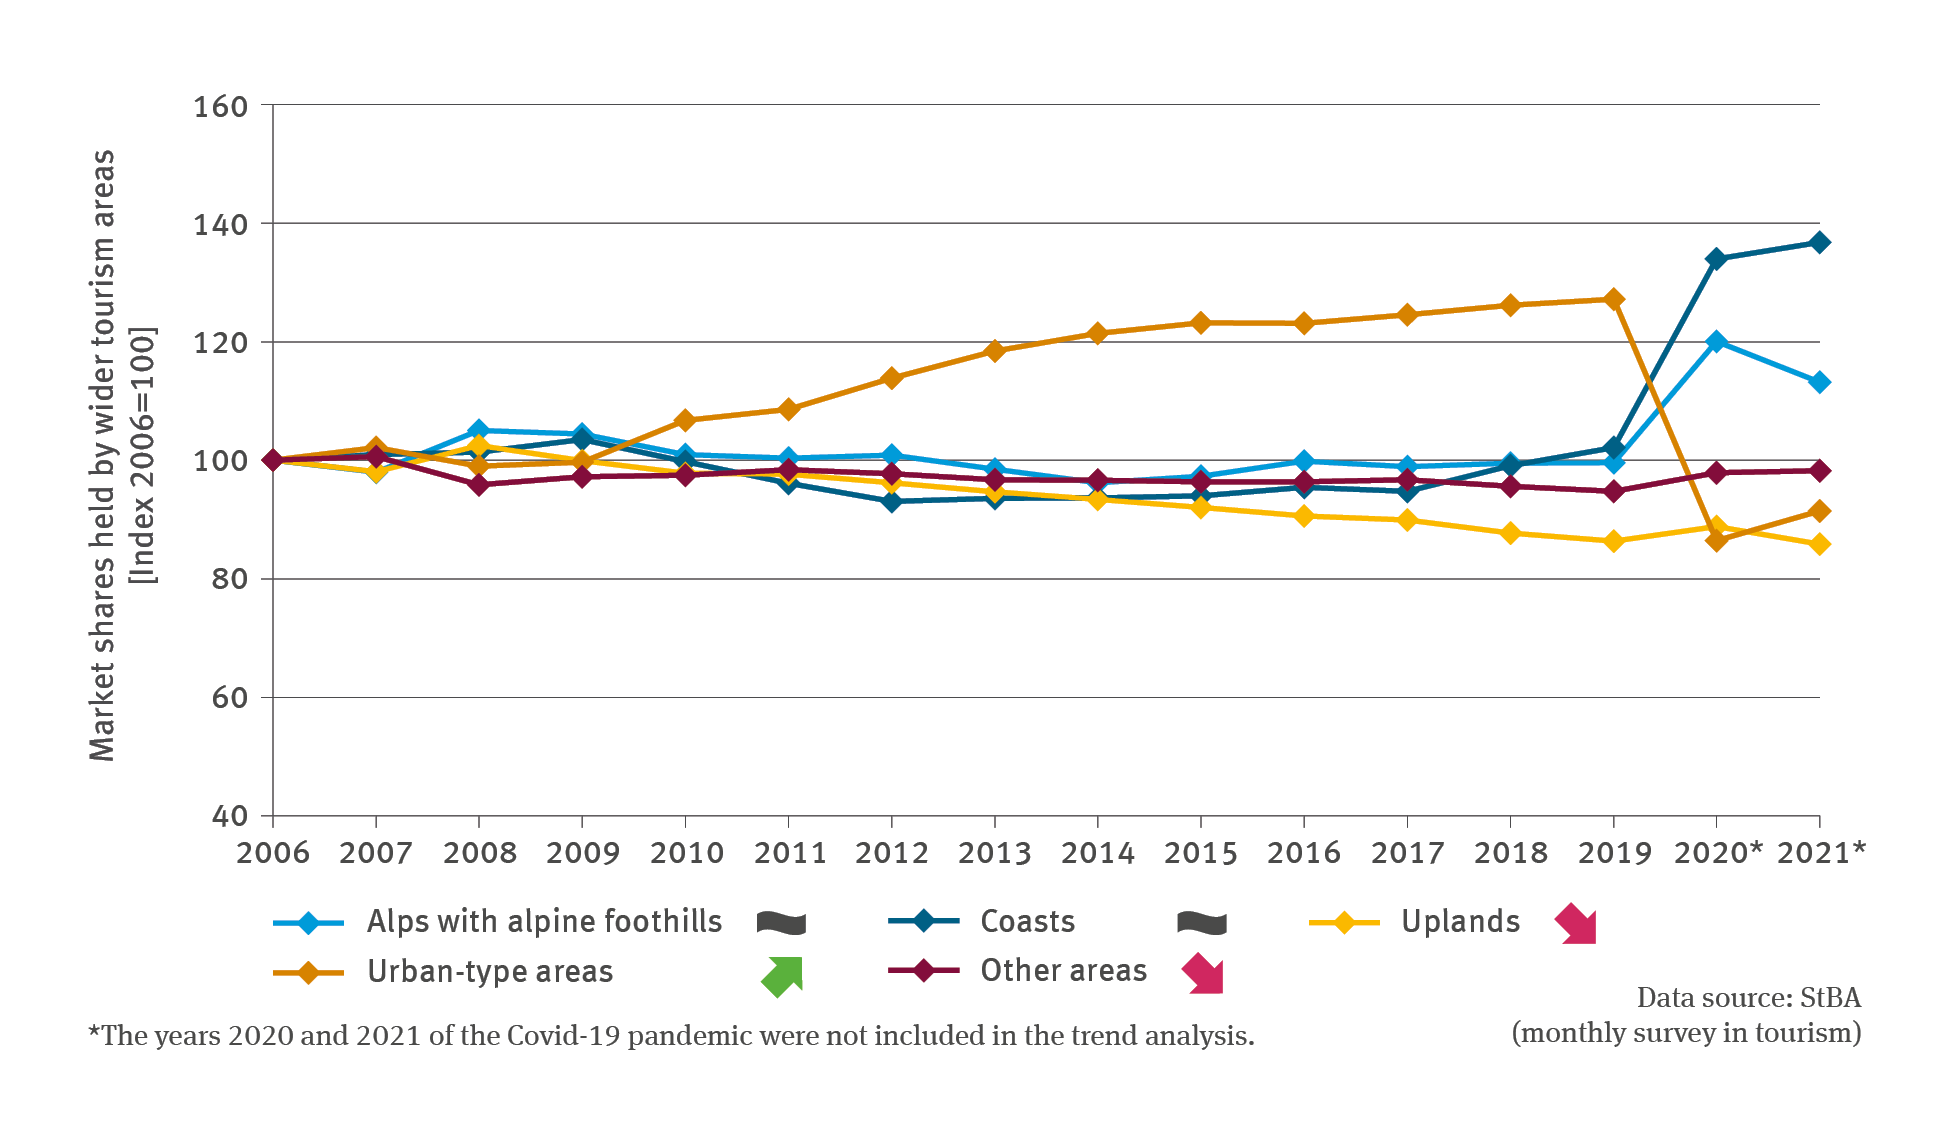
TOU-I-3: Market shares held by wider tourism areas
- Klima
- Umwelt und Gesundheit
- Diagramme
Export data

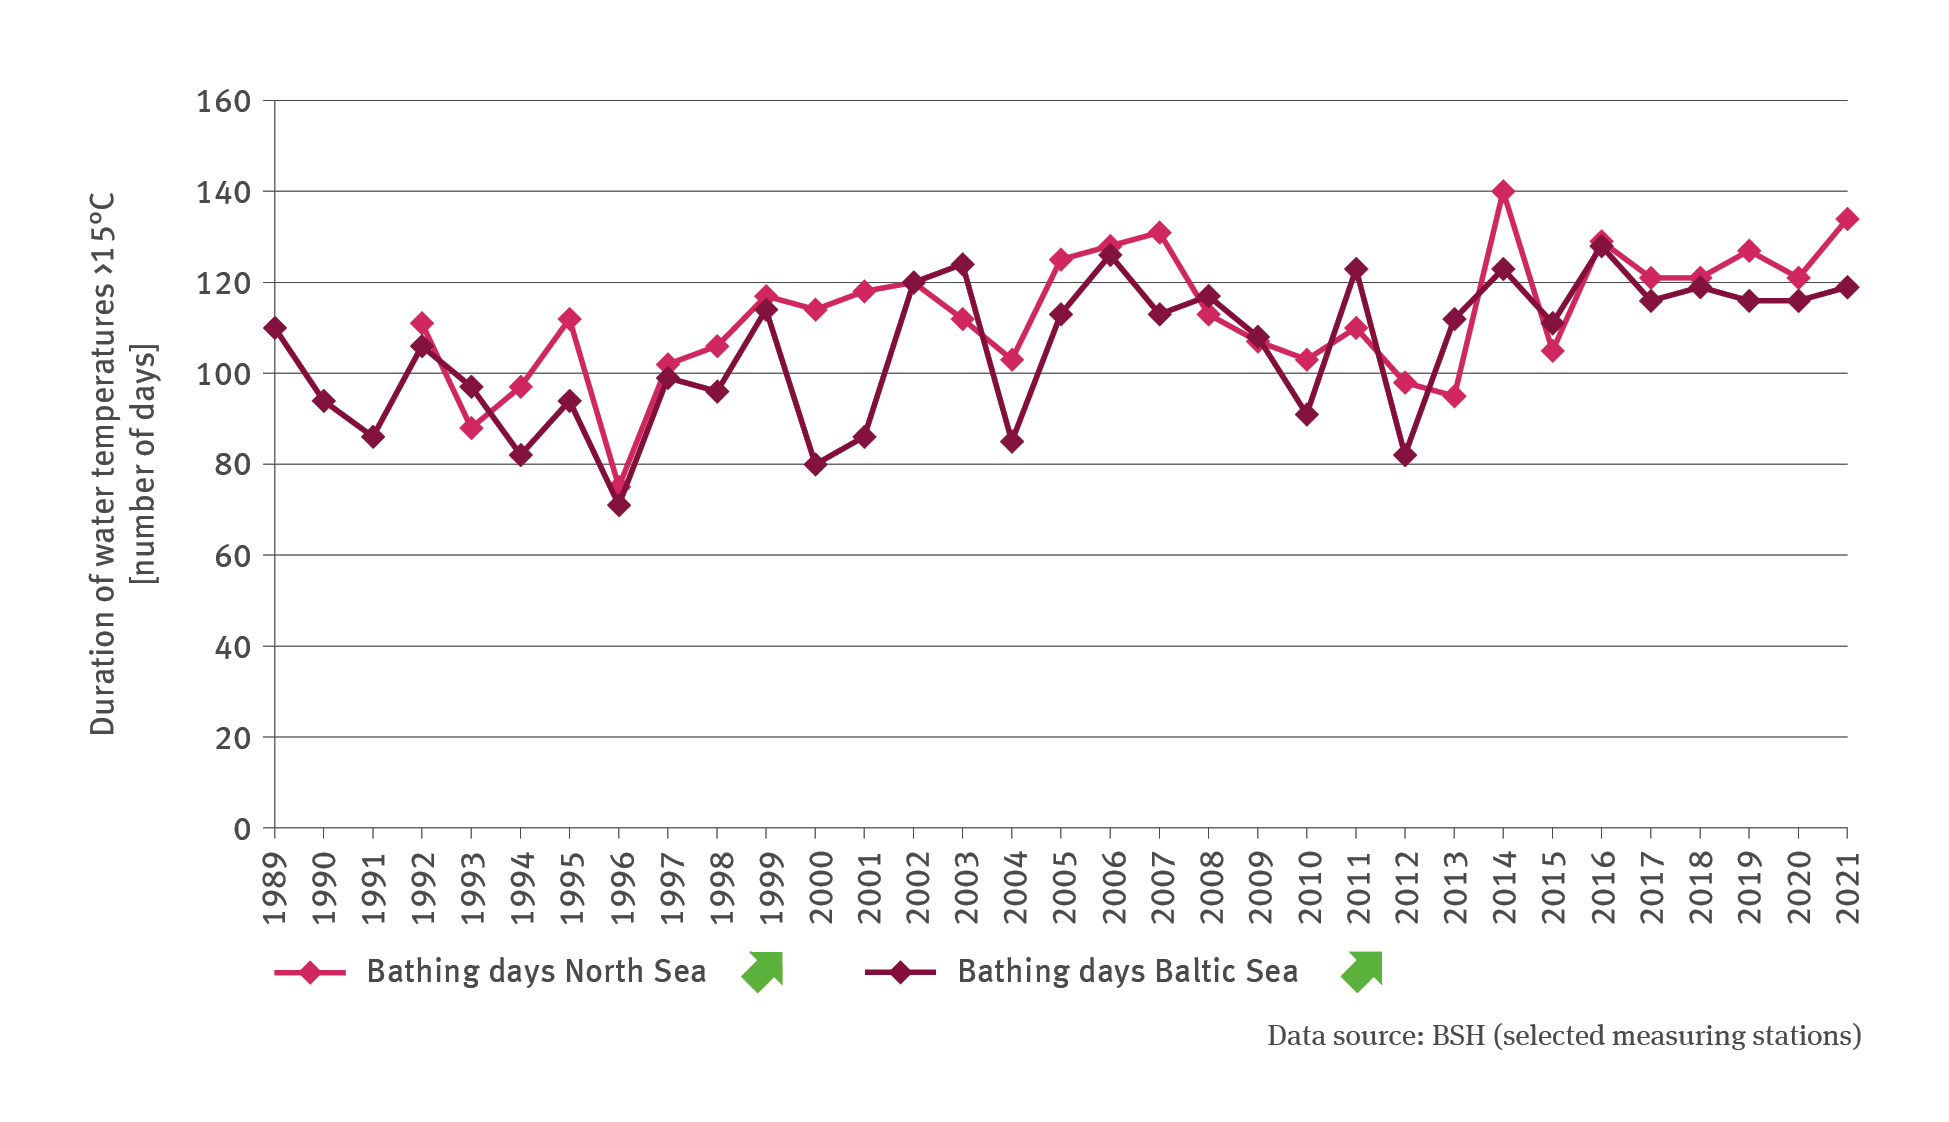
TOU-I-1: Coastal bathing temperatures
- Klima
- Wasser
- Private Haushalte und Konsum
- Diagramme
Export data

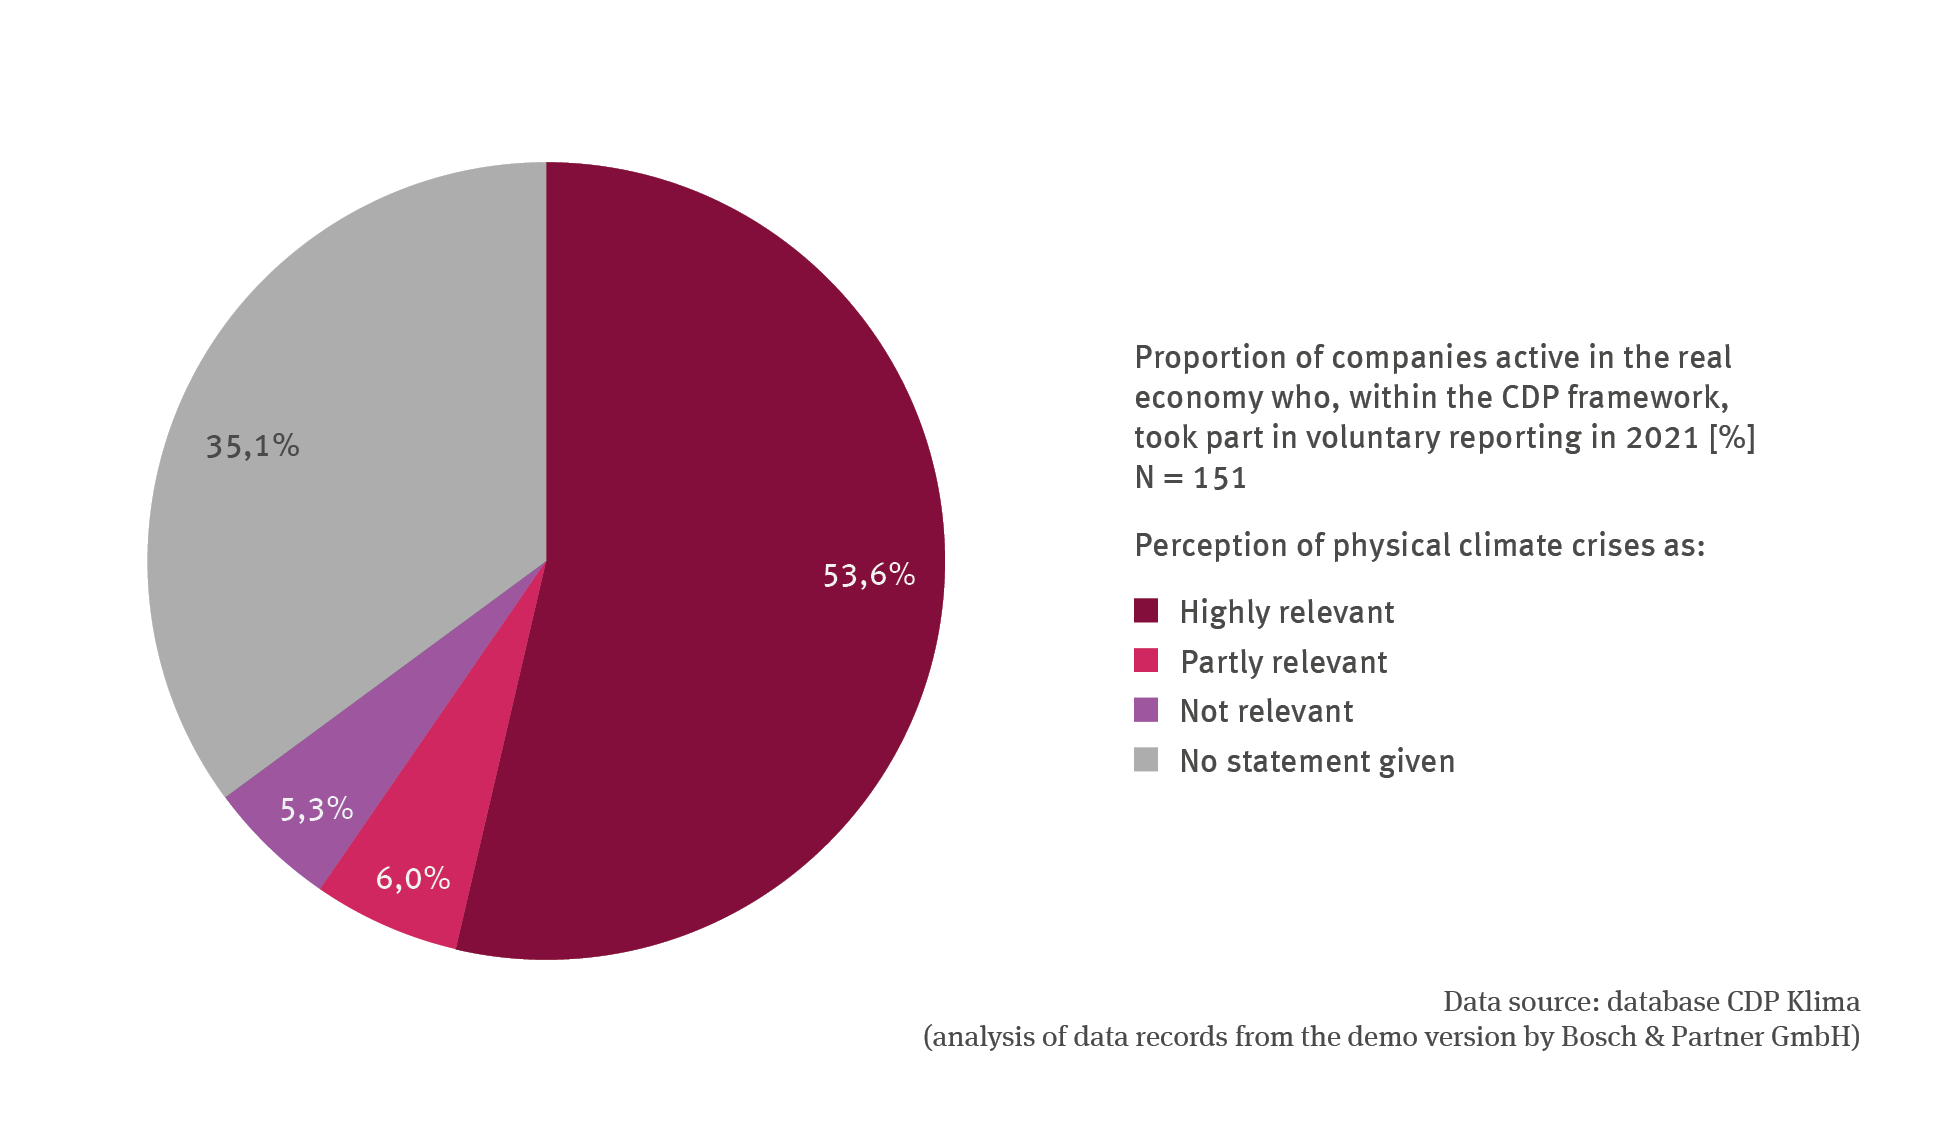
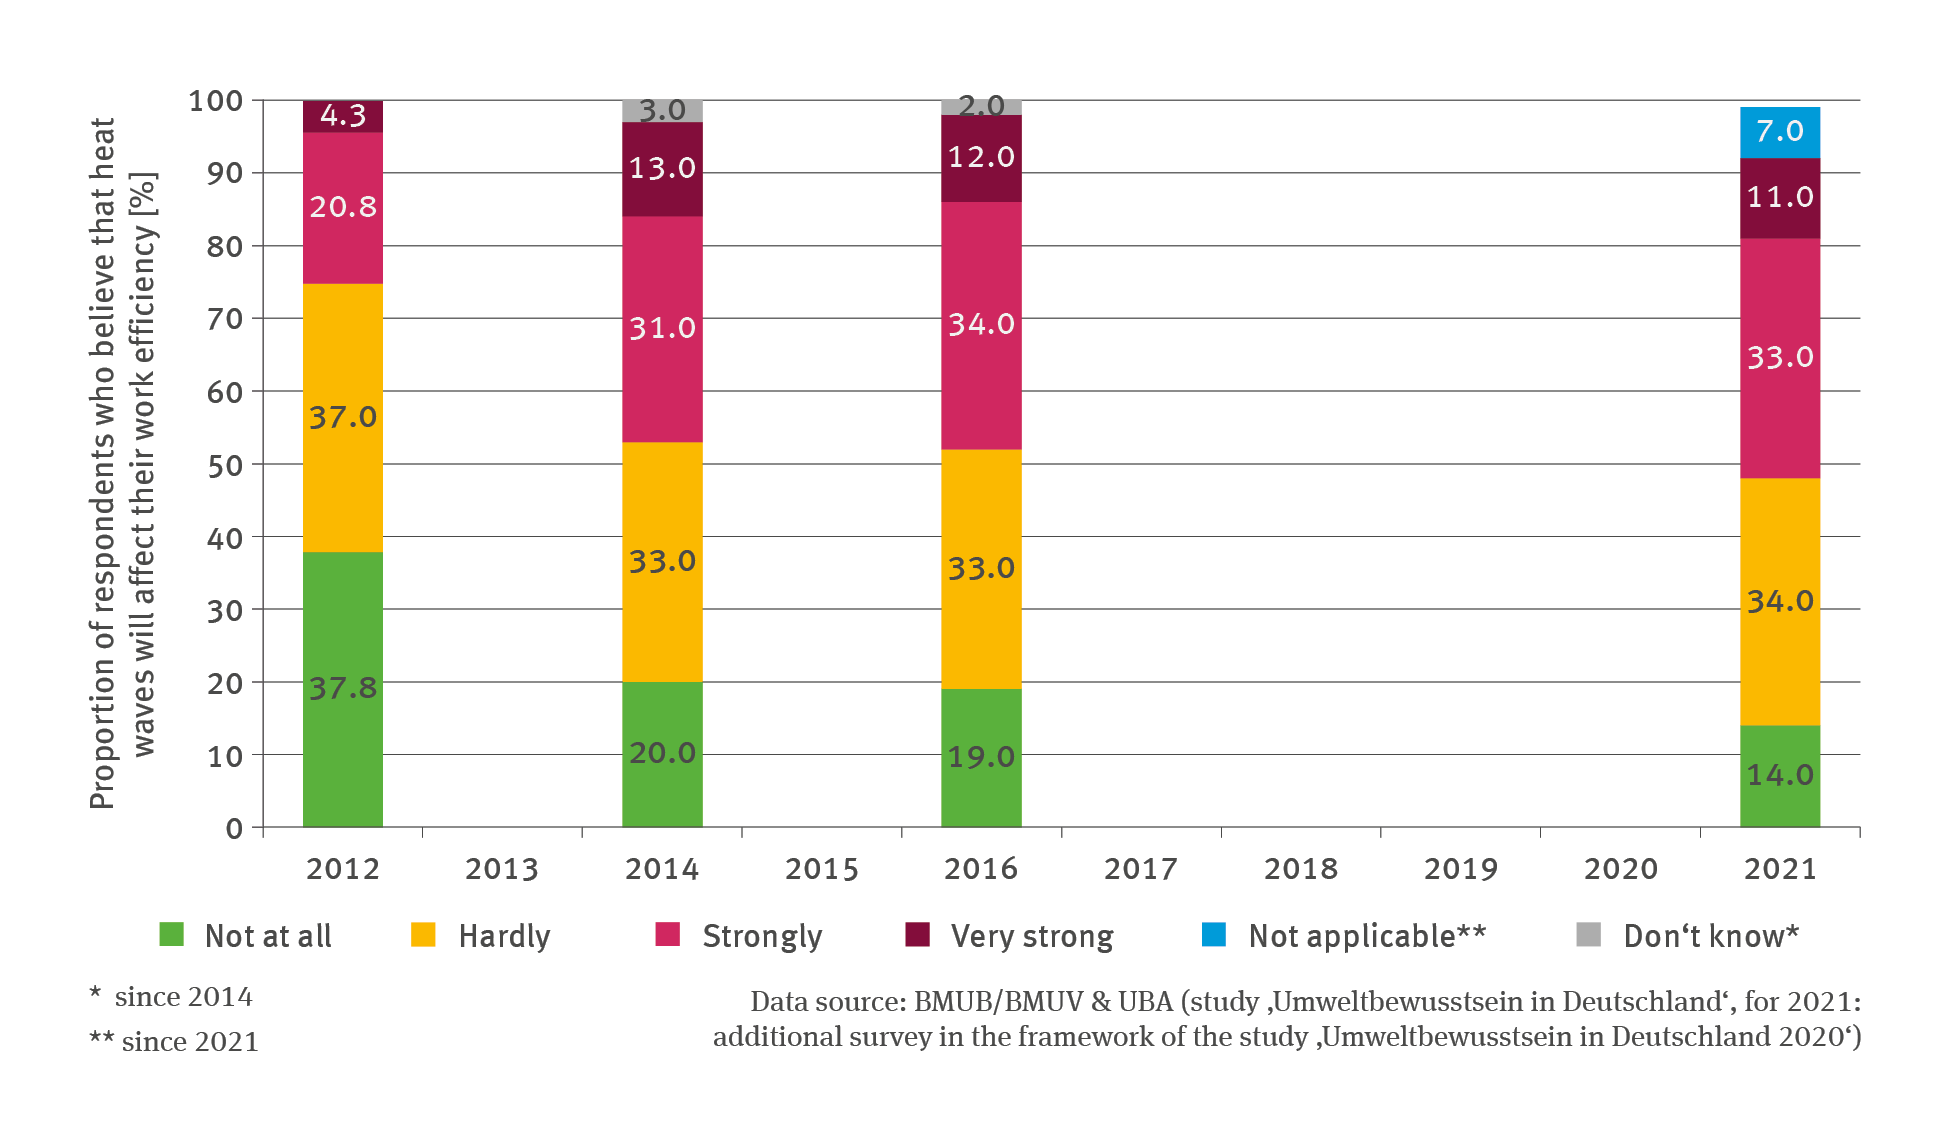
IG-R-1: Perception of the relevance of physical climate risks in trade and industry
- Klima
- Umwelt und Wirtschaft
- Diagramme
Export data


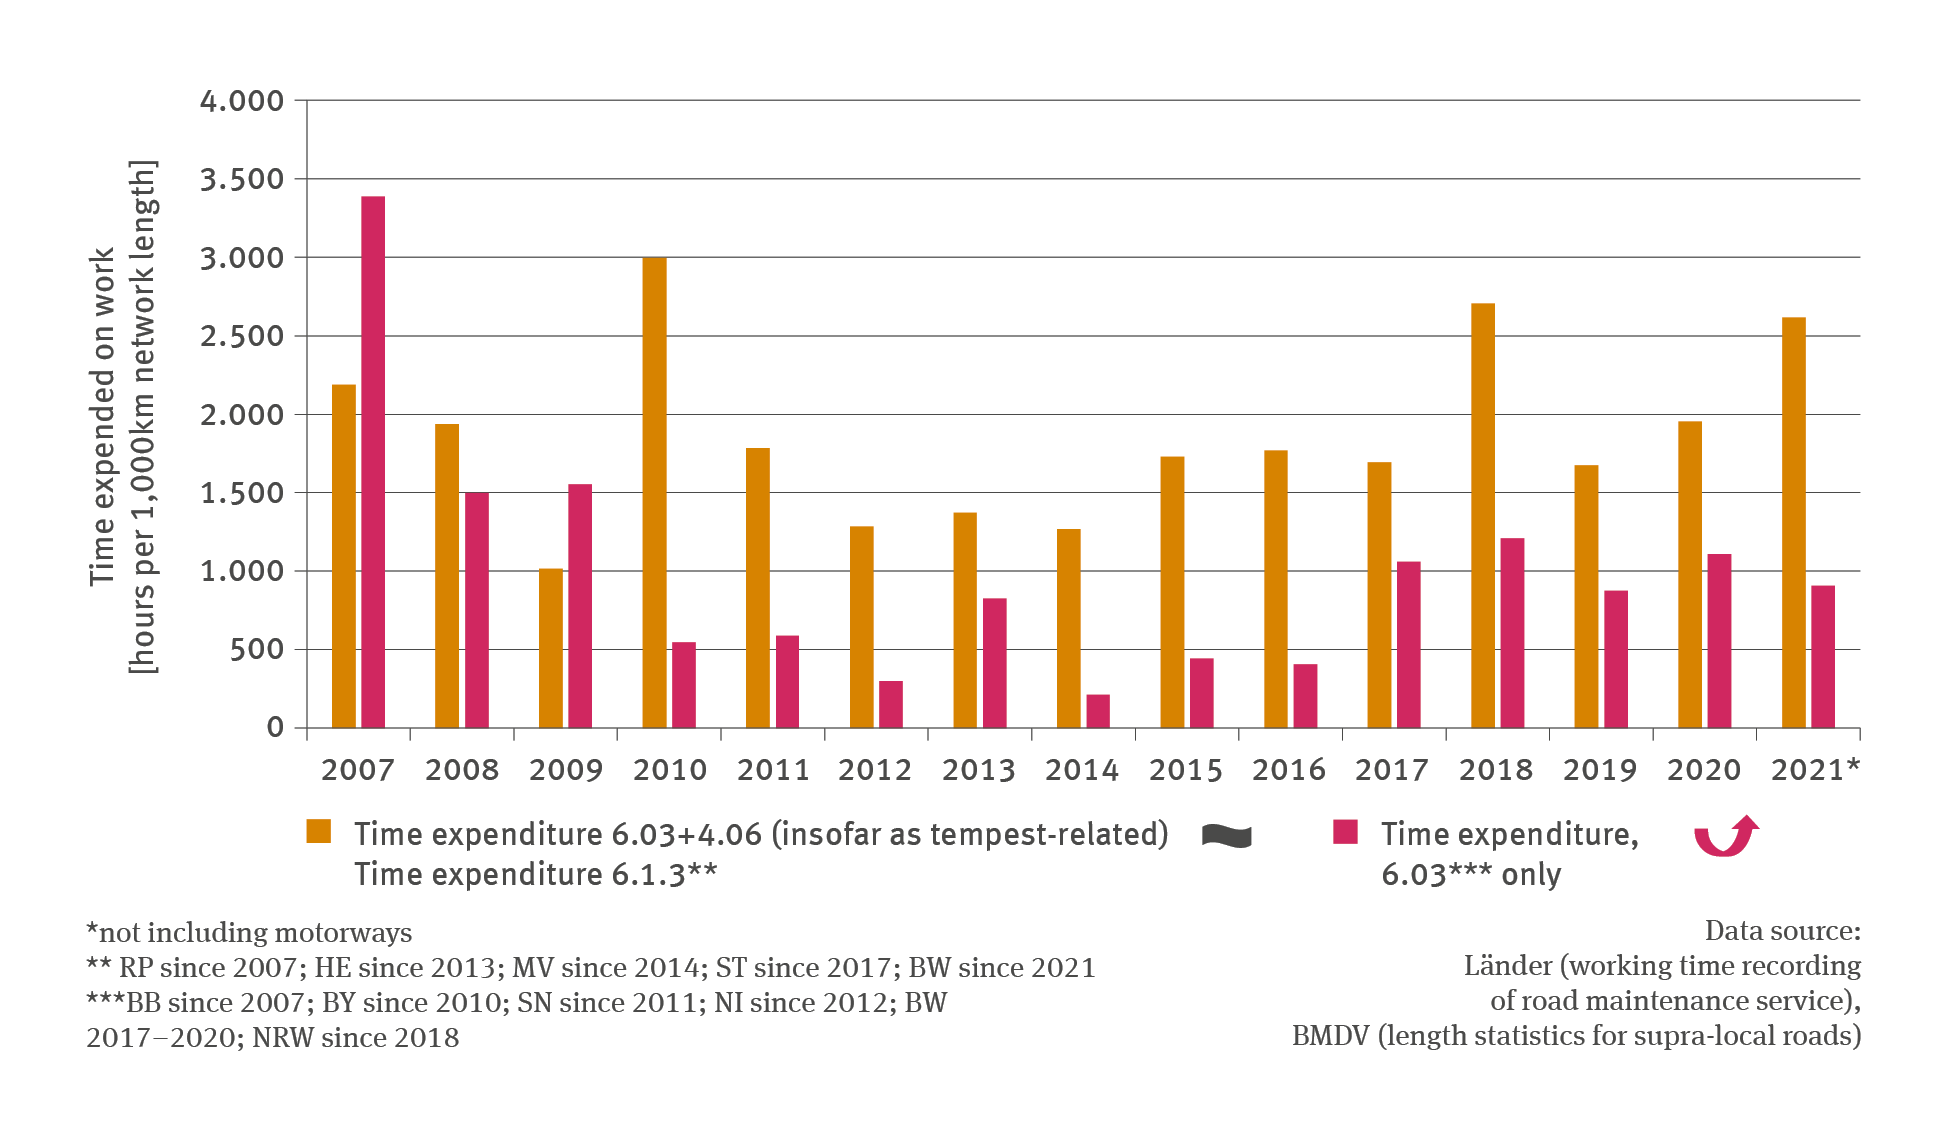
VE-I-5: Impacts on roads due to weather conditions and weather patterns
- Klima
- Verkehr
- Diagramme
Export data