Data Search

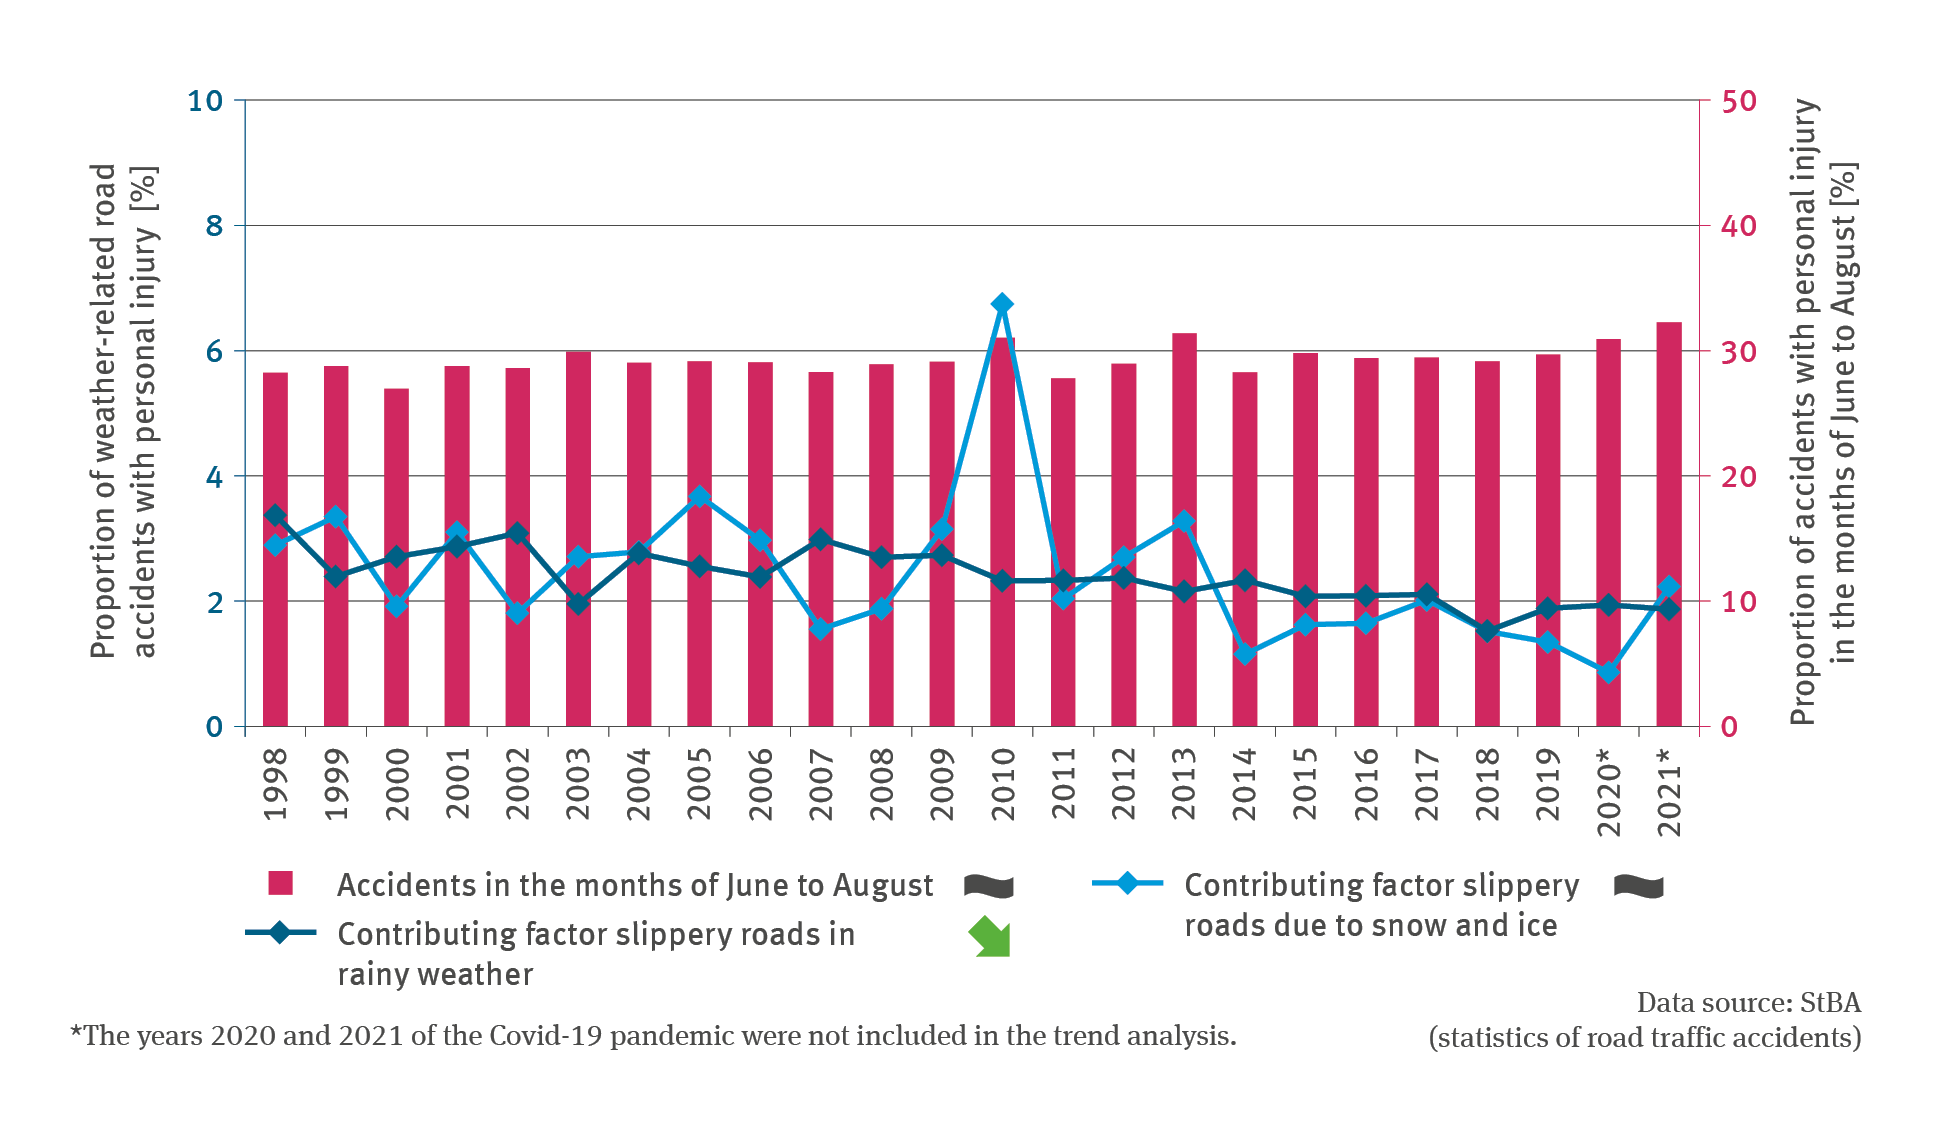
VE-I-4: Road accidents due to weather conditions and weather patterns
- Klima
- Verkehr
- Diagramme
Export data


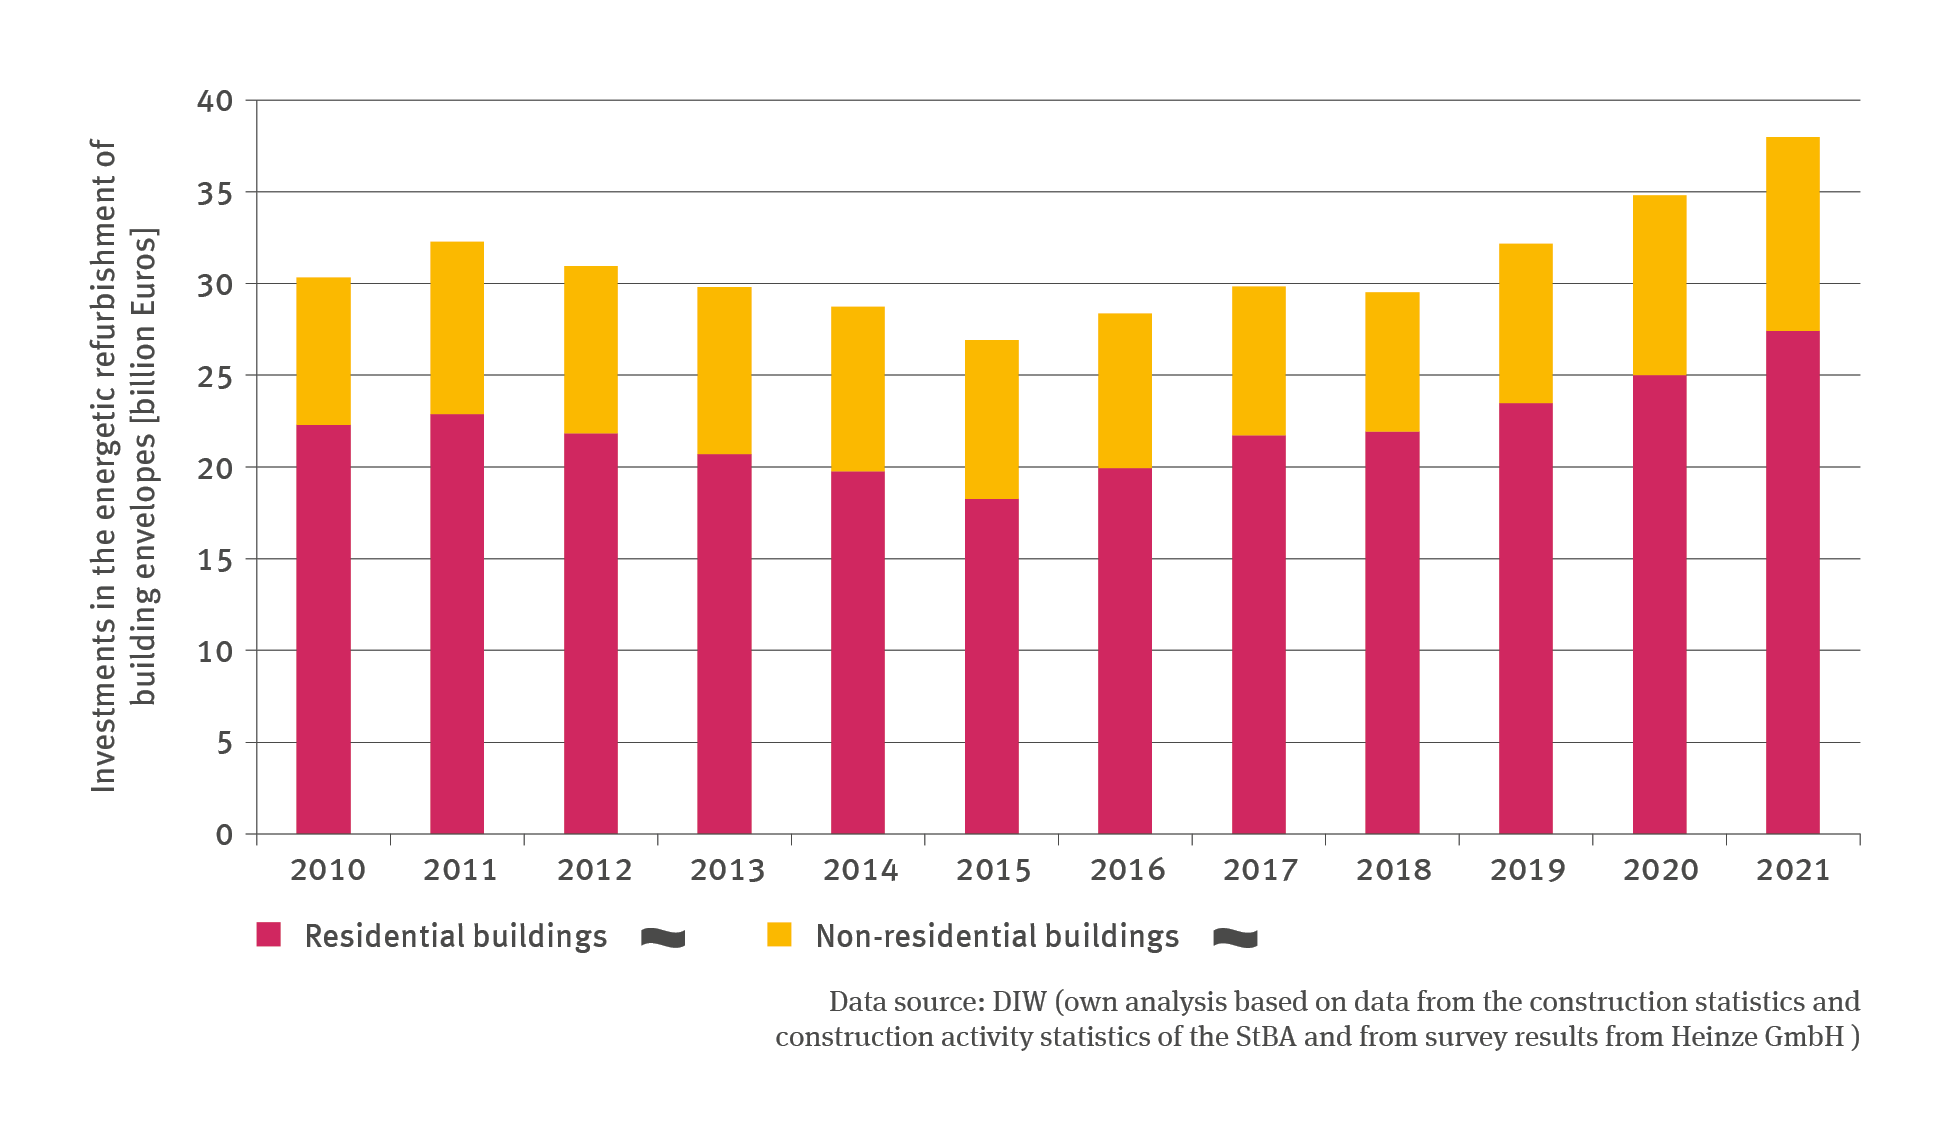
BAU-R-3: Investments in the energetic refurbishment of building envelopes
- Klima
- Energie
- Umwelt und Wirtschaft
- Diagramme
Export data


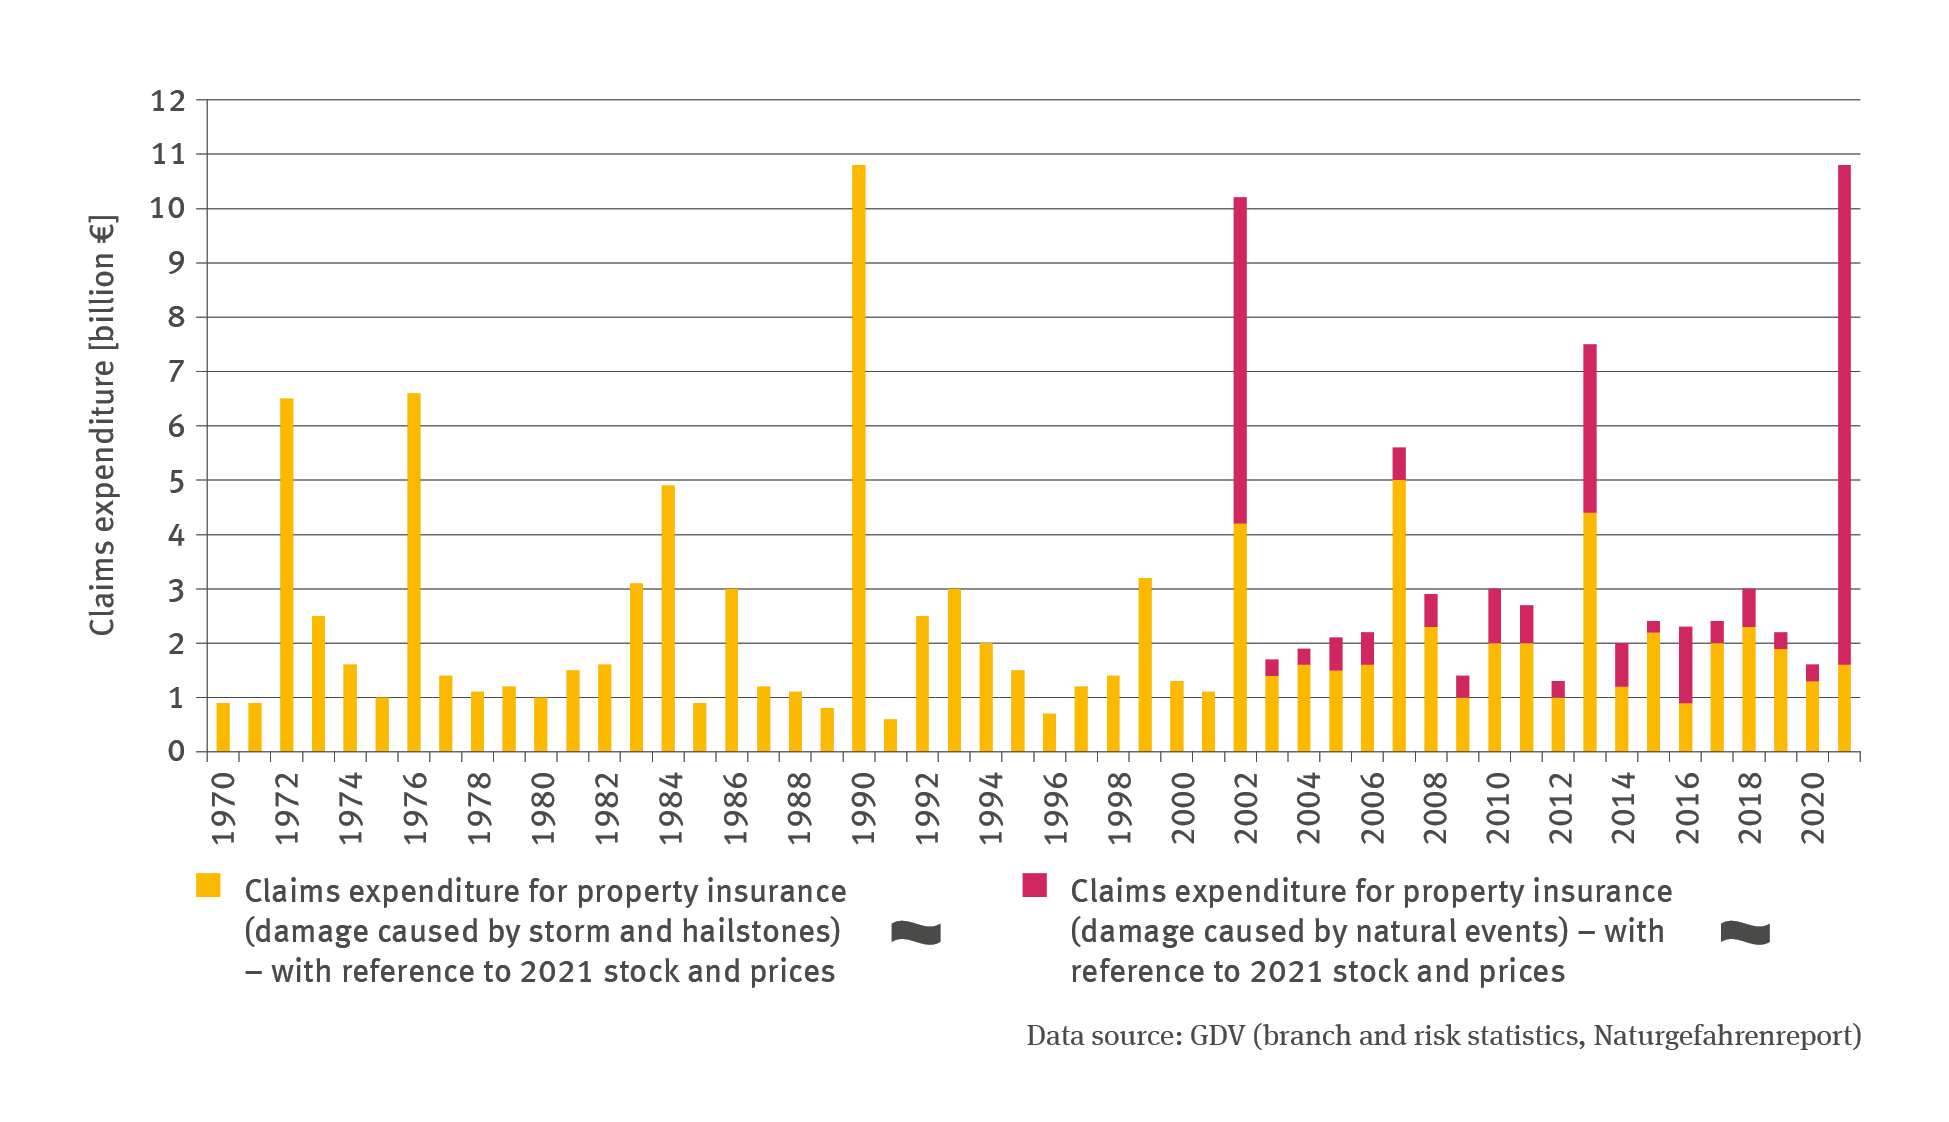
BAU-I-5: Claims expenditure for property insurance
- Klima
- Umwelt und Wirtschaft
- Diagramme
Export data
