Data Search

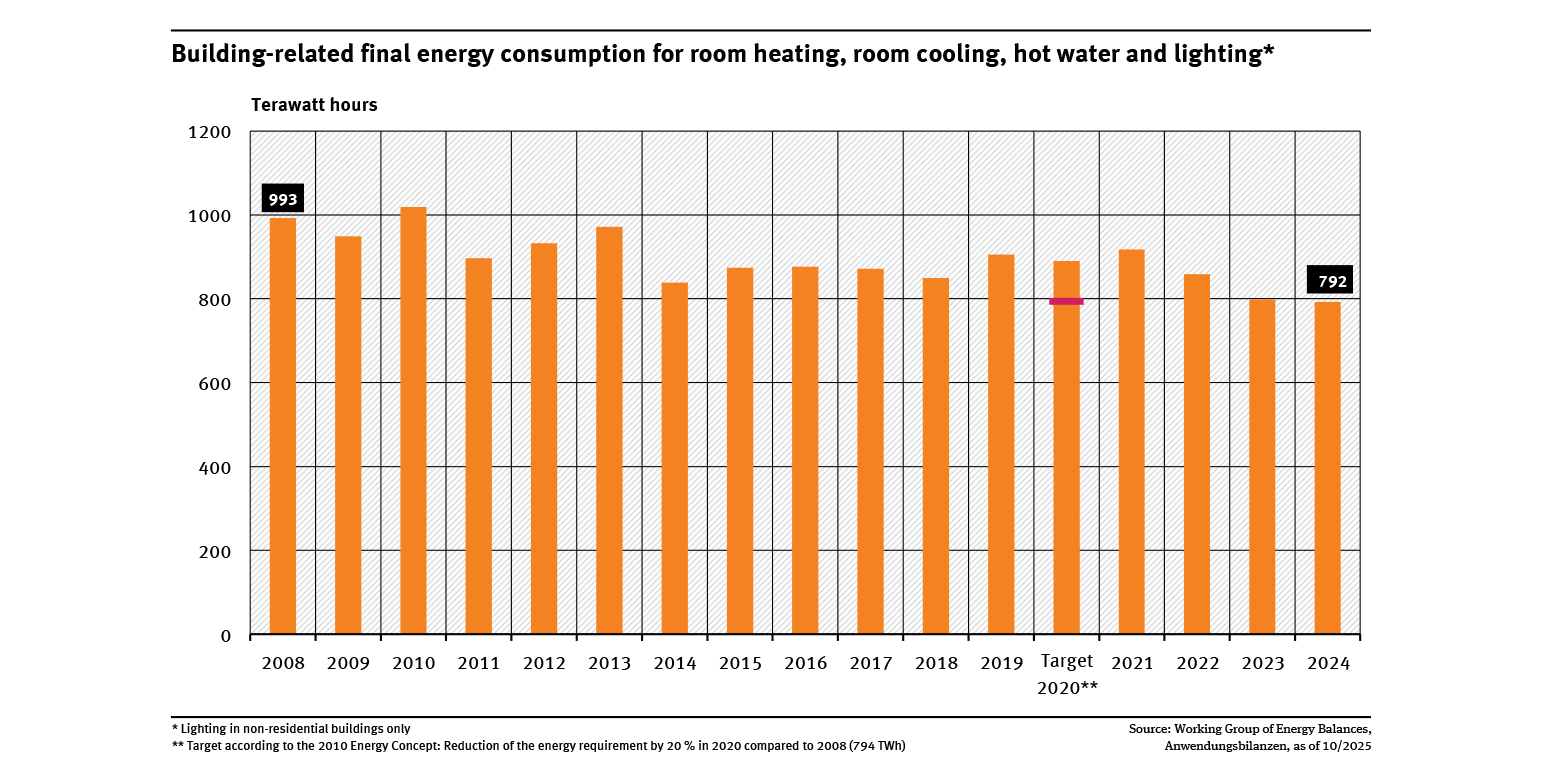
Building-related final energy consumption for room heating, room cooling, hot water and lighting
- Energie
- Diagramme
- Umwelt-Indikatoren
- Daten und Tabellen

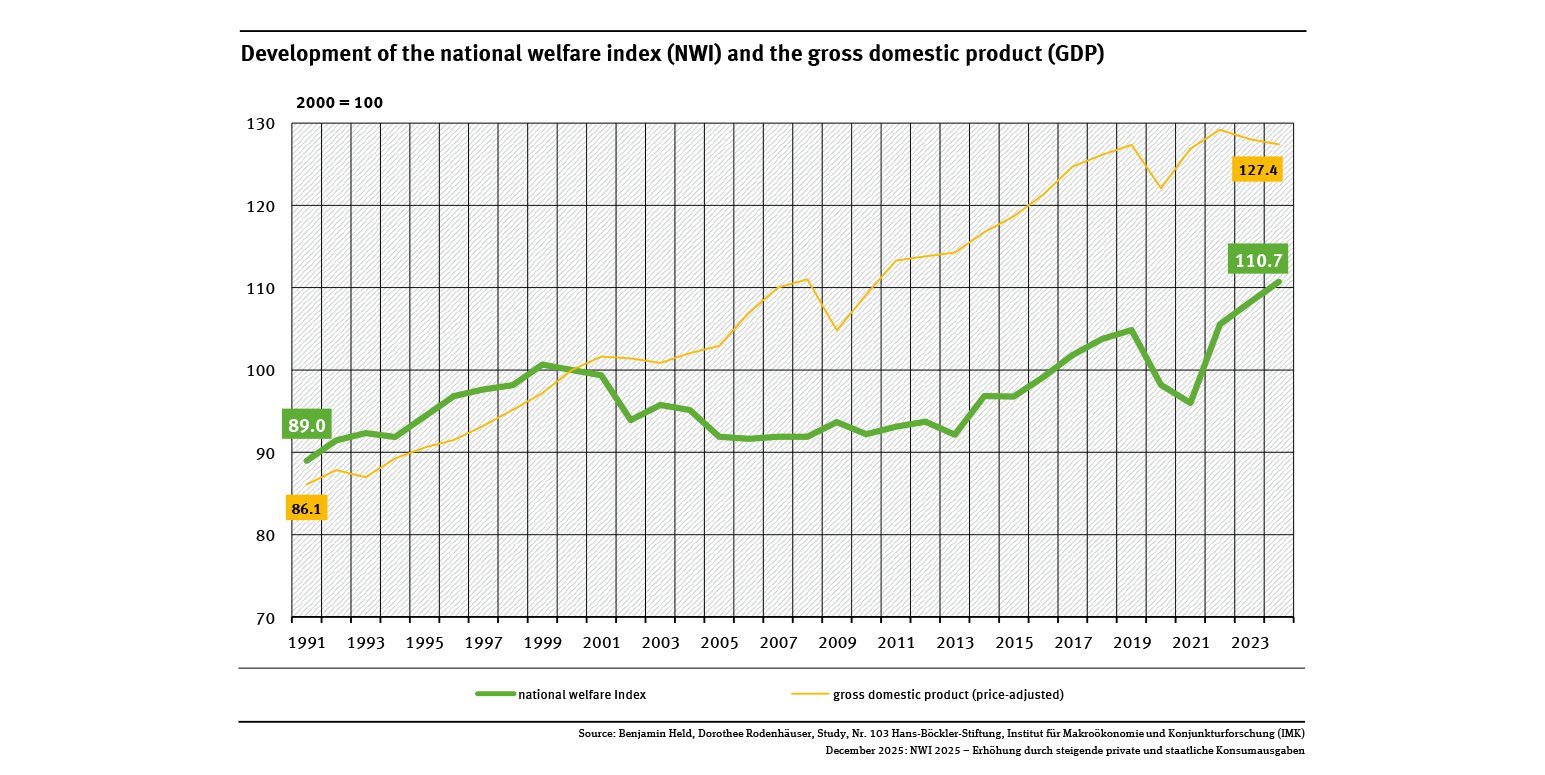
Development of the national welfare index (NWI) and the gross domestic product (GDP)
- Umwelt und Wirtschaft
- Diagramme
- Umwelt-Indikatoren
- Daten und Tabellen

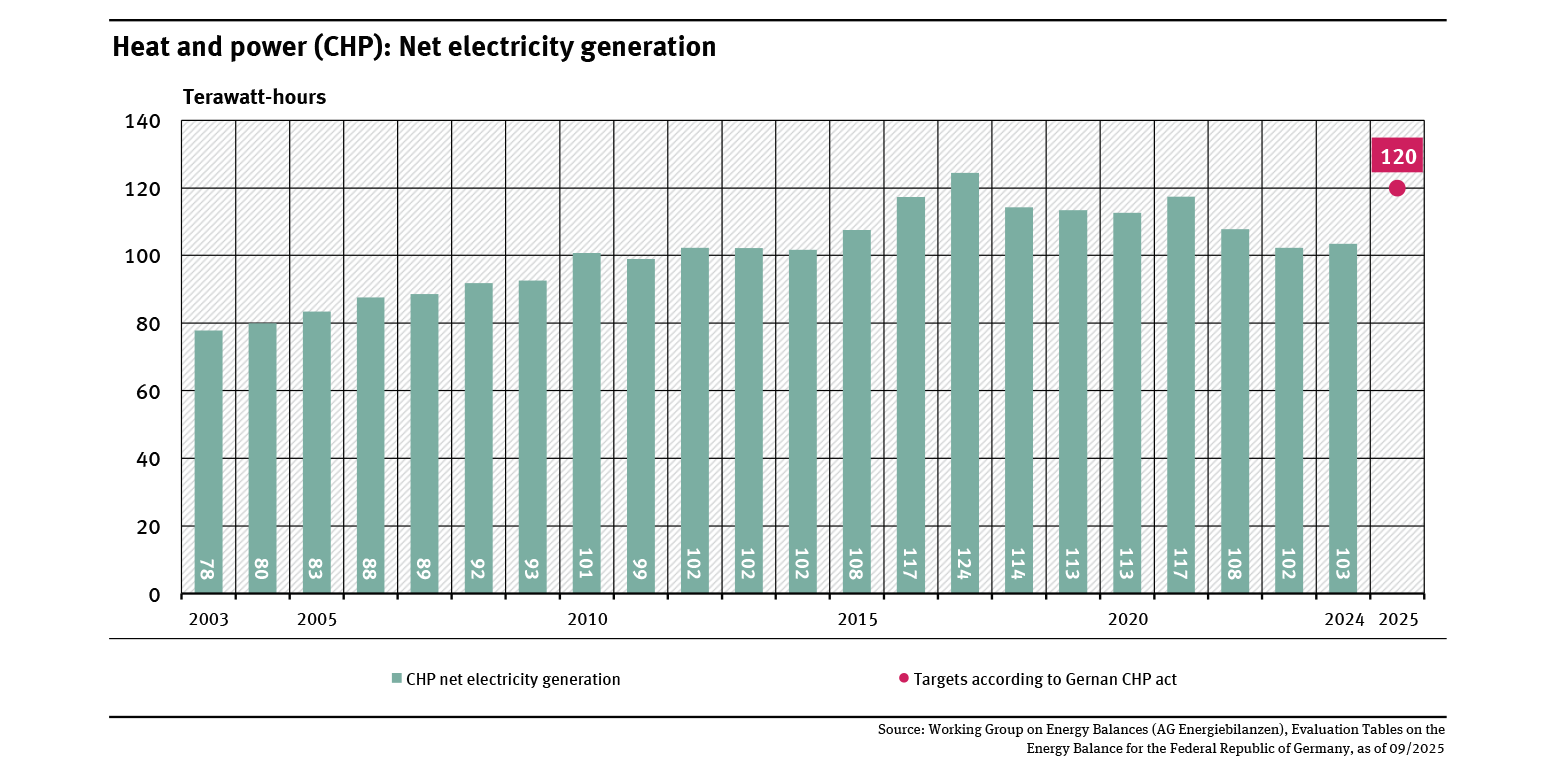
Heat and power (CHP): Net electricity generation
- Energie
- Diagramme
- Umwelt-Indikatoren
- Daten und Tabellen

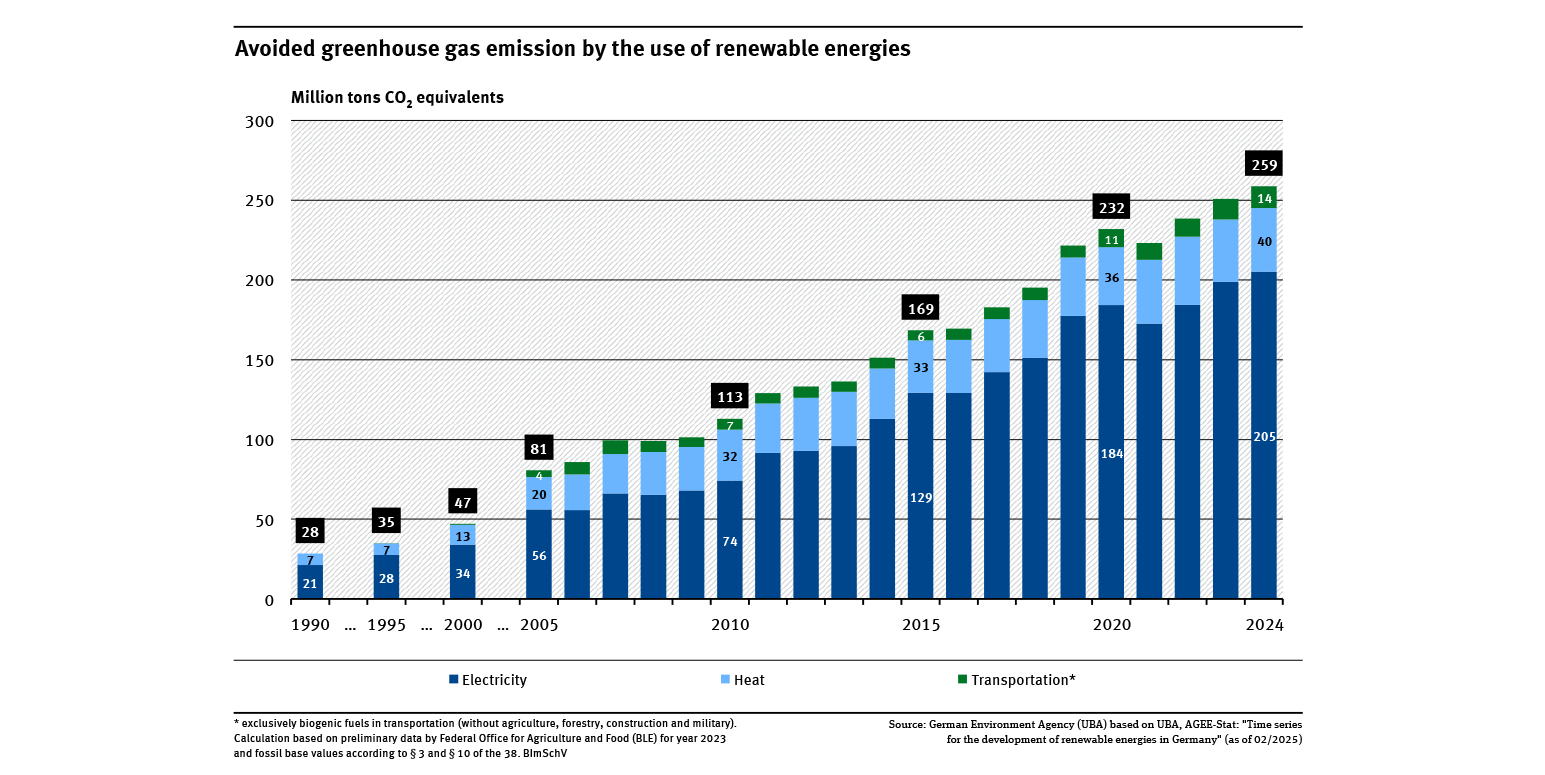
Greenhouse gas emissions avoided through the use of renewable energy sources
- Klima
- Energie
- Diagramme
- Umwelt-Indikatoren
- Daten und Tabellen

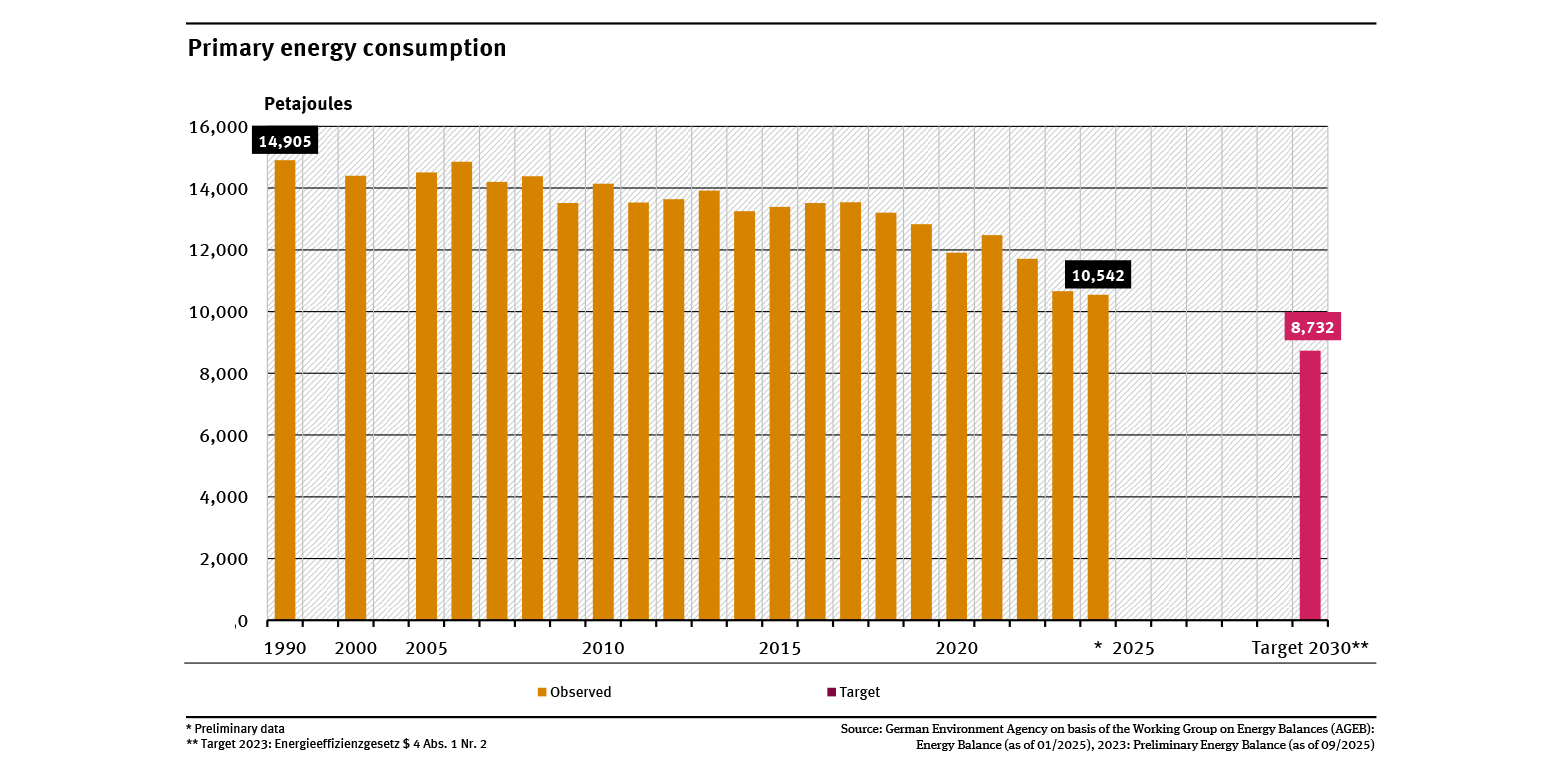
Development of primary energy consumption
- Energie
- Diagramme
- Umwelt-Indikatoren
- Daten und Tabellen

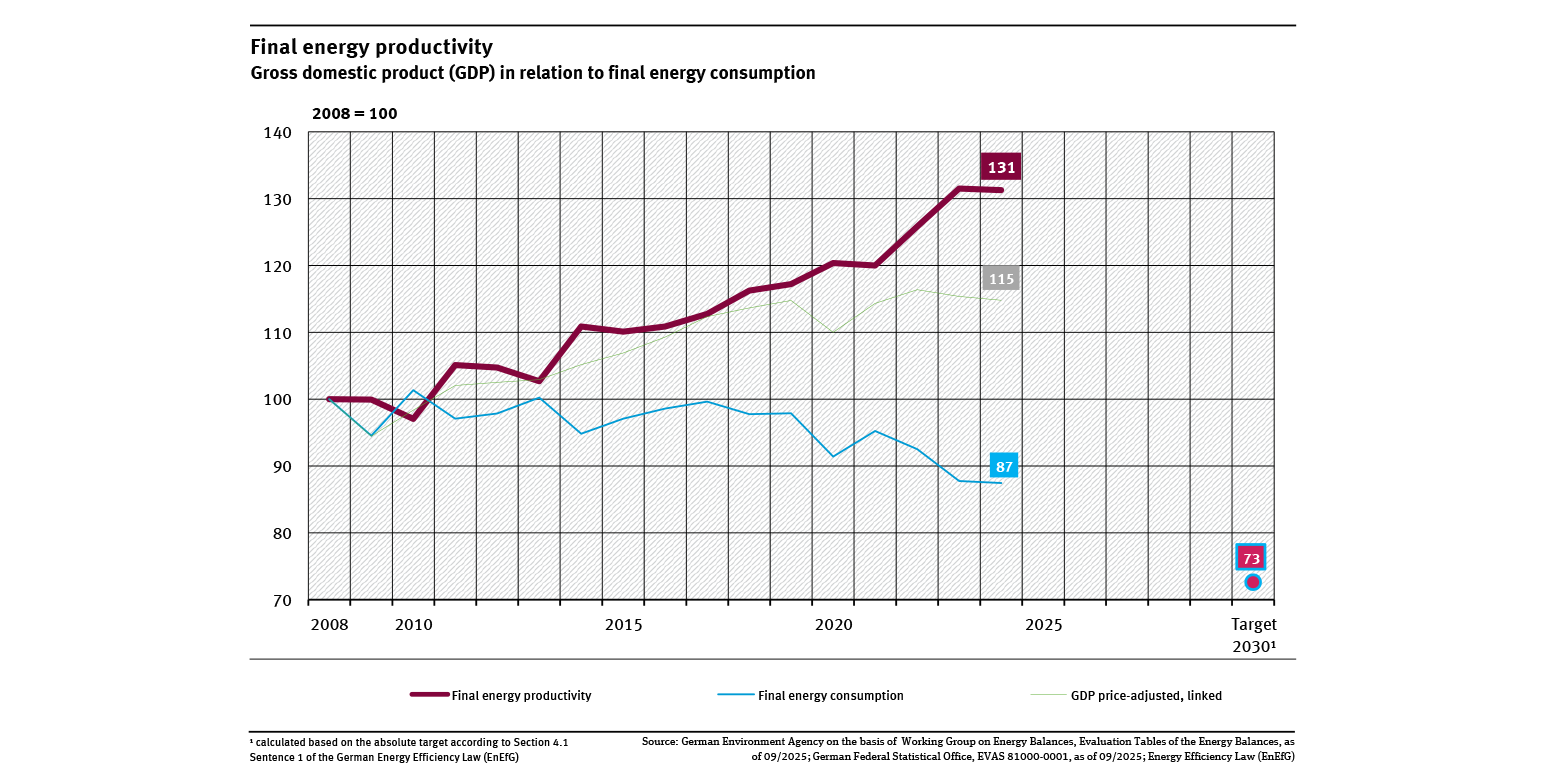
Final energy productivity
- Energie
- Diagramme
- Umwelt-Indikatoren
- Daten und Tabellen

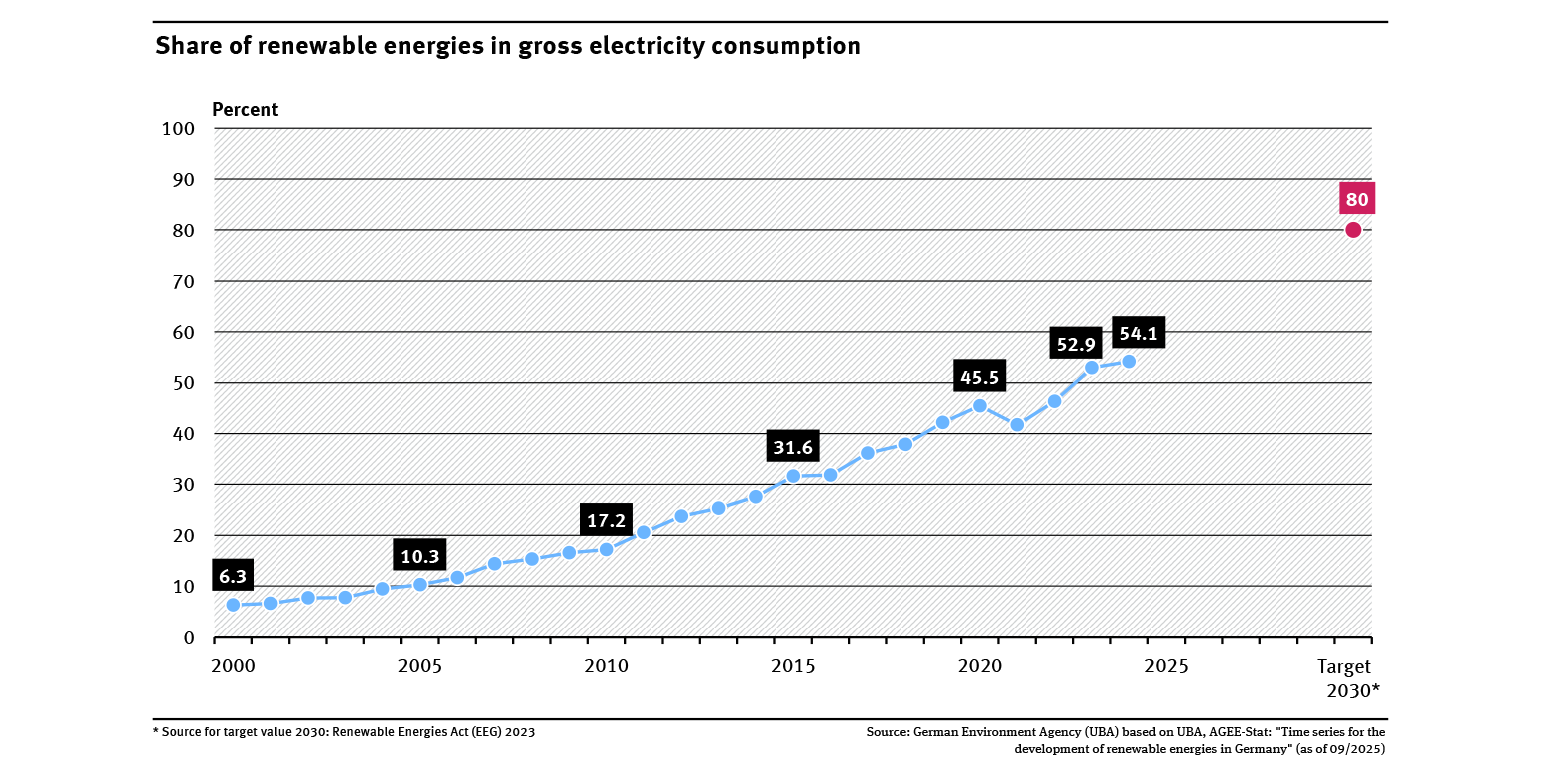
Share of renewable energies in gross electricity consumption
- Energie
- Diagramme
- Umwelt-Indikatoren
- Daten und Tabellen

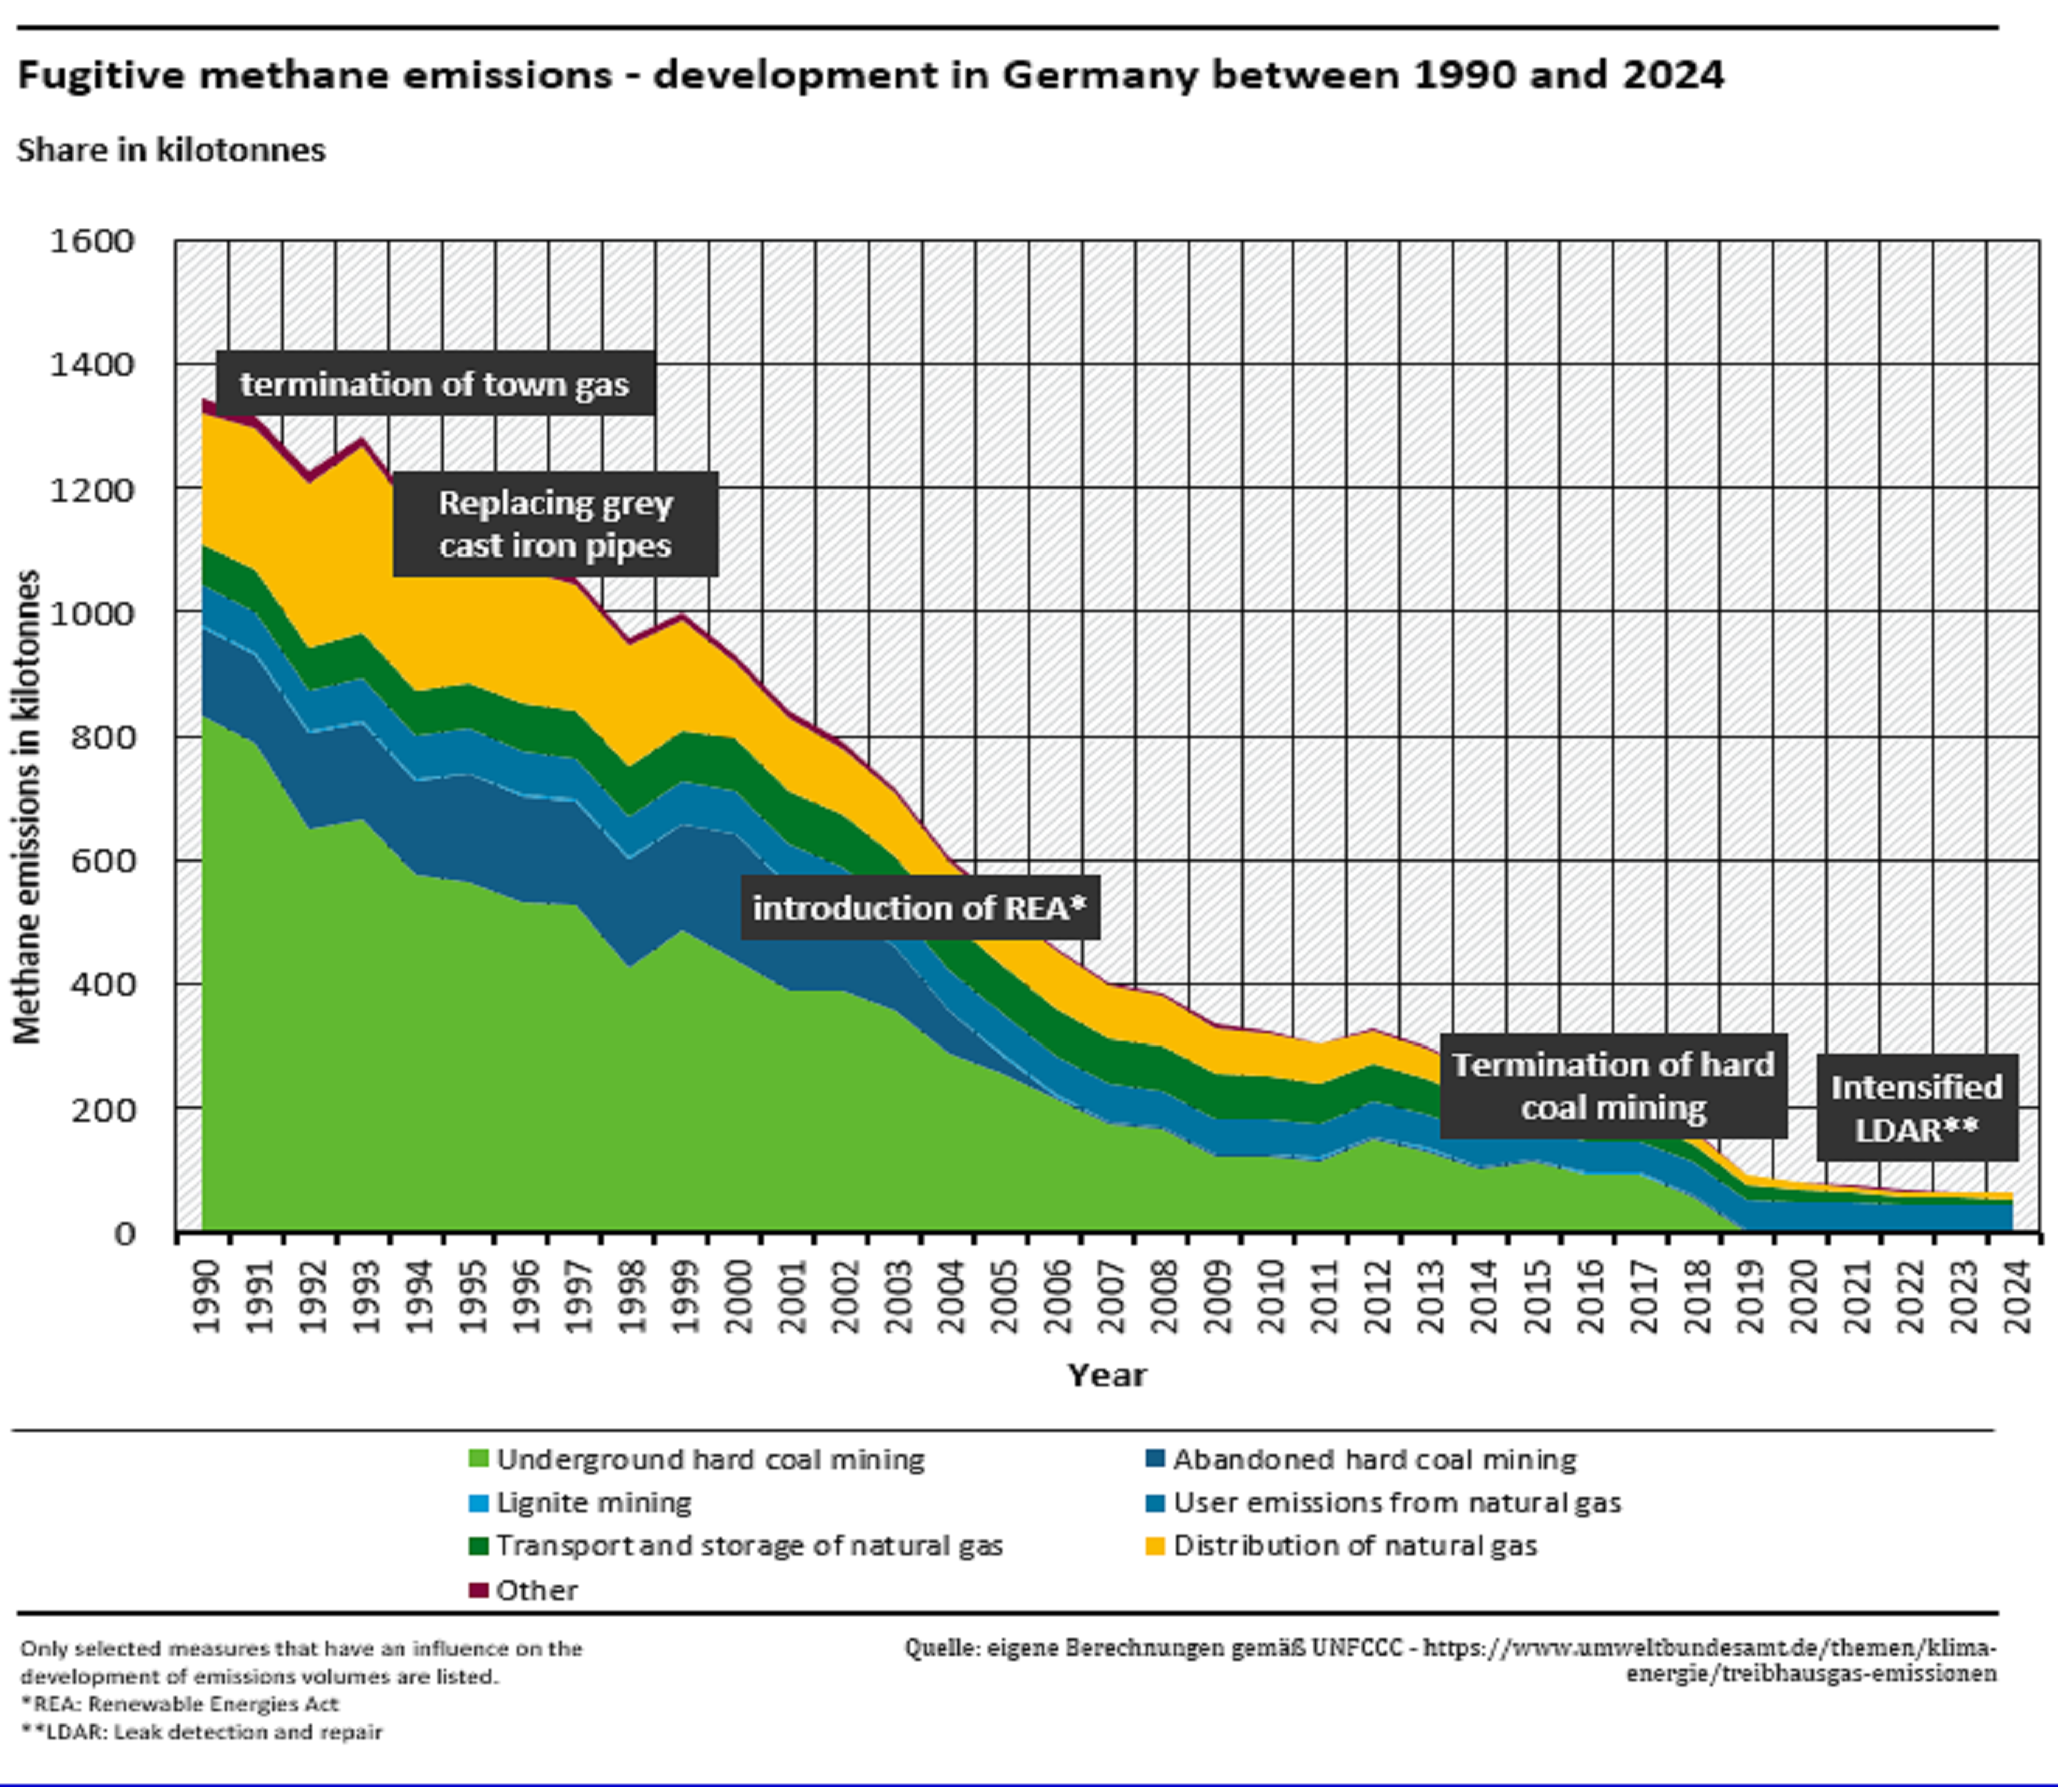
Fugitive methane emissions have fallen by 95 per cent since 1990
- Klima
- Diagramme

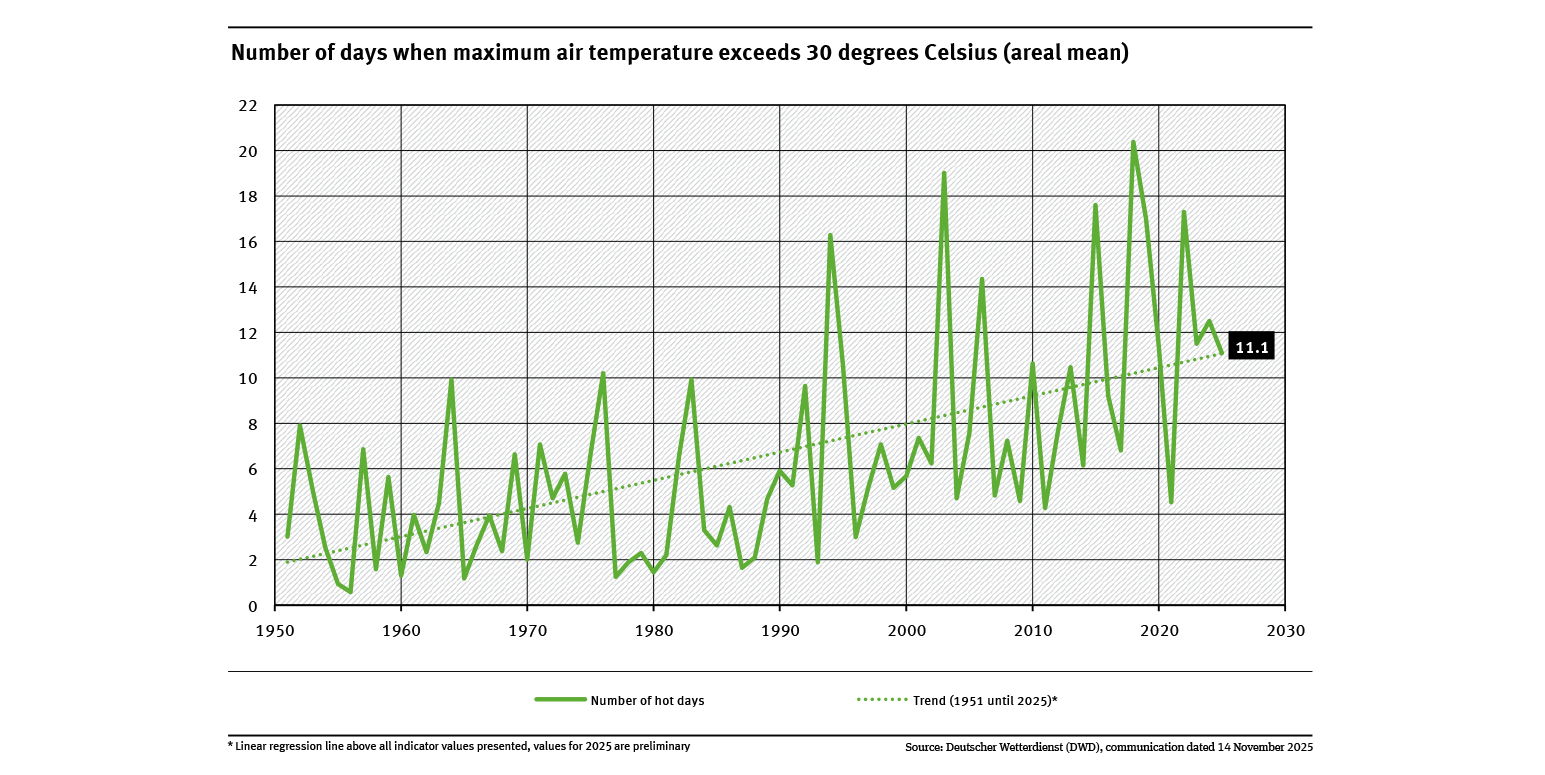
Number of days when maximum air temperature exceeds 30 degrees Celsius (areal mean)
- Klima
- Diagramme
- Umwelt-Indikatoren
- Daten und Tabellen

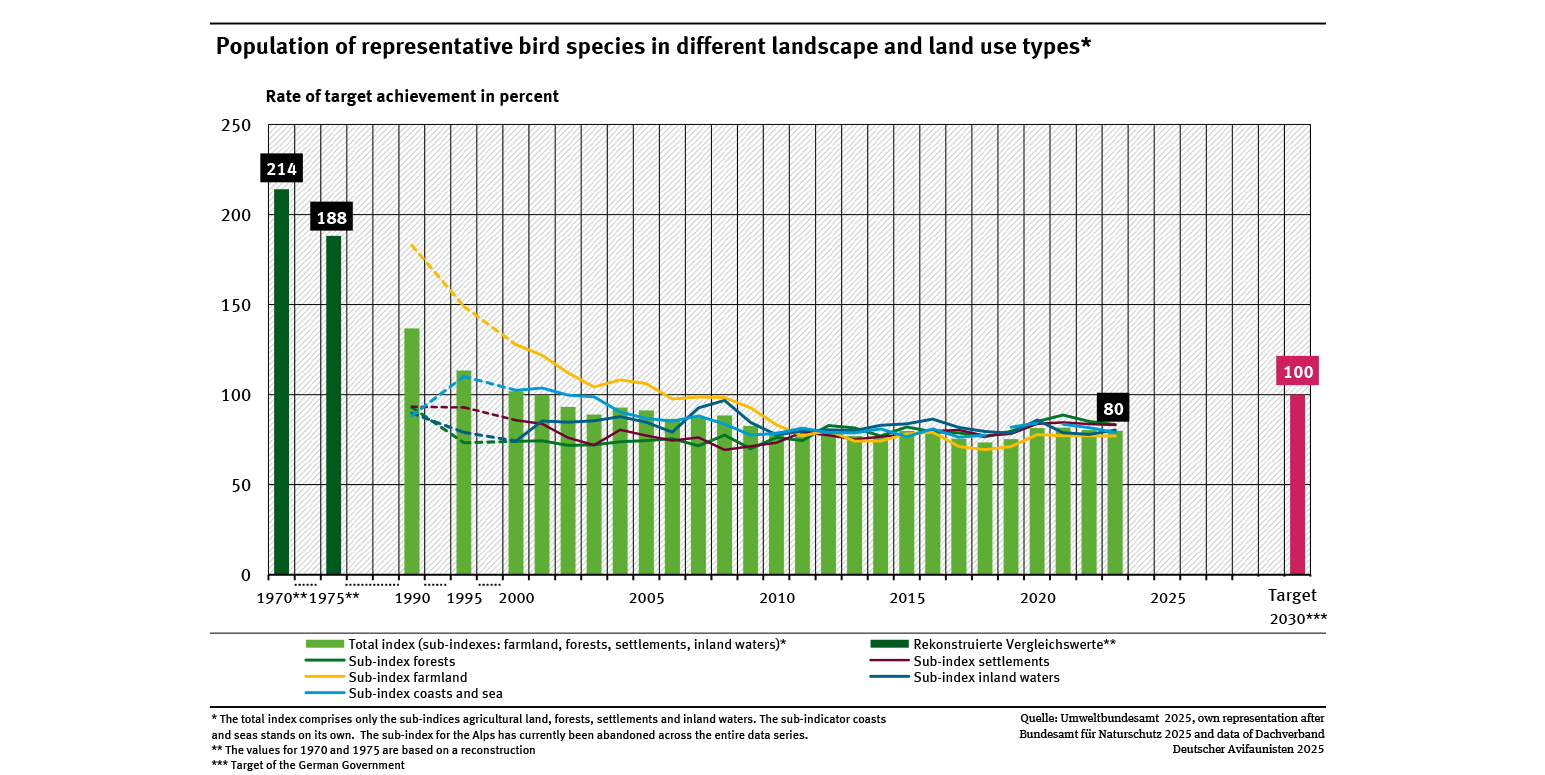
Population of representative bird species in different landscape and land use types
- Fläche, Boden, Land-Ökosysteme
- Diagramme
- Umwelt-Indikatoren
- Daten und Tabellen