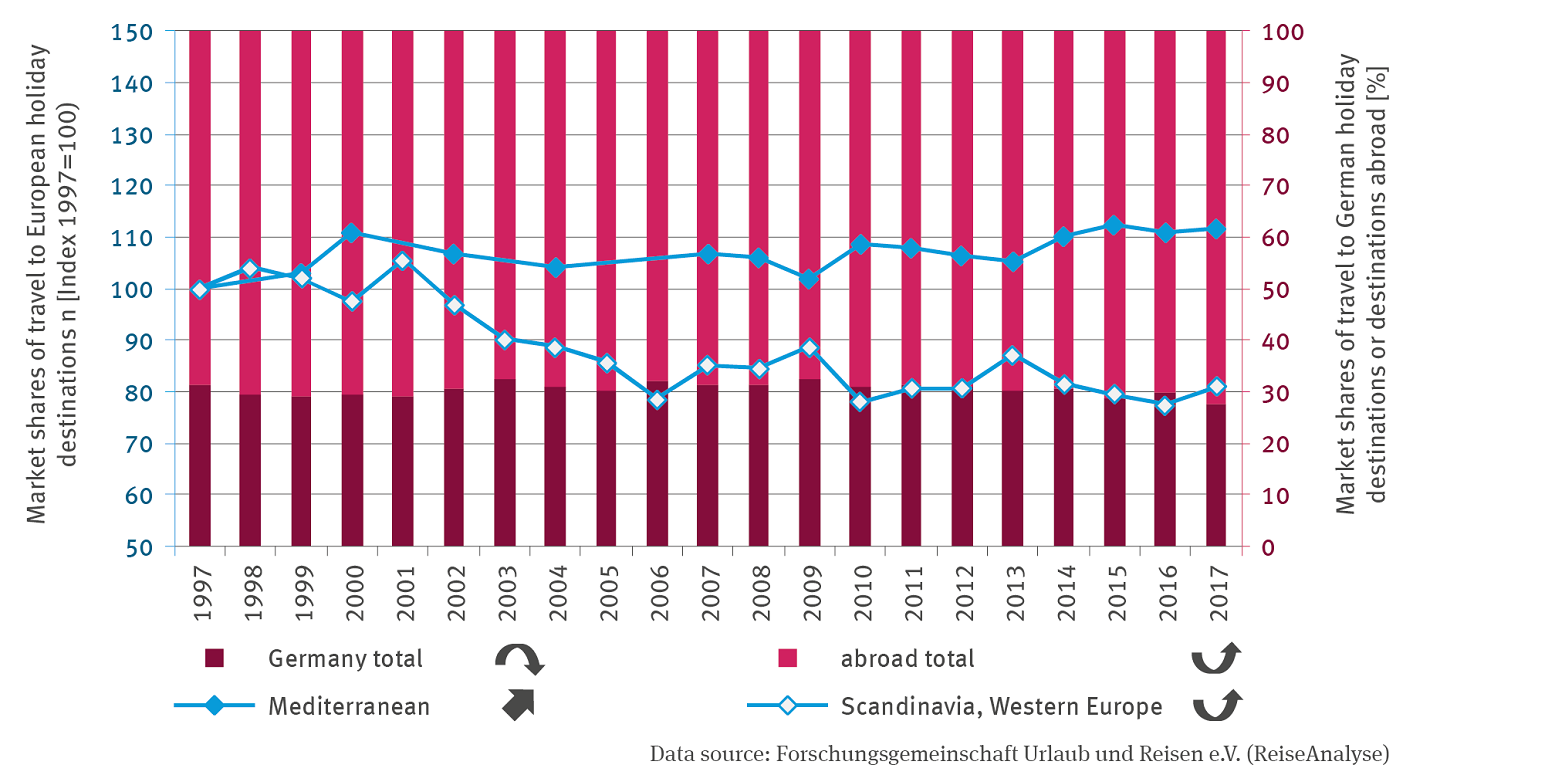
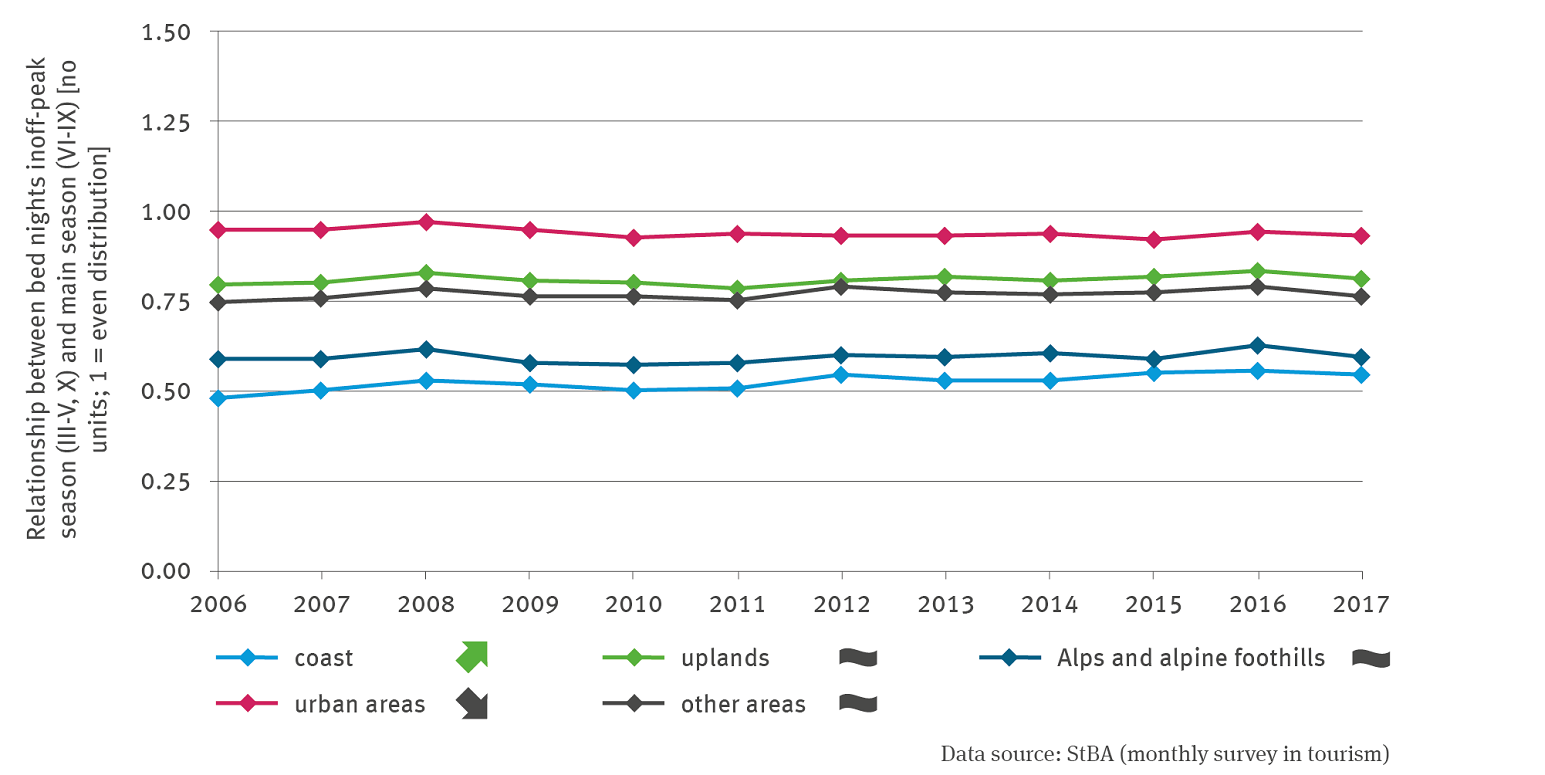
Data Search Data Search Here you will find diagrams, infographics, maps and tables for direct download. Data Search Data topics (-) Show all Klima (132) Energie (23) Luft (19) Fläche, Boden, Land-Ökosysteme (23) Wasser (36) Chemikalien (4) Umwelt und Gesundheit (23) Ressourcen und Abfall (9) Verkehr (16) Land- und Forstwirtschaft (32) Private Haushalte und Konsum (9) Umwelt und Wirtschaft (24) Data types (-) Show all Diagramme (189) Umwelt-Indikatoren (56) Infografiken (11) Karten (4) Daten und Tabellen (69) Refine your search Item language Show also German Reset The search resulted in 213 hits Sort by RelevanceChangedName Order AscDesc 08.12.2022 Lead in particulate matter - annual mean values 2007 - 2021 Luft Diagramme Export data PNG 08.12.2022 Arsenic in PM10 - annual mean values 2007 - 2021 Luft Diagramme Export data PNG 08.03.2022 Commenting table public consultation Chemikalien Export data application/vnd.openxmlformats-officedocument.wordprocessingml.document 05.01.2022 Figure 2: Map of worldwide distribution of publications reporting MECs Chemikalien Karten Export data JPG 05.01.2022 Figure 1: Map of worldwide distribution of MECs Chemikalien Karten Export data JPG 08.09.2021 EW-R-4: Water efficiency of thermal power plants Klima Energie Diagramme Export data PNG 08.09.2021 BAU-I-2: Summer-related heat island effect – case study Klima Diagramme Export data PNG 16.08.2021 FiW-I-2: Incidence of storms and floods Klima Umwelt und Wirtschaft Diagramme Export data PNG 16.08.2021 TOU-I-7: Holiday destination preferences Klima Private Haushalte und Konsum Diagramme Export data PNG 16.08.2021 TOU-I-6: Seasonal bed nights in German tourist areas Klima Private Haushalte und Konsum Diagramme Export data PNG First page « Previous page ‹ … Page 14 Page 15 Page 16 Page 17 Current page 18 Page 19 Page 20 Page 21 Page 22 of 22 Next page › Last page » You can also search in other data portals of the German Environment Agency Rigoletto


