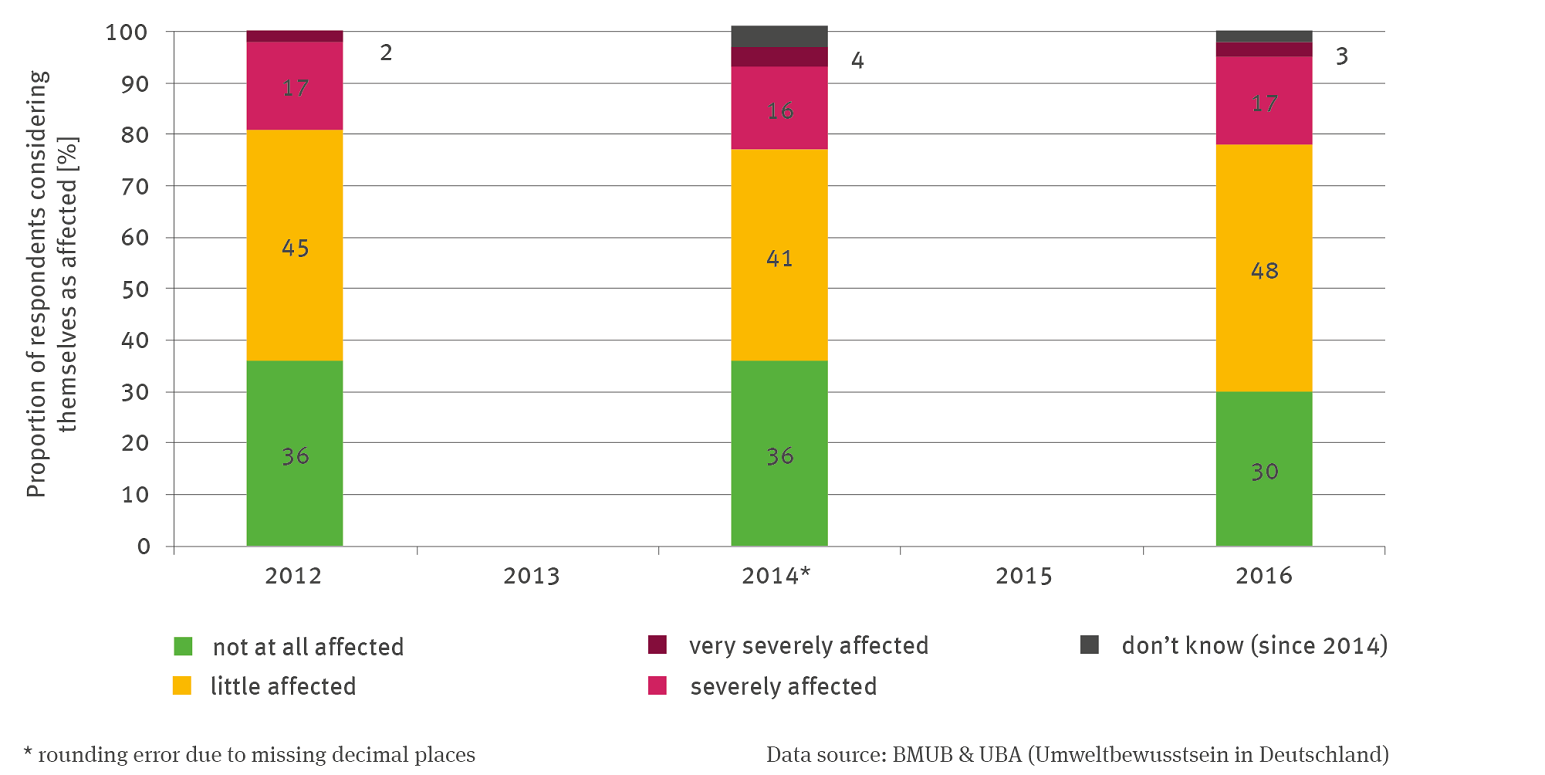
Three stacking columns represent the assessment of being affected by storms and floods for the years 2012, 2014 and 2016. The percentage of respondents is read below for the respective categories with ascending year: not affected at all: 36, 36 and 30 percent; less affected: 45, 41 and 48 percent, strongly affected: 17, 16 and 17 percent, very strongly affected: 2, 4 and 3. From 2014 onwards, there is also the category don't know.
Source: BMUB & UBA (Umweltbewusstsein in Deutschland)
Download image (105.63 kB)