Data Search

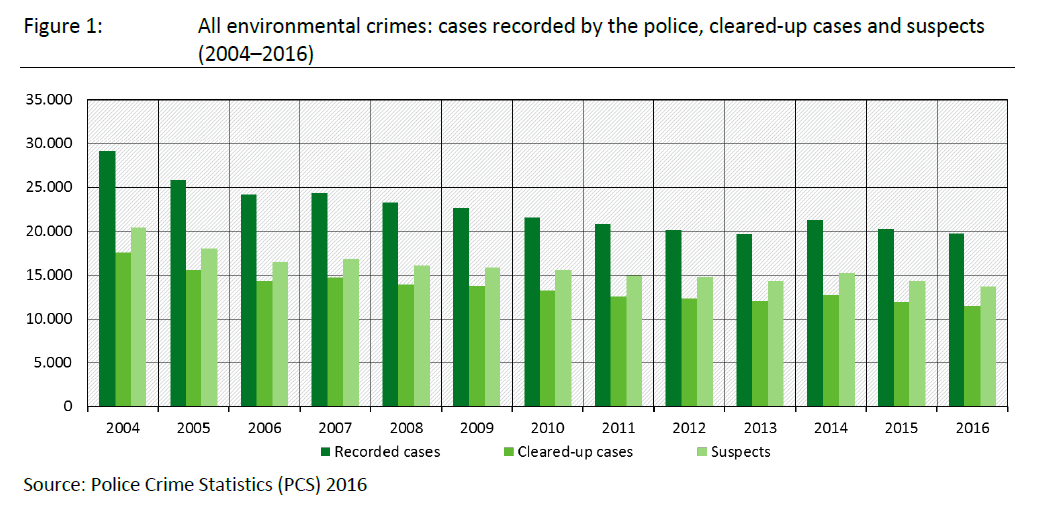
All environmental crimes: cases recorded by the police, cleared-up cases and suspects (2004-2016)
- Umwelt und Wirtschaft
- Diagramme
- Daten und Tabellen
Export data

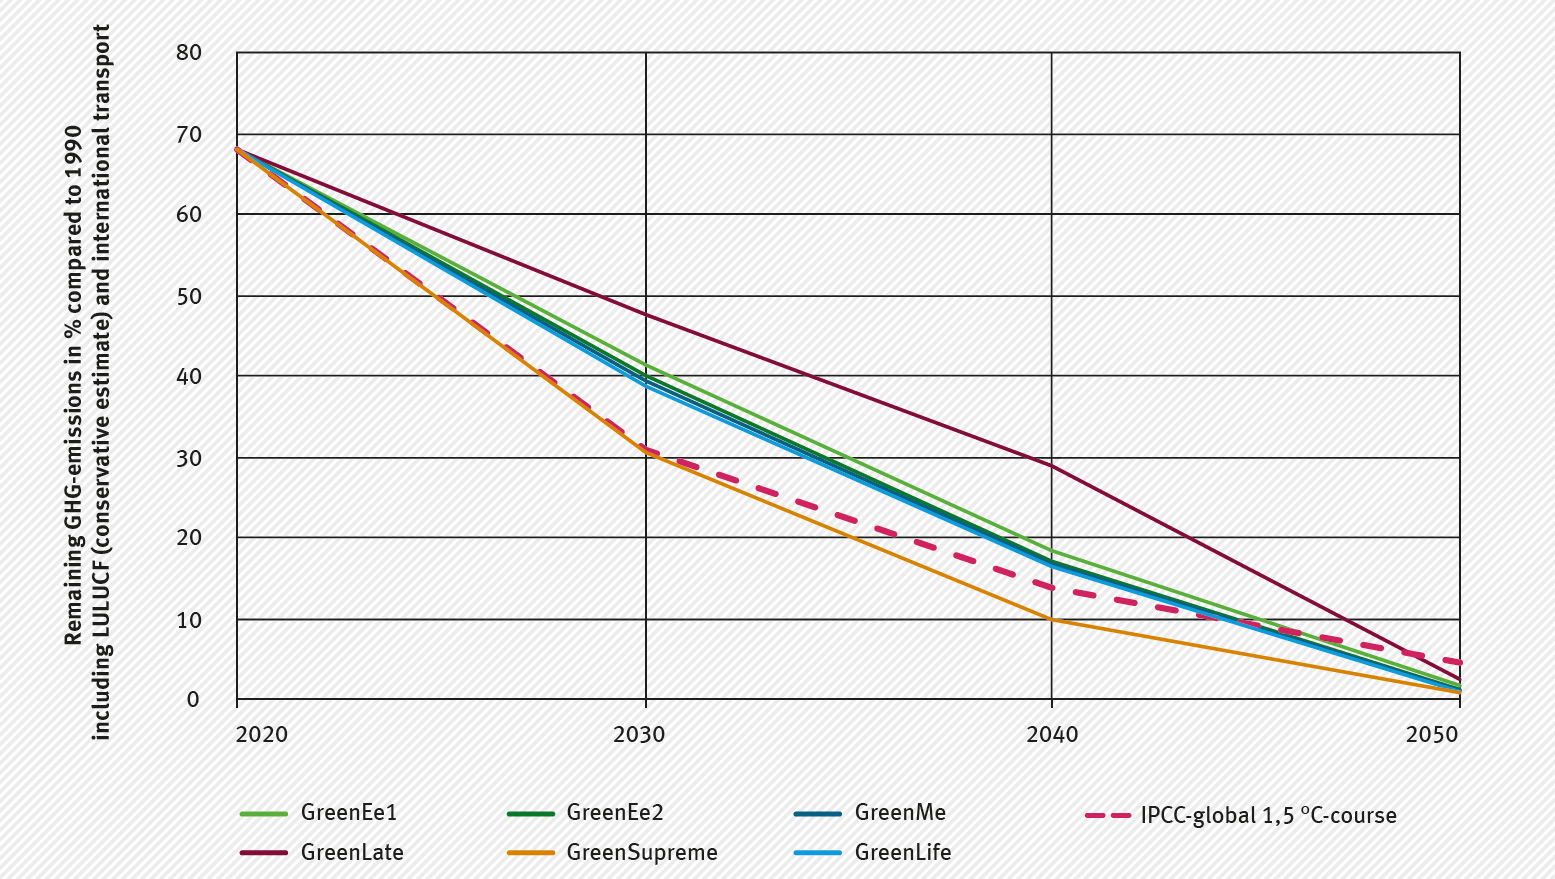
National trend tables for greenhouse gas emissions by sectors 1990 - 2018 and previous year´s estimate 2019
- Klima
- Daten und Tabellen
Export data

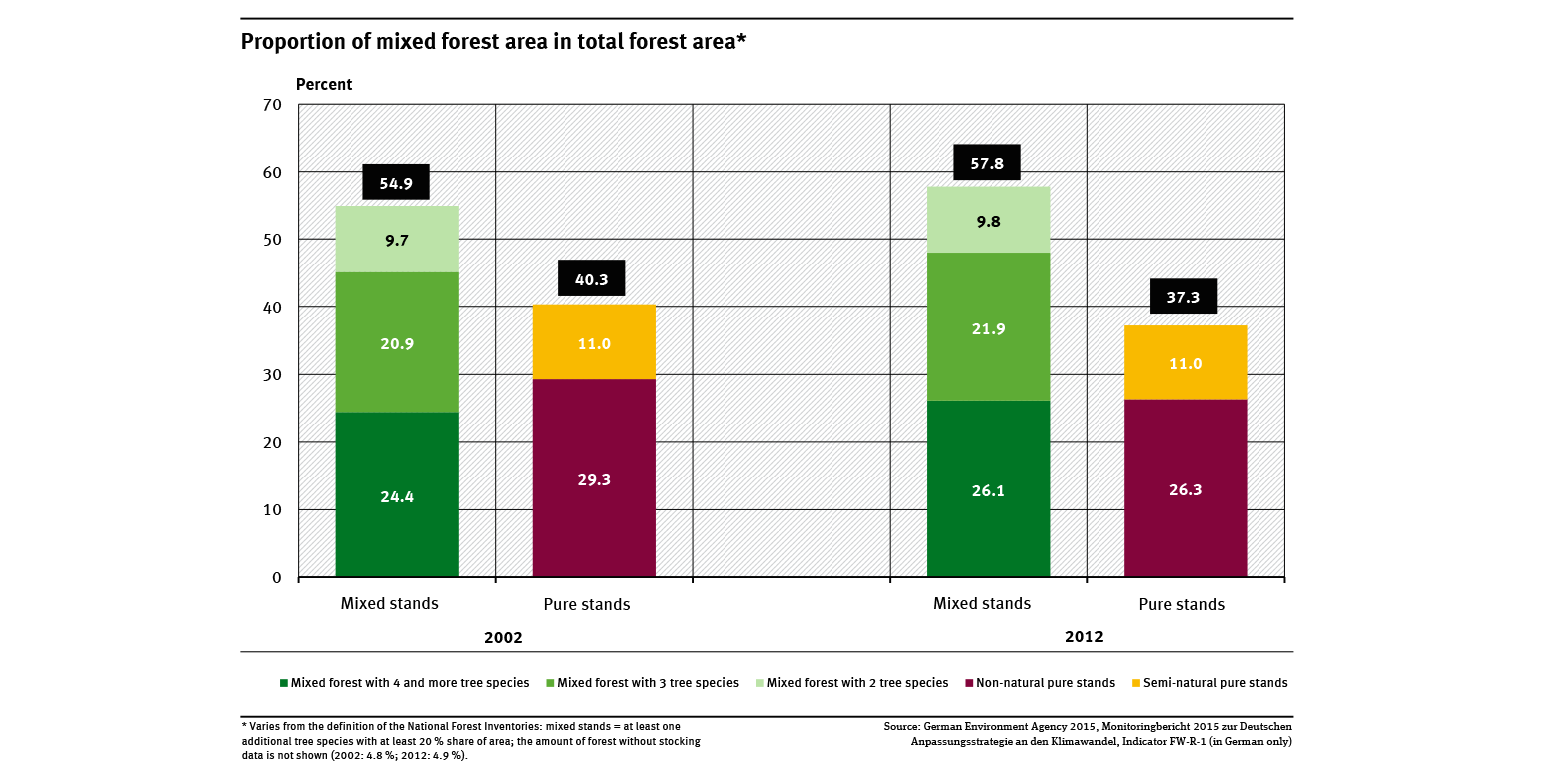
Proportion of mixed forest area in total forest area
- Land- und Forstwirtschaft
- Diagramme
- Umwelt-Indikatoren
- Daten und Tabellen

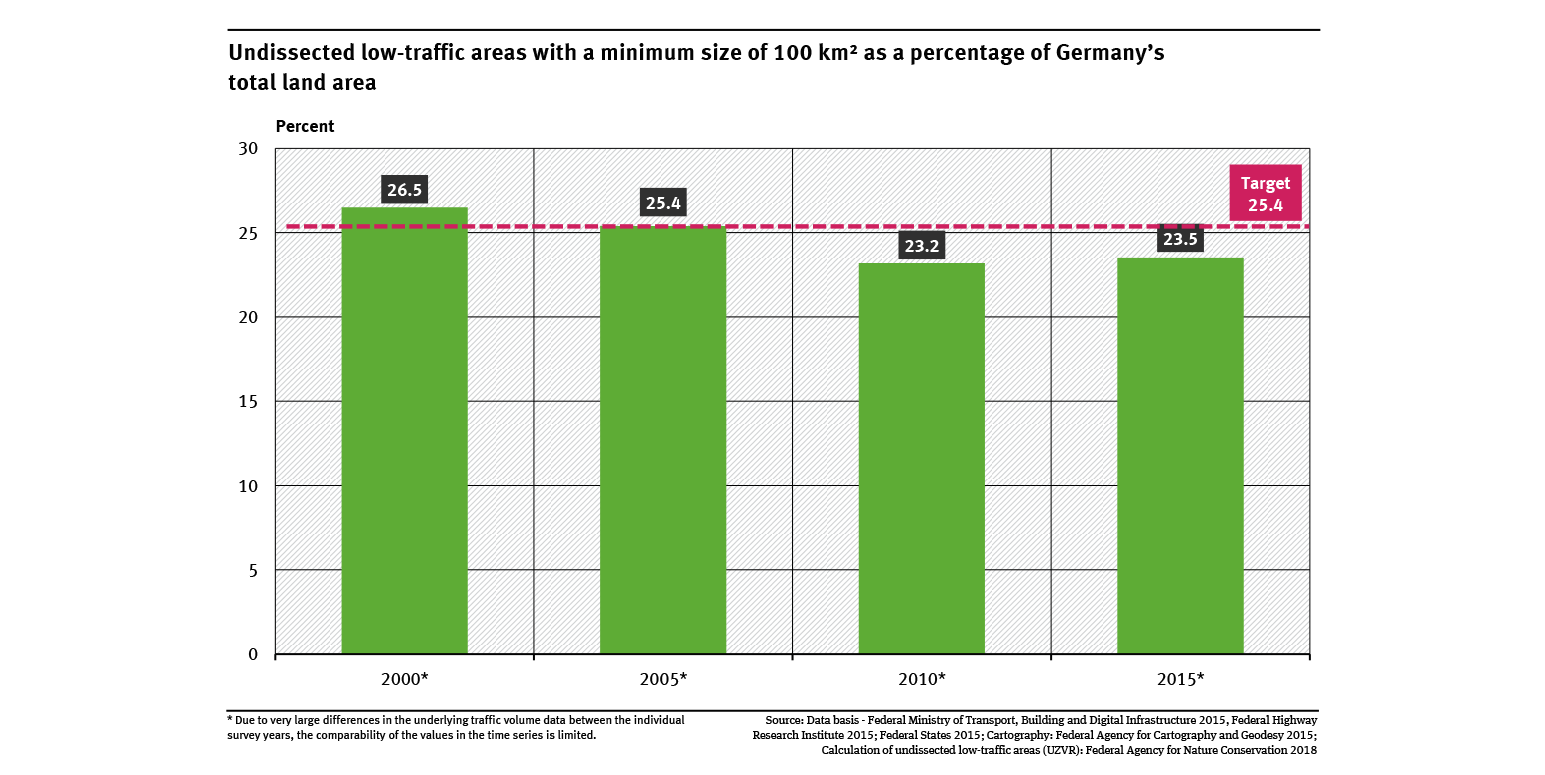
Undissected low-traffic areas with a minimum size of 100 km² as a percentage of Germany’s ...
- Fläche, Boden, Land-Ökosysteme
- Diagramme
- Umwelt-Indikatoren
- Daten und Tabellen

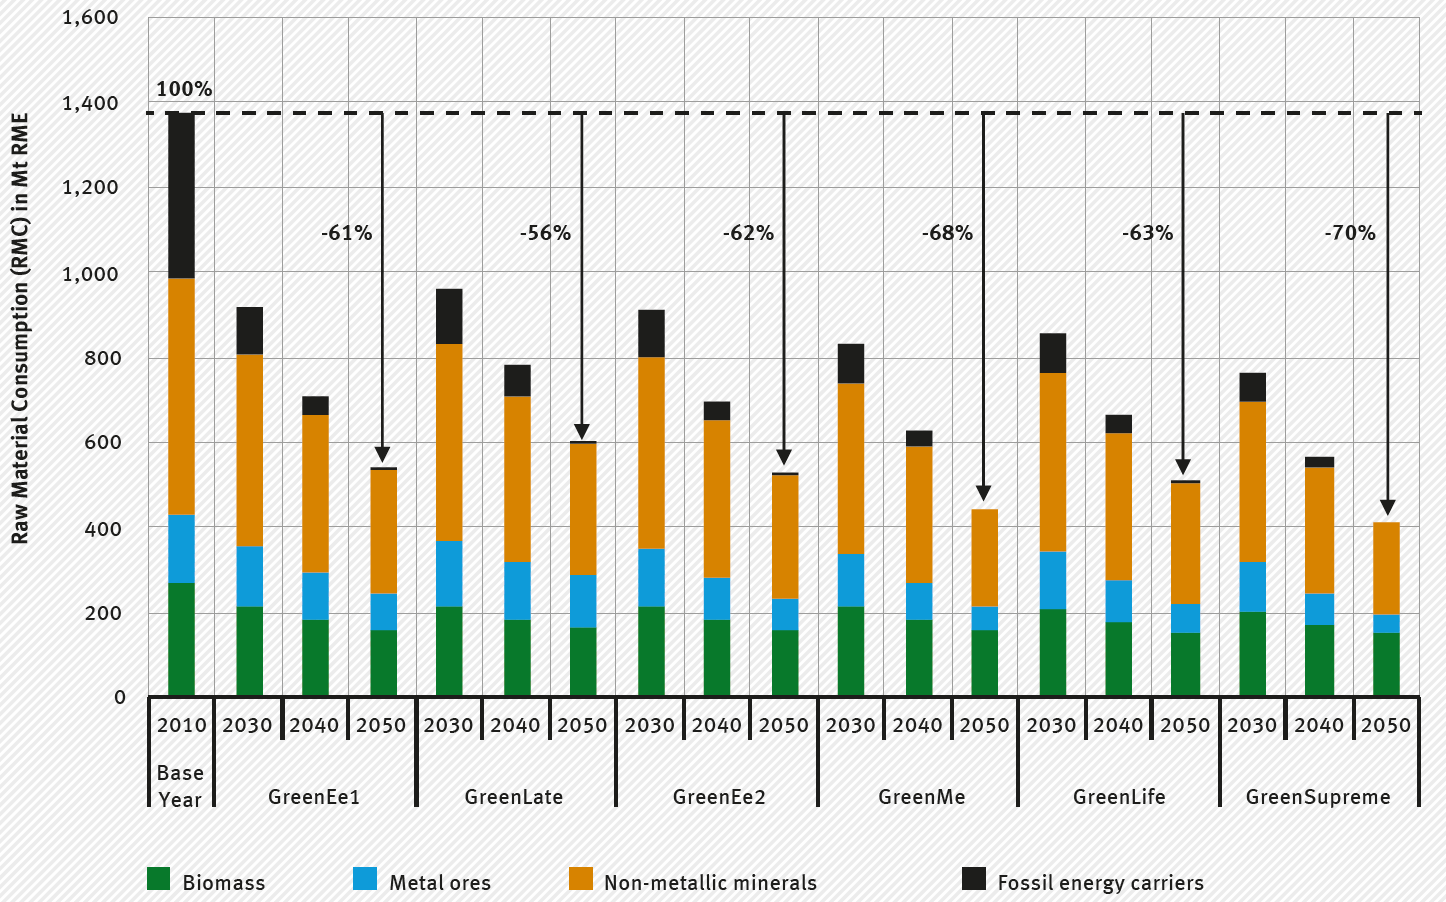
The raw material consumption (RMC) for the six Green-scenarios of the RESCUE study.
- Klima
- Ressourcen und Abfall
- Diagramme
Export data

Export data


