Data Search


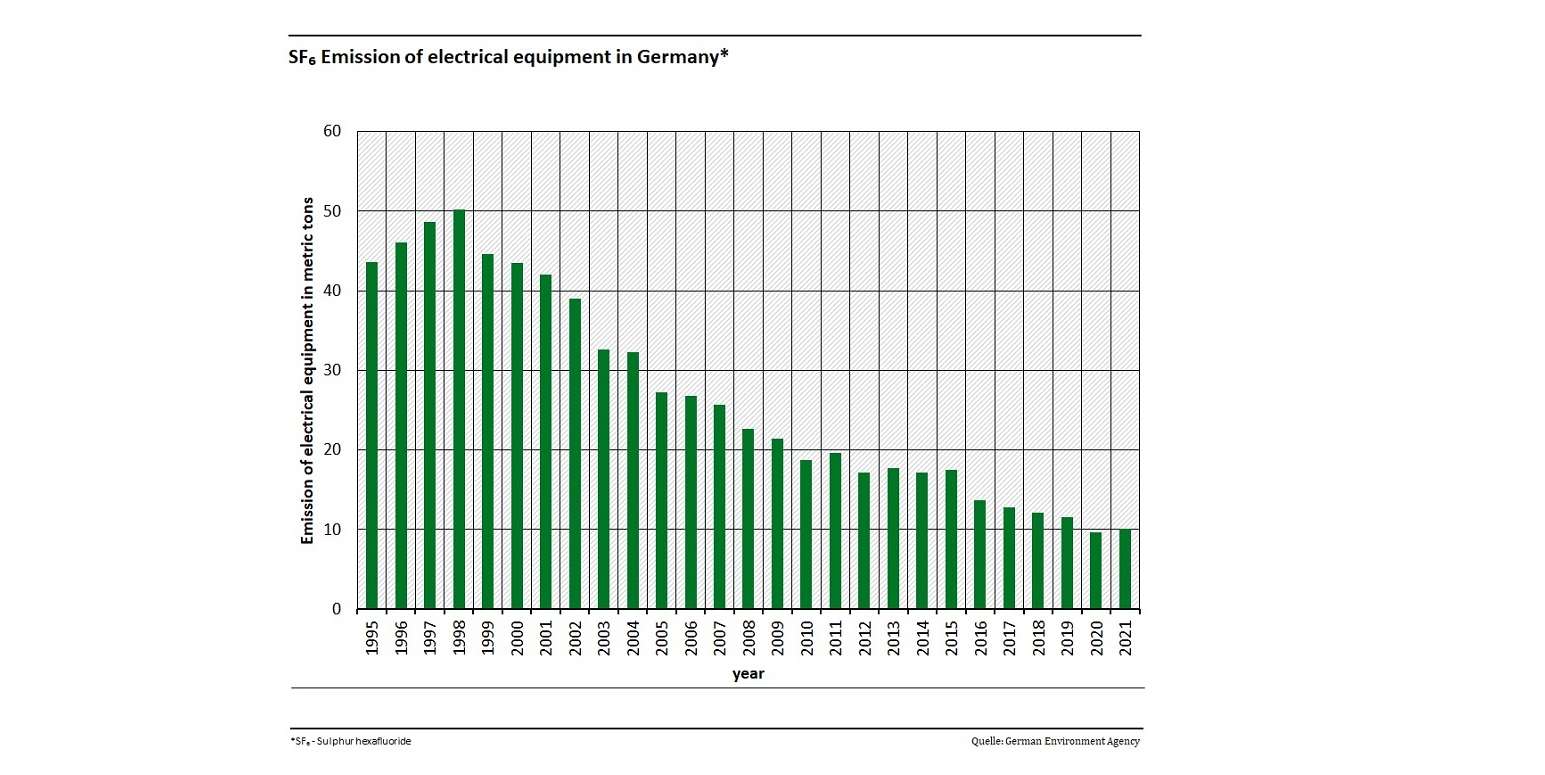
Emissions of electrical equipment in Germany
- Klima
- Energie
- Umwelt und Wirtschaft
- Diagramme
Export data

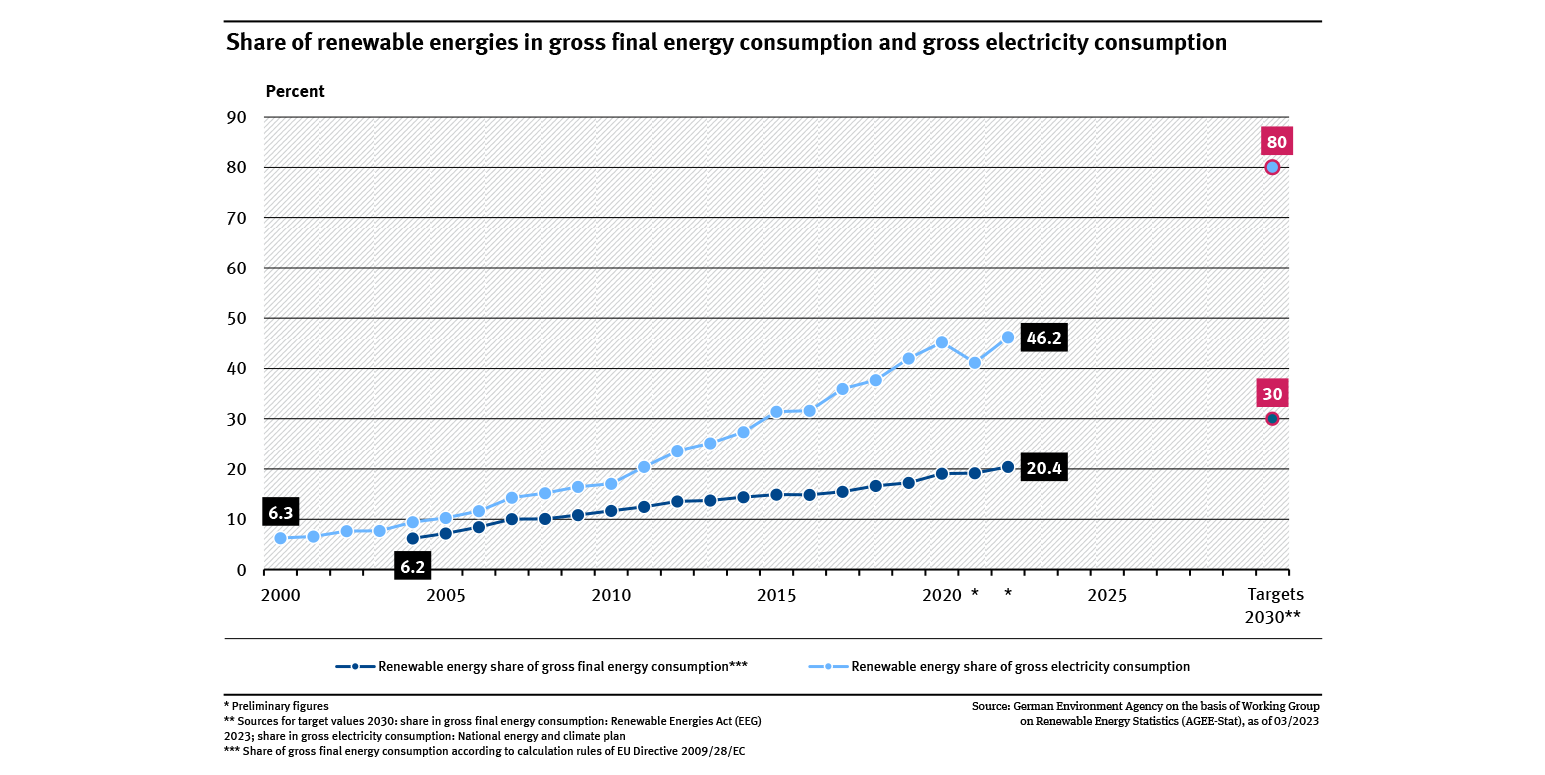
Renewable energy share in gross final energy consumption and gross electricity consumption
- Energie
- Diagramme
- Umwelt-Indikatoren
- Daten und Tabellen

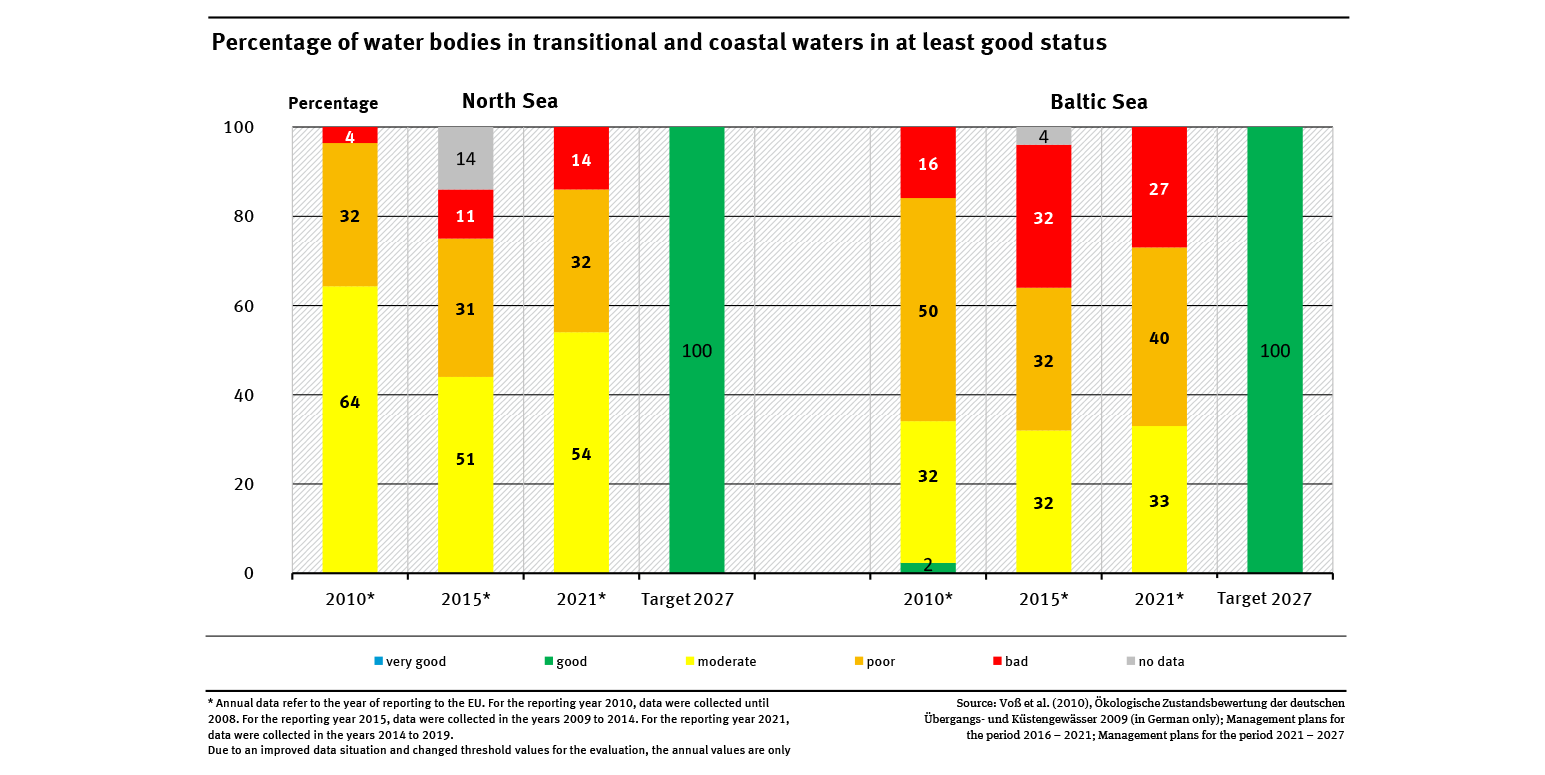
Percentage of water bodies in transitional and coastal waters in at least good status
- Wasser
- Diagramme
- Umwelt-Indikatoren
- Daten und Tabellen

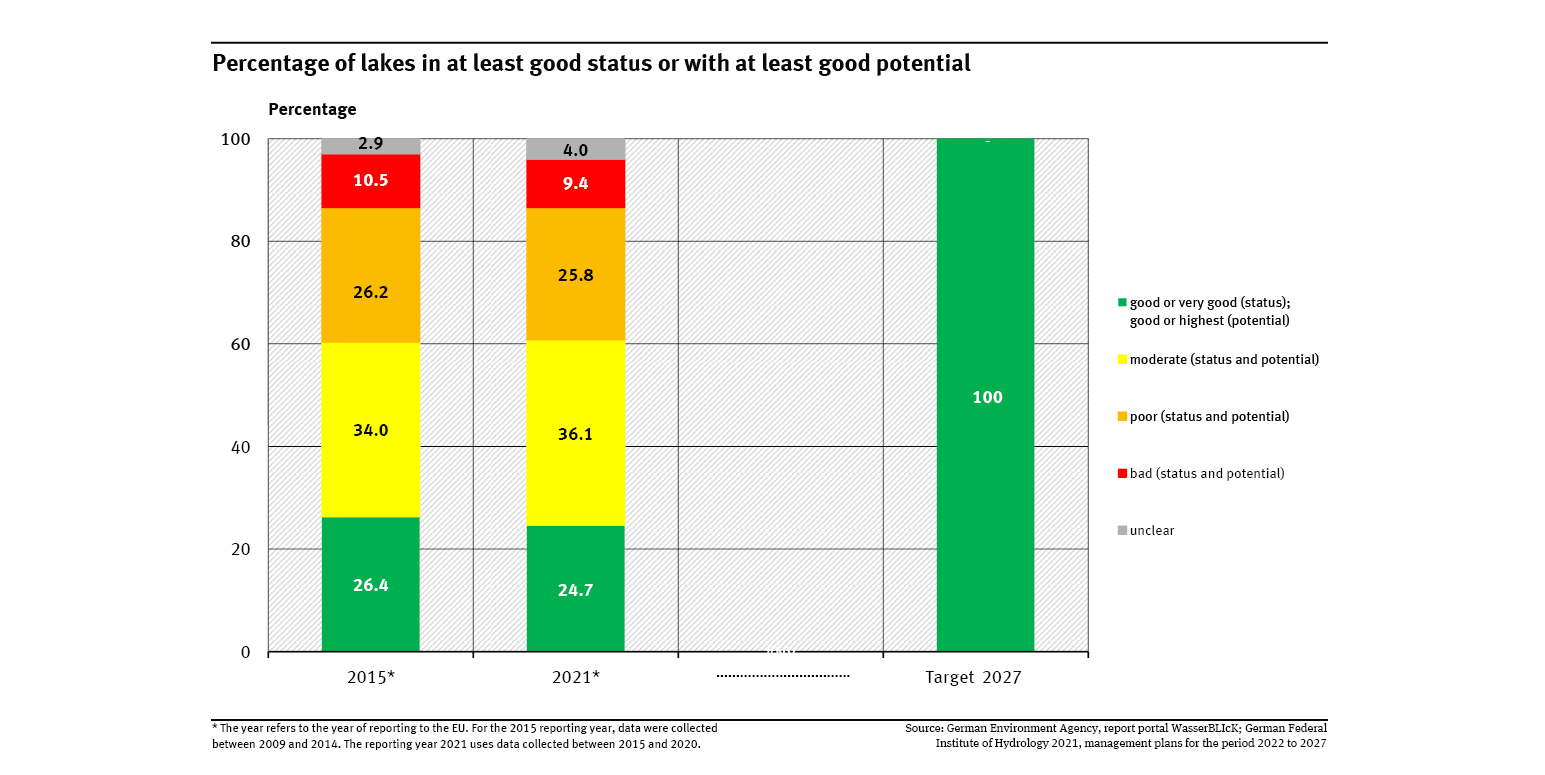
Percentage of lakes in at least good status or with at least a good potential
- Wasser
- Diagramme
- Umwelt-Indikatoren
- Daten und Tabellen

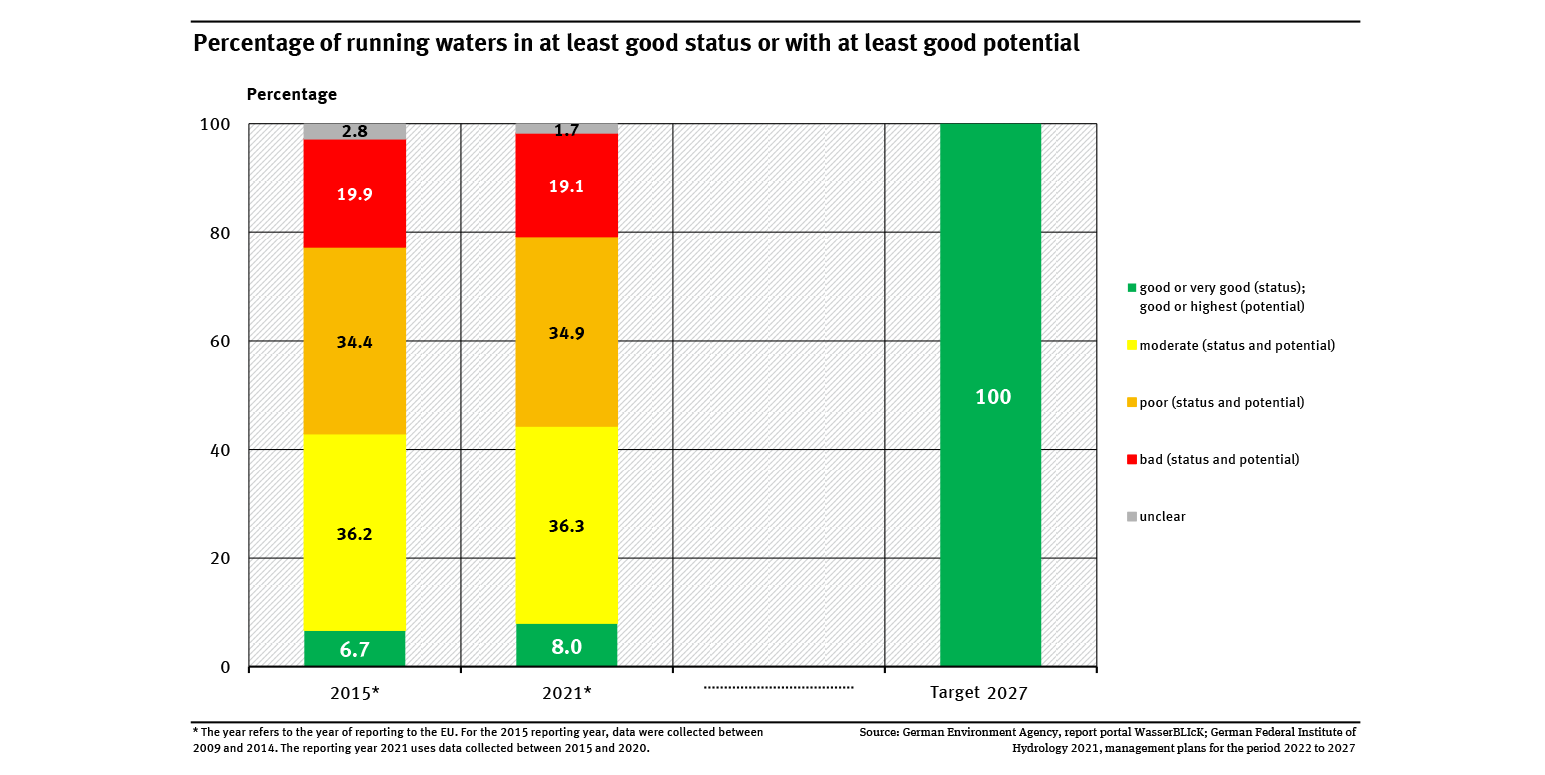
Percentage of running waters in at least good status or with at least a good potential
- Wasser
- Diagramme
- Umwelt-Indikatoren
- Daten und Tabellen

Export data

Development of raw material consumption (RMC) in Germany by raw material group, 2008–2020
- Ressourcen und Abfall
- Private Haushalte und Konsum
- Diagramme
Export data

