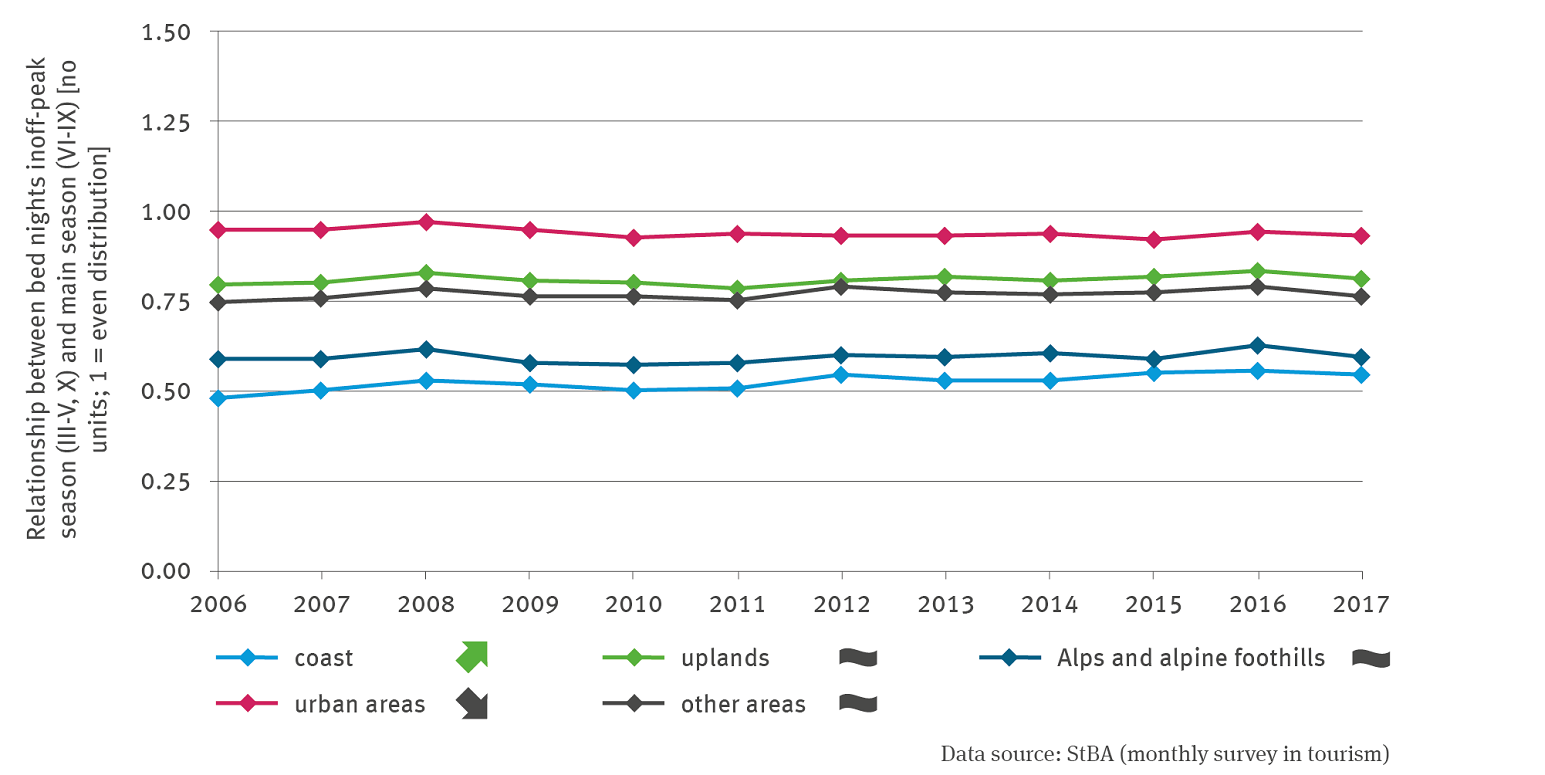
The line diagram shows the ratio of overnight stays in the low season (III-V, X) and in the high season (VI-IX). The value 1 means equal distribution. The representation is differentiated for the coast, the low mountain ranges, the Alps and the Alpine foothills, the urban areas and other areas. The time series ranges from 2006 to 2017. All lines run to values below 1. The lines do not intersect. The lowest values are found in the Coast line (with a significantly increasing trend), followed by the Alps and Alpine foothills line (without trend), then the Other areas line (without trend), then the Central uplands line (without trend), and finally the Urban areas line (with a significantly decreasing trend). None of the lines, however, show major movements.