Data Search

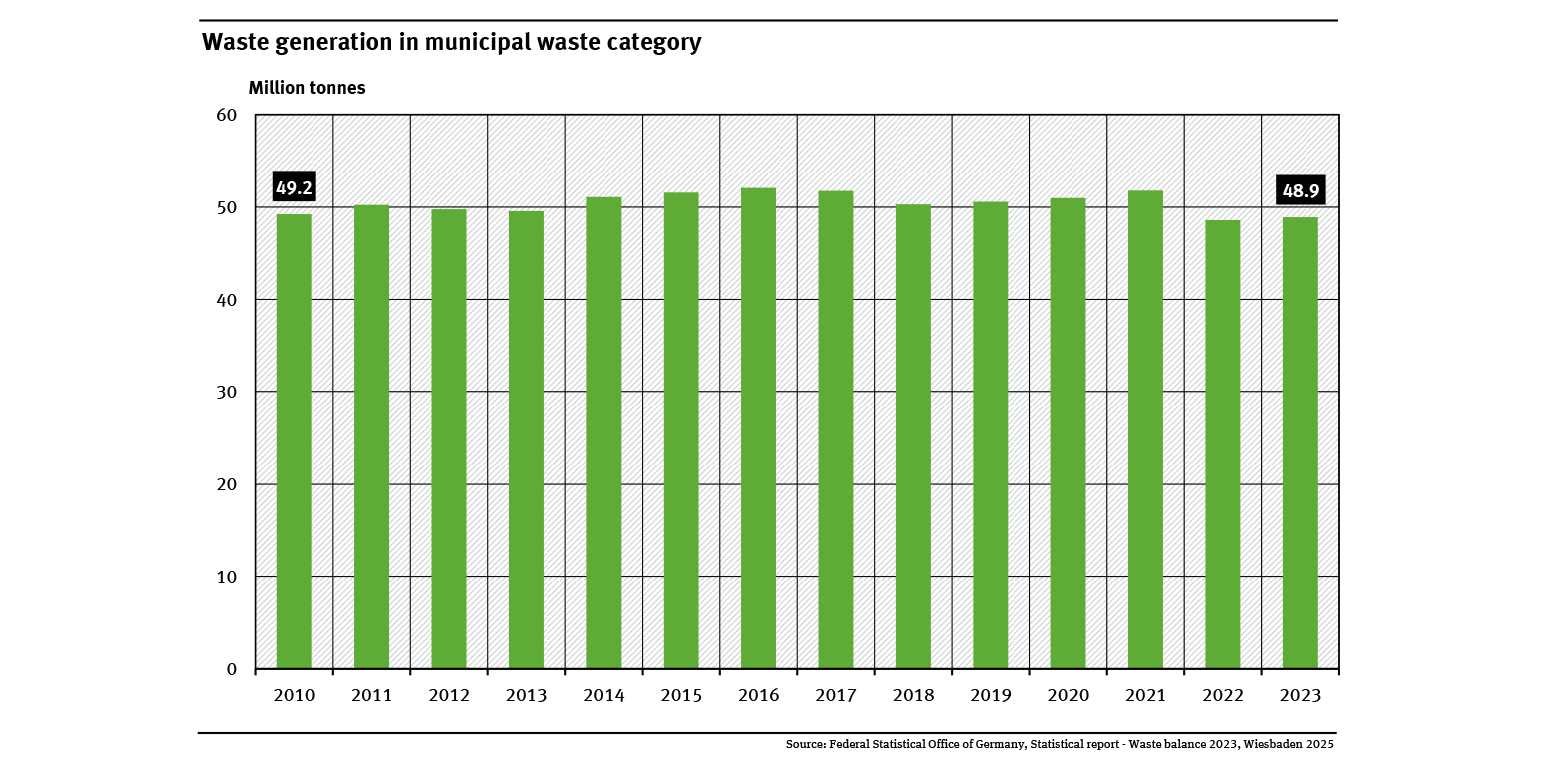
Waste generation in municipal waste category
- Ressourcen und Abfall
- Diagramme
- Umwelt-Indikatoren
- Daten und Tabellen

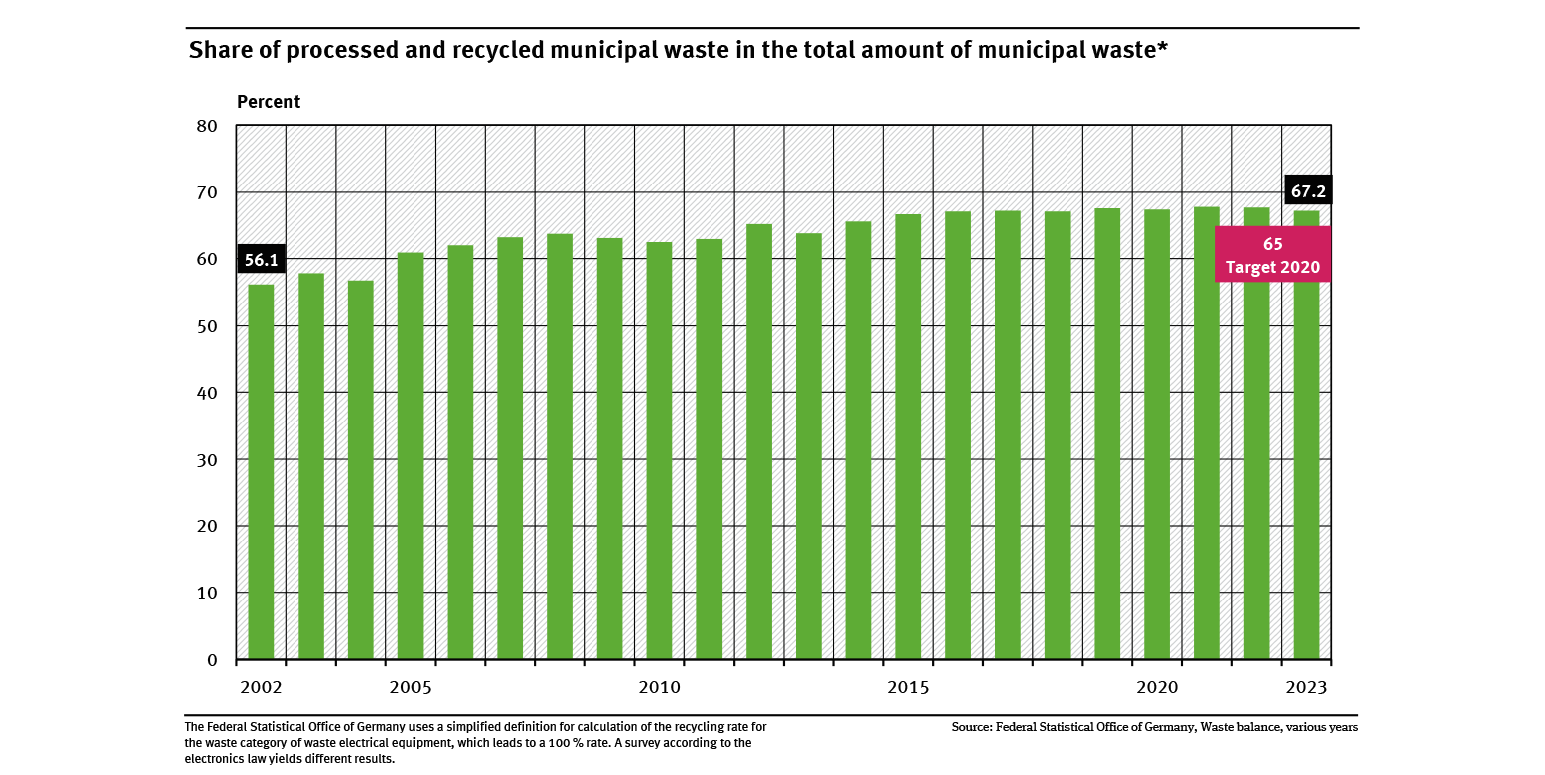
Share of processed and recycled municipal waste in the total amount of municipal waste
- Ressourcen und Abfall
- Diagramme
- Umwelt-Indikatoren
- Daten und Tabellen

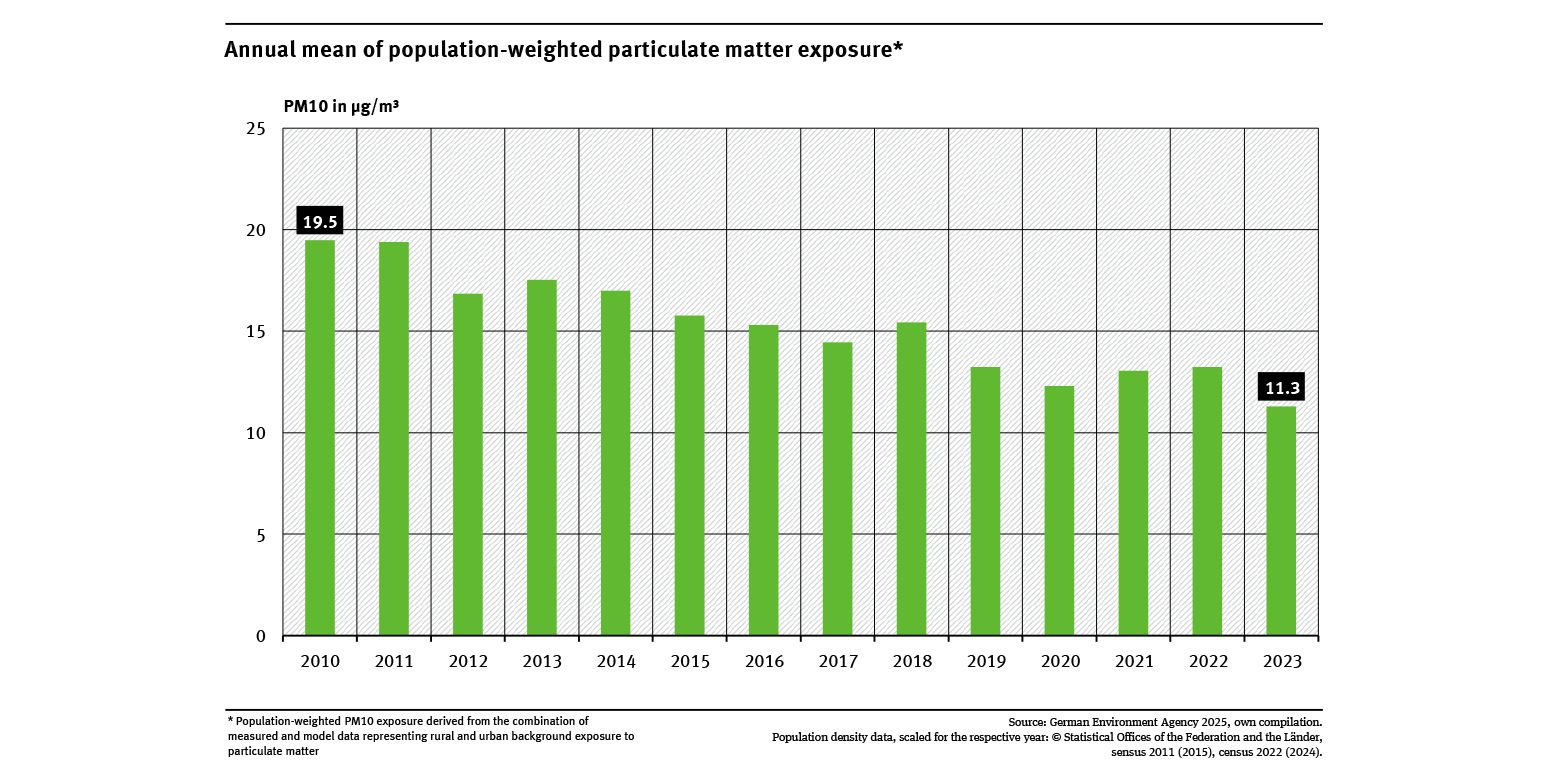
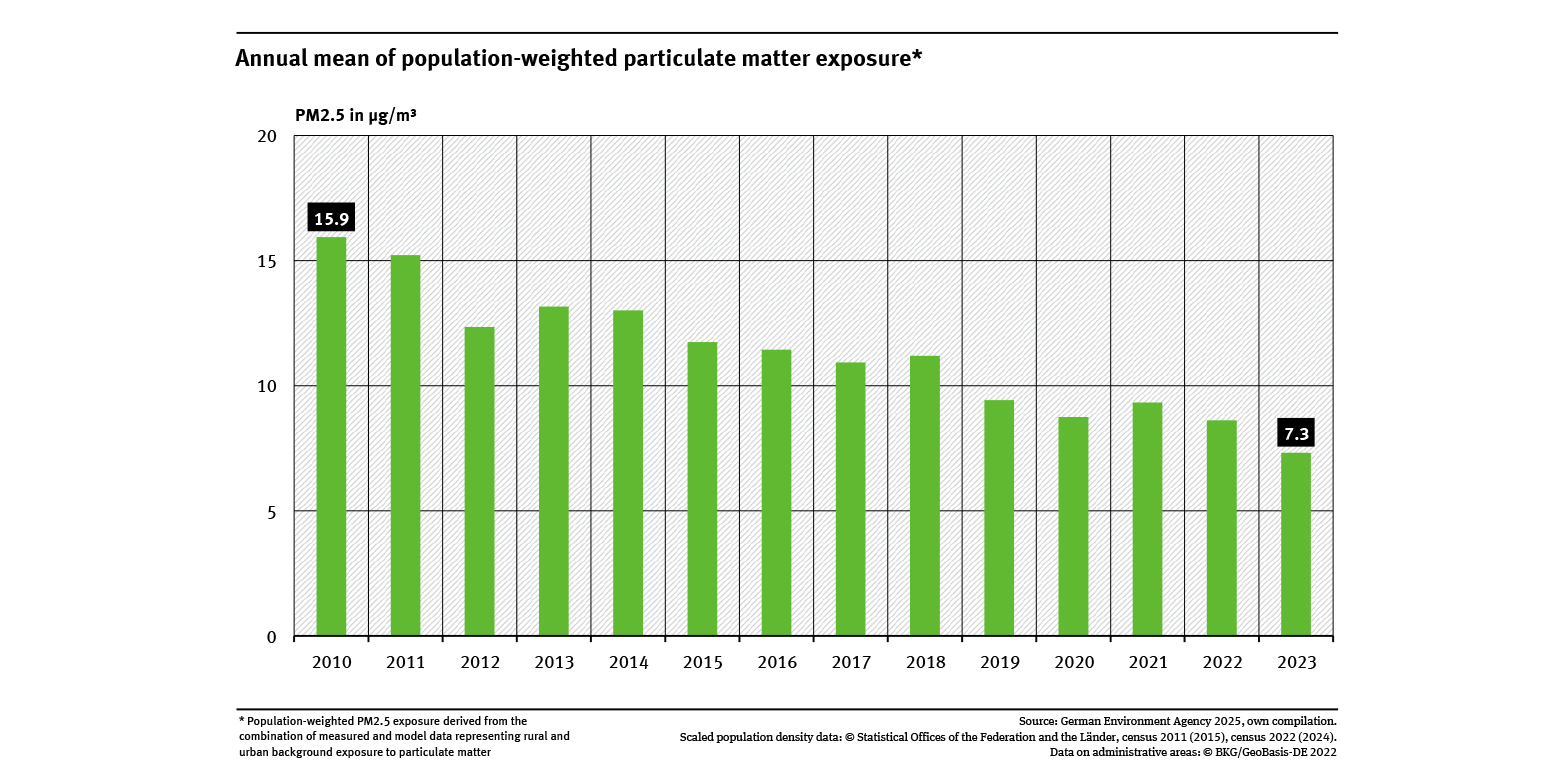
Annual mean of population-weighted particulate matter exposure
- Luft
- Umwelt und Gesundheit
- Diagramme
- Umwelt-Indikatoren
- Daten und Tabellen

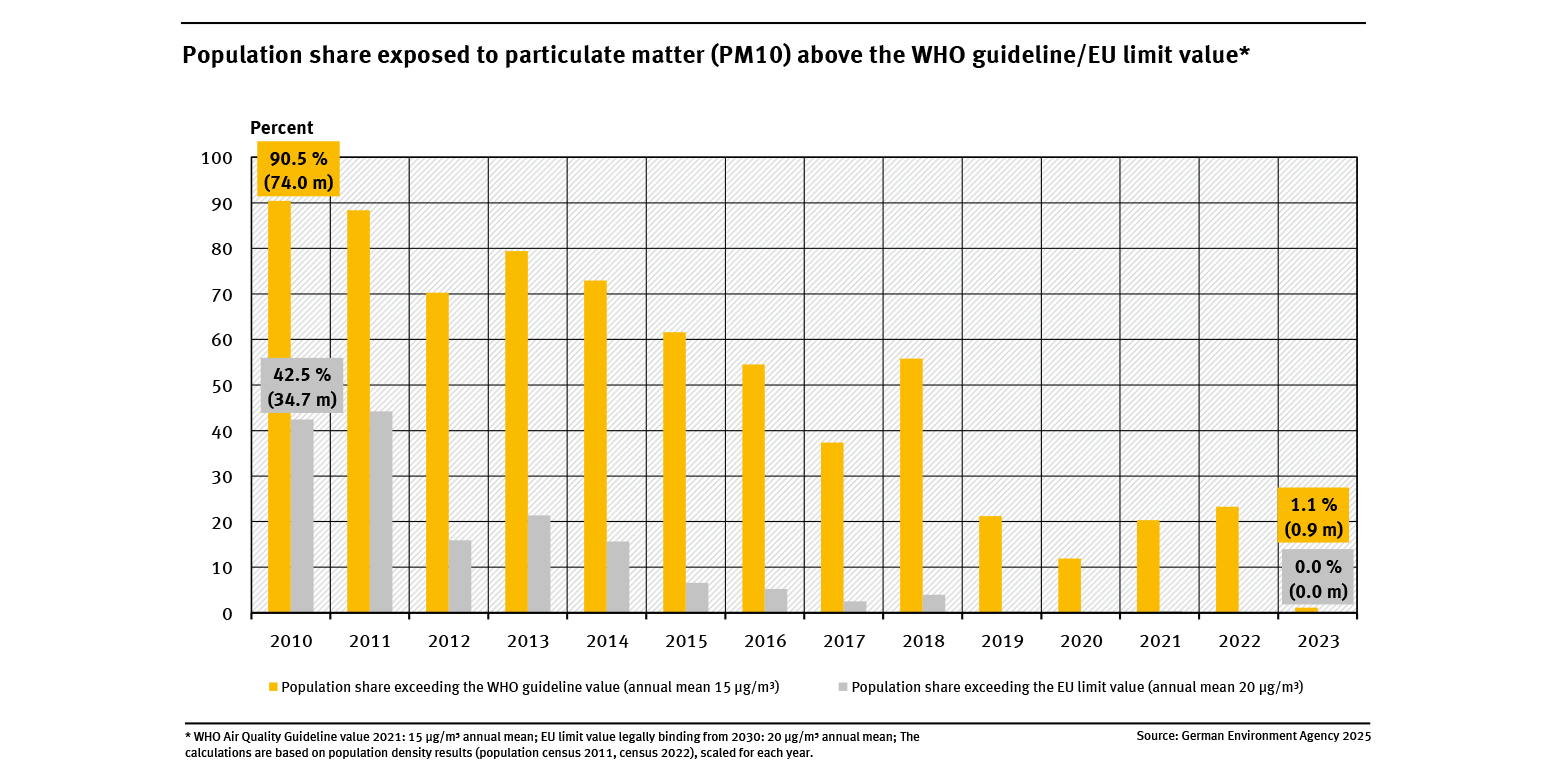
Population share exposed to particulate matter (PM10) above the WHO guideline/EU limit value
- Luft
- Umwelt und Gesundheit
- Diagramme
- Umwelt-Indikatoren
- Daten und Tabellen

Annual mean of population-weighted particulate matter exposure
- Luft
- Umwelt und Gesundheit
- Diagramme
- Umwelt-Indikatoren
- Daten und Tabellen

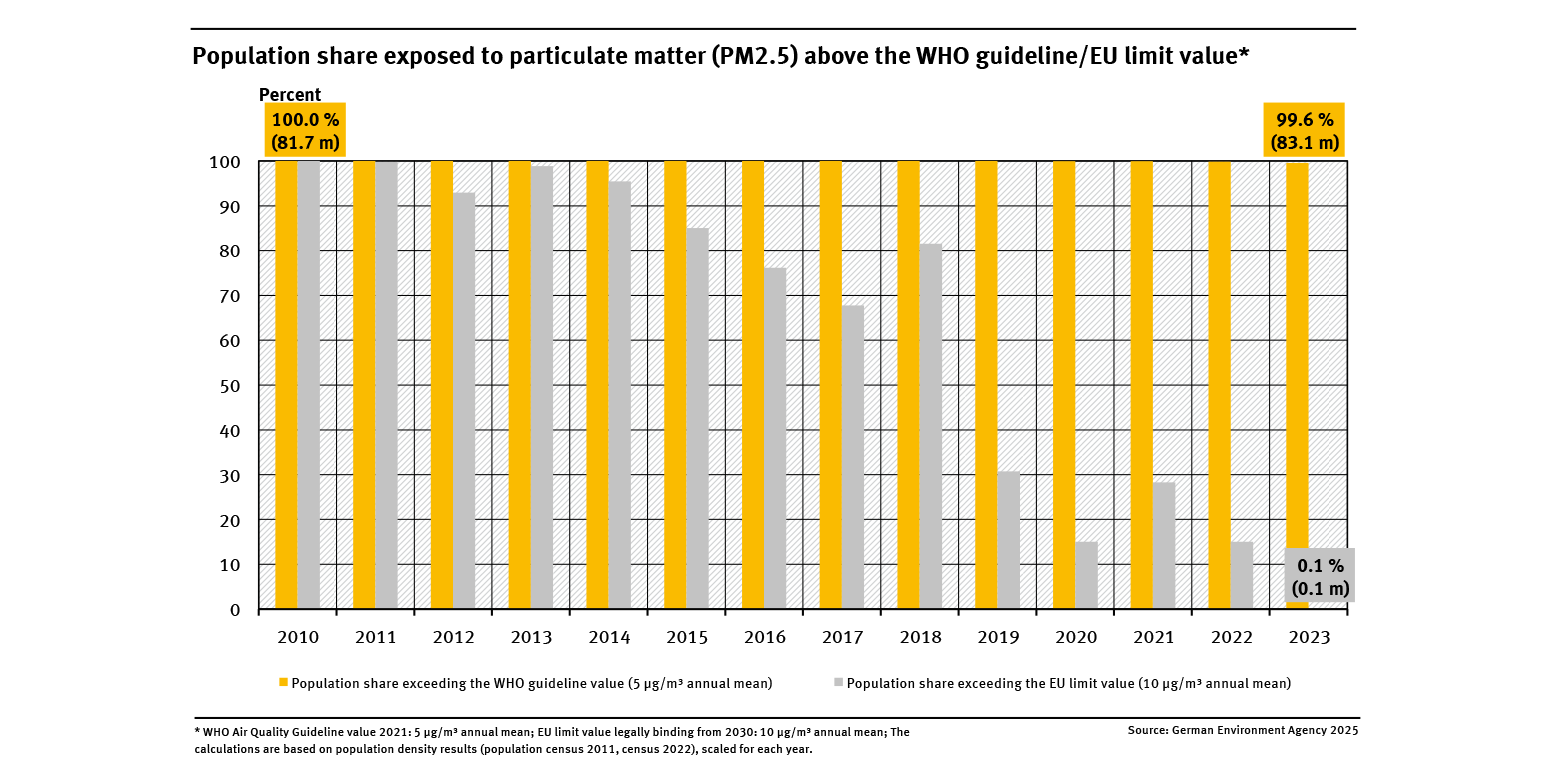
Population share exposed to particulate matter (PM2.5) above the WHO guideline/EU limit value
- Luft
- Umwelt und Gesundheit
- Diagramme
- Umwelt-Indikatoren
- Daten und Tabellen

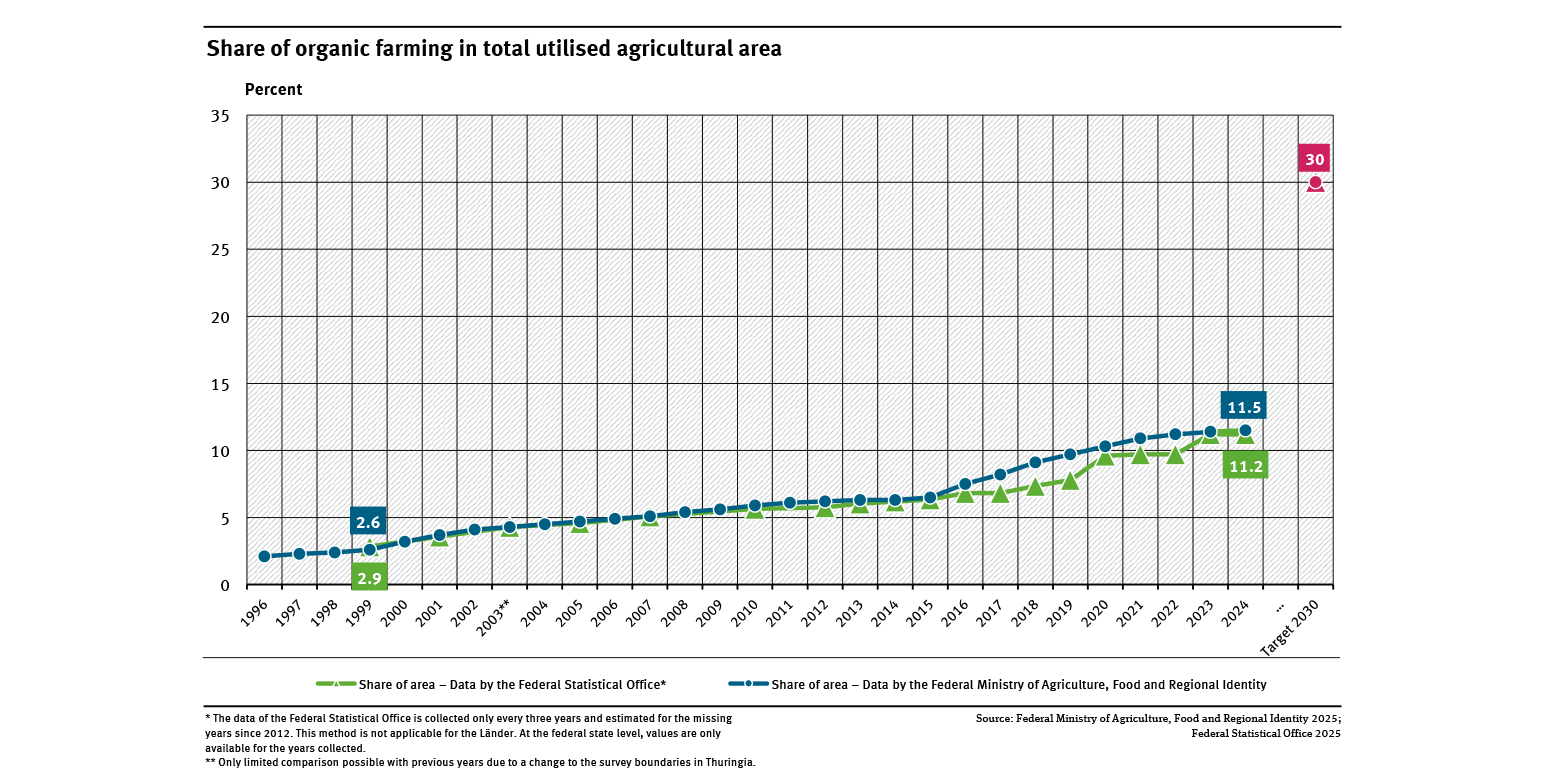
Share of organic farming in total utilised agricultural area
- Land- und Forstwirtschaft
- Diagramme
- Umwelt-Indikatoren
- Daten und Tabellen

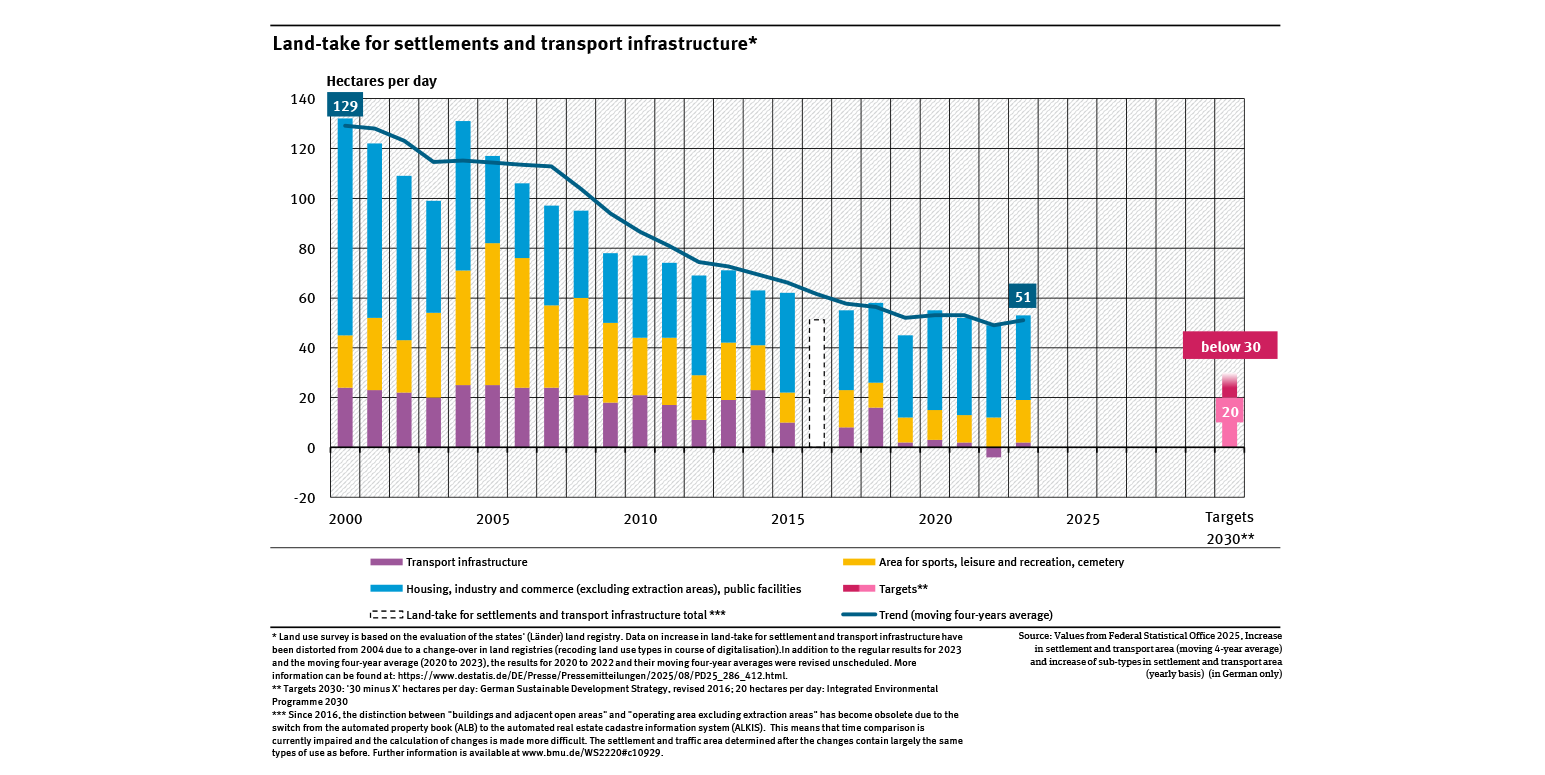
Land-take for settlements and transport infrastructure
- Fläche, Boden, Land-Ökosysteme
- Diagramme
- Umwelt-Indikatoren
- Daten und Tabellen

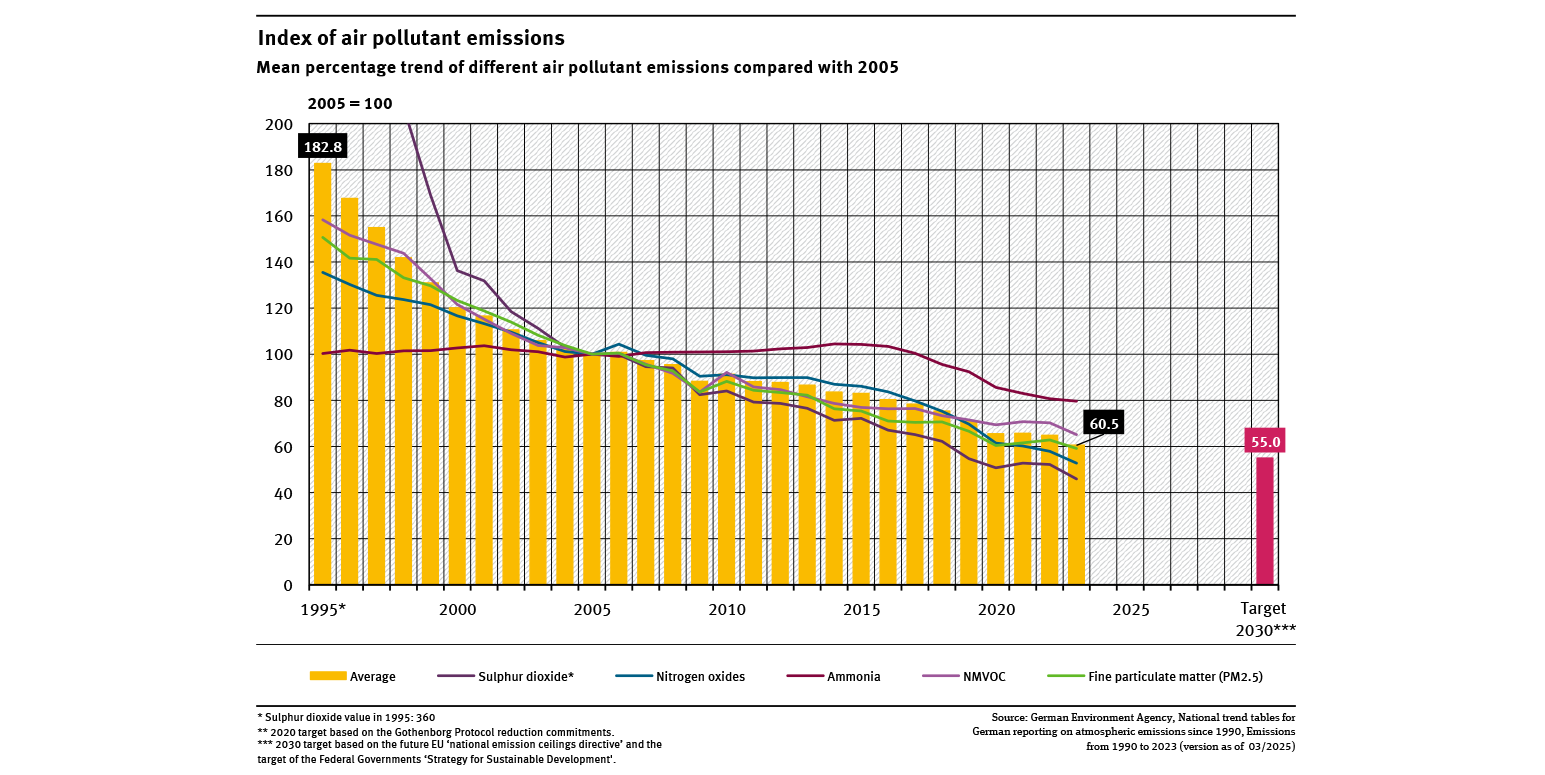
Index of air pollutant emissions
- Luft
- Diagramme
- Umwelt-Indikatoren
- Daten und Tabellen

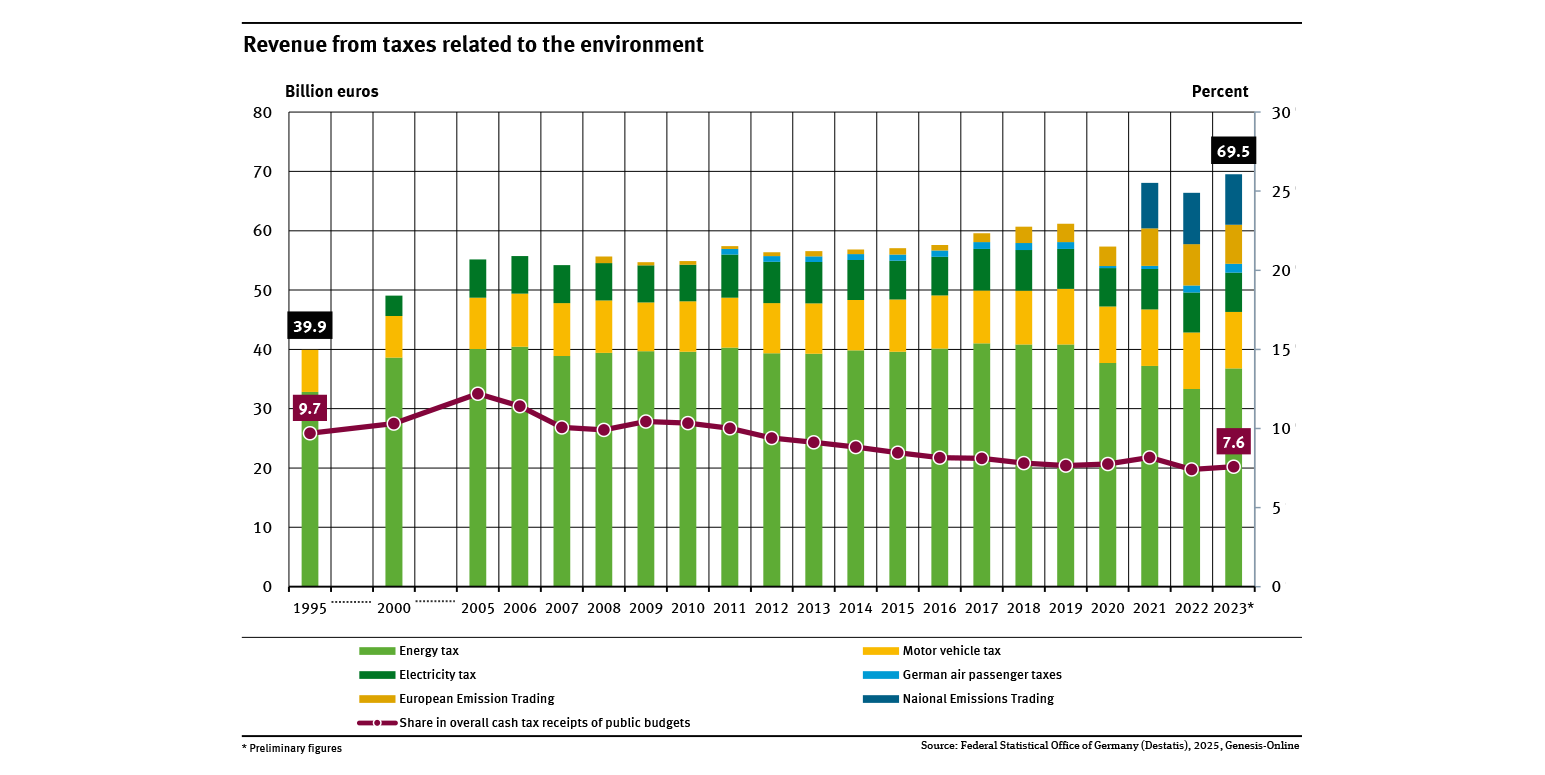
Revenue from taxes to the environment
- Umwelt und Wirtschaft
- Diagramme
- Umwelt-Indikatoren
- Daten und Tabellen