Database - Pharmaceuticals in the environment

World map of pills
© djahan / Fotolia.com

Pharmaceutical residues occur globally in the environment. This is demonstrated in the updated database “PHARMS-UBA”. Residues of pharmaceuticals in the environment have been measured in 89 countries in all UN regions. For Germany, 414 active substances or their transformation products were reported, 749 for the European Union and 992 worldwide.

You are invited to browse the 276,895 data entries from 2,062 publications in the publicly available database here.
NEW! Access the PHARMS-UBA database also in the IPCHEM Portal.
A brief instruction how to access the PHARMS-UBA database is available here.

Background
Residues of pharmaceuticals are known to occur widely in the aquatic environment of industrialized countries. Even in developing and emerging countries, information on the occurrence of pharmaceutical residues in the environment has become more readily available in recent years. However, a concise and comprehensive overview of the relevant pharmaceuticals, their concentrations in the environment and their potential effects on human health and ecosystems is still pending. The information on worldwide exposure of pharmaceuticals is increasing and the German Environment Agency intends to organise these data in a publicly available database. In 2014, worldwide environmental concentrations (MEC - Measured Environmental Concentrations) of human and veterinary pharmaceutical residues were compiled in a database within the framework of the research project "Pharmaceuticals in the environment - occurrence, effects and options for action". The now available update of this database focuses on all worldwide MECs published in peer-reviewed journals between 2017 and 2020.

Summary of results
The database now contains 276,895 entries. Active substances or their transformation products were detected in the environment of 89 countries of all five UN regions (see also Figure 1 and 2). In total, 992 different pharmaceutical substances were measured worldwide in concentrations above their detection limits of the respective analytical methods employed, revealing regional patterns. In Germany alone 414 active substances were detected above their detection limits as well as 749 active substance in EU countries (see Table 1). Most of these substances were found in the effluents of wastewater treatment plants (liquid emission – globally: 771, EU: 591, Germany: 339). In surface water, groundwater and drinking water 703 substances were detected globally and 198 in Germany (liquid immission). 37 substances were detected in surface water, groundwater or drinking water in all five UN regions (see Table 2).
In the final report on the database update further exemplary evaluations can be found

The database
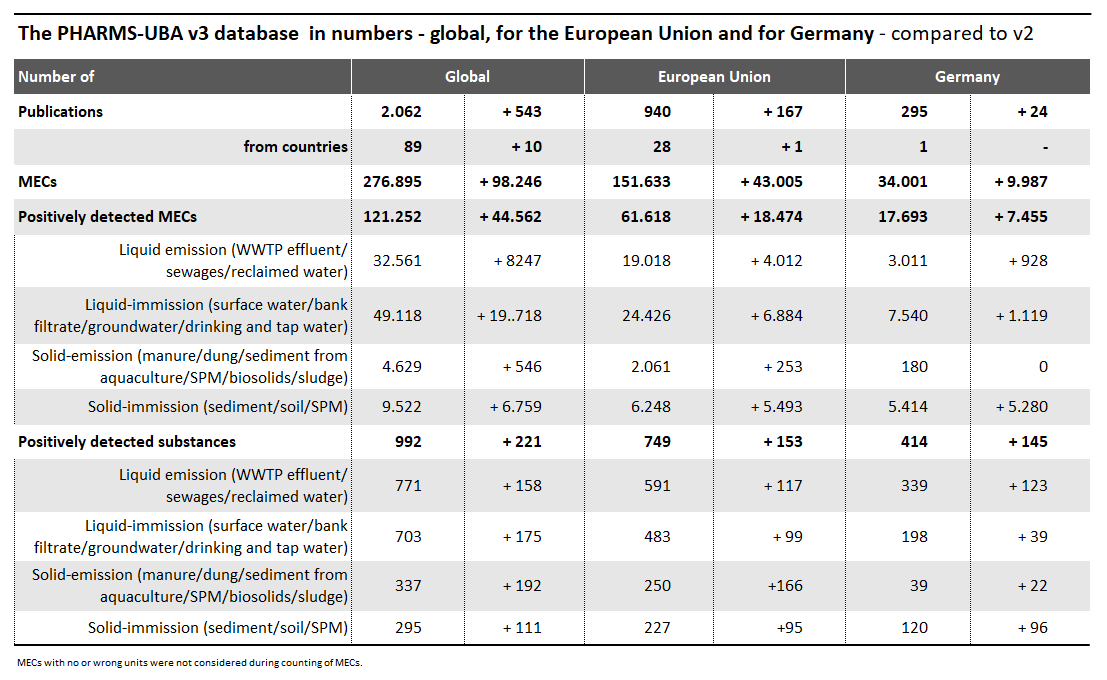
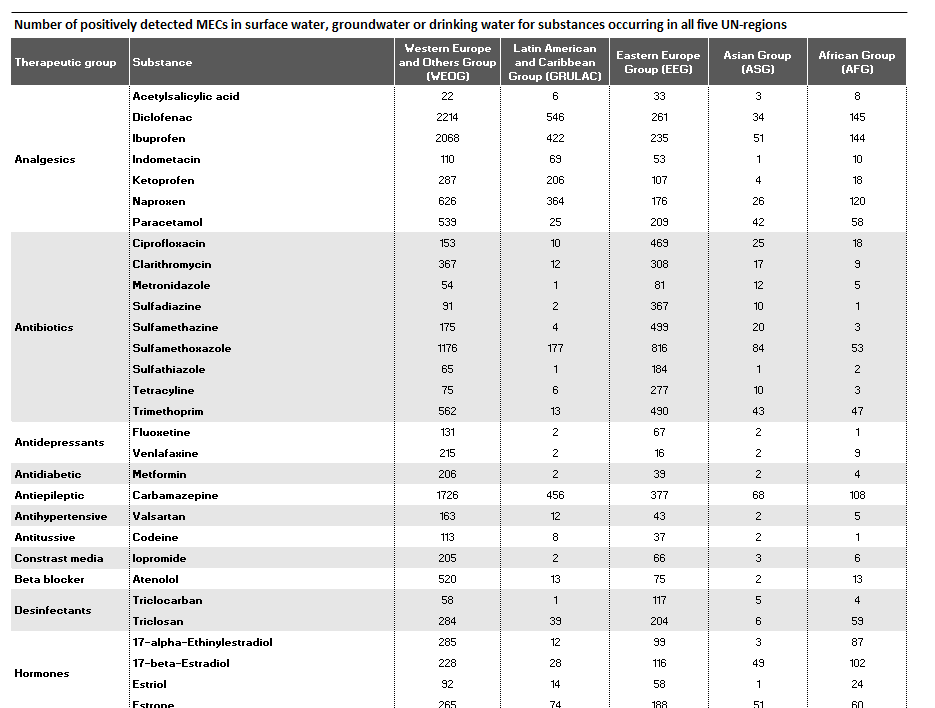
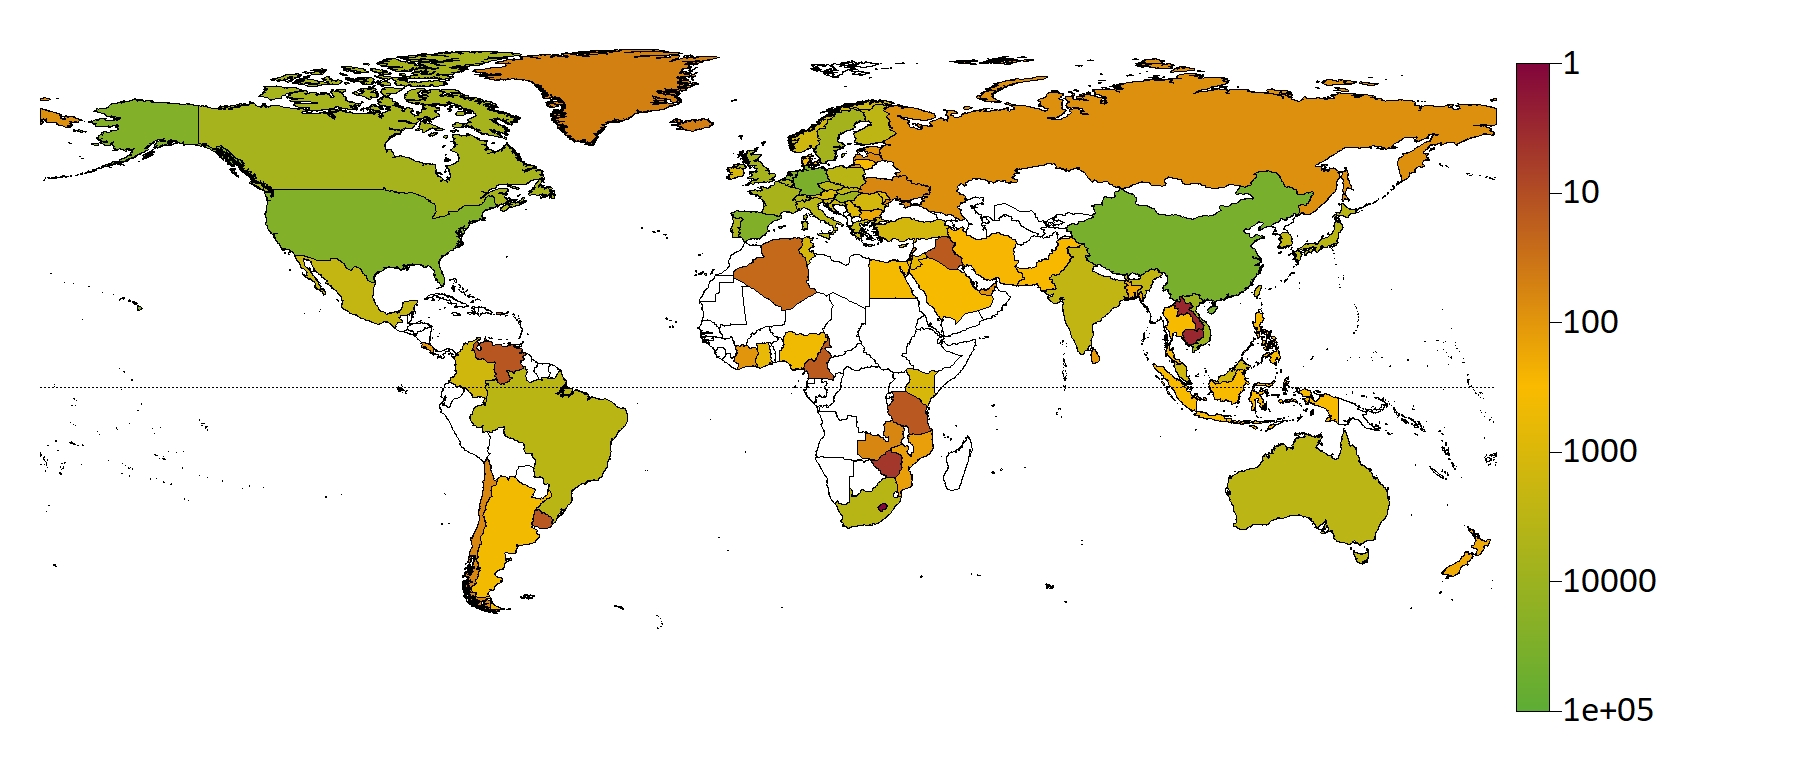
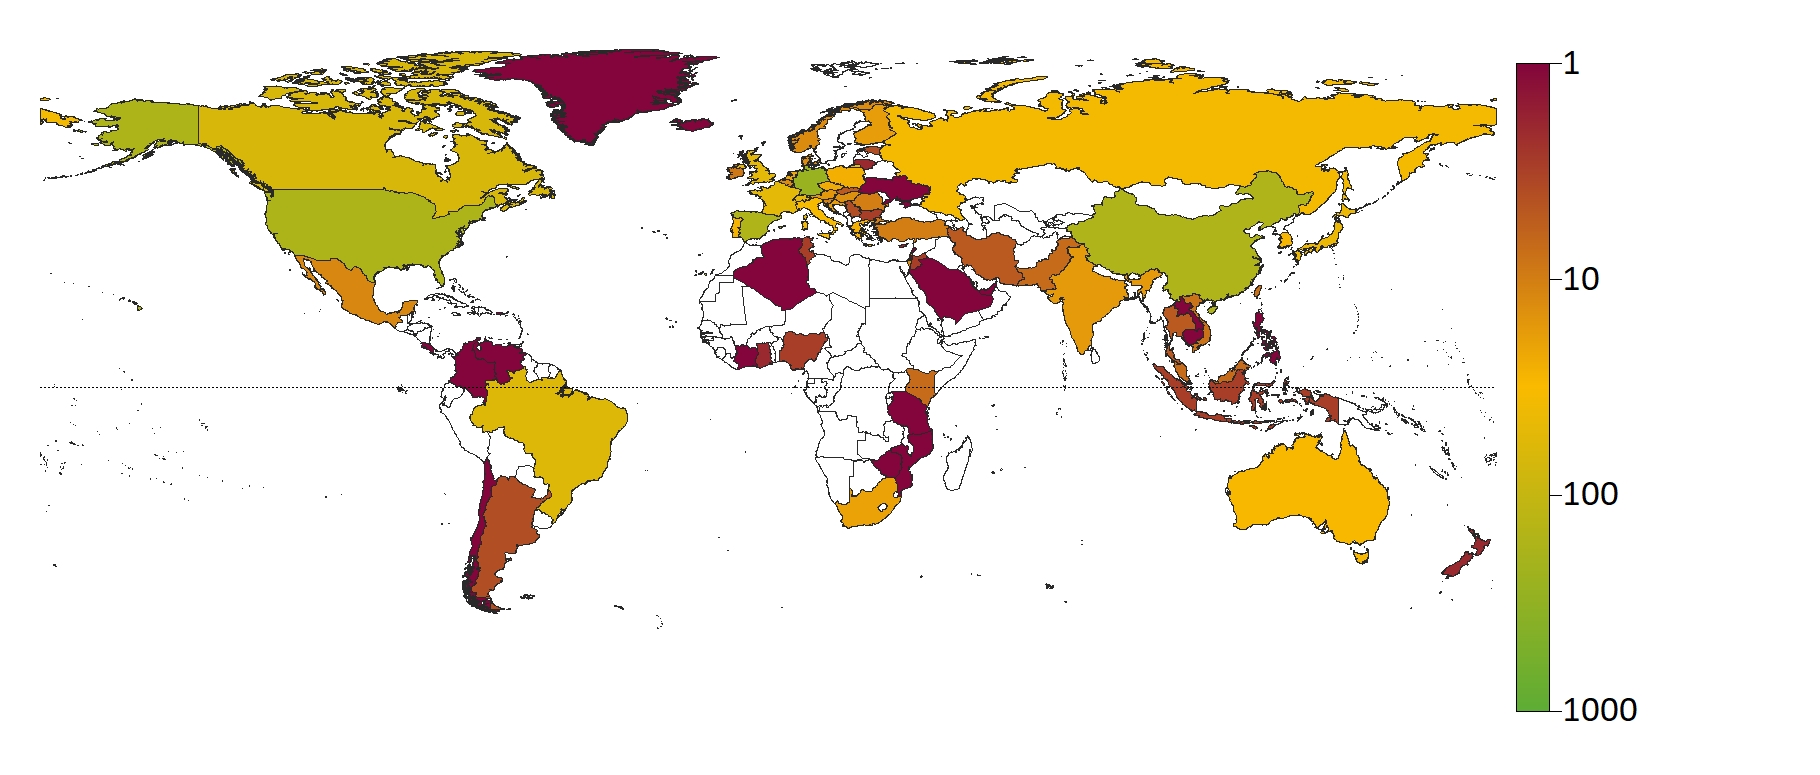
For the database 2,062 publications were comprehensively reviewed and analysed. Environmental concentrations of human and veterinary pharmaceutical residues could be collected for 61 matrices. Most pharmaceutical residues were found in surface water, groundwater, tap/drinking water as well as in soil and sediment.
The data were transferred from the publications, reports and other data sources into the database (MEC database). The database is available for download as Microsoft Excel© or as Microsoft Access© file. Each database entry comprises 33 fields, including amongst others the name of the pharmaceutical substance, its CAS number, the environmental matrix the substance was measured in, geographical location, sampling period, number of measurements, measured concentration in original and standardised units, detection limit of the analytical method employed, pollution source (if stated in publication), literature citation, publication language and type, and quality flag.
All references used were compiled in an Endnote© literature database. For transparency and to allow for better working with the MEC database please download here the literature database as travelling library and in other formats in a zip-file.

Matrices
The 992 pharmaceutical substances were detected in 61 matrices in total. Matrices with the most environmental concentrations are surface water, riverbank filtration, groundwater, well-water, tap/drinking water, sewage, effluents and sludge of wastewater treatment plants (WWTP), manure, soil, sediments and suspended particulate matter. Further matrices were distinguished. During the data import of the years 2017-2020 seven further environmental matrices (e.g. compost, sediment lagoon, spring water) were added to the database.

Regional aggregation
The geographic sampling were categorised according to the United Nations regional groups of Member States (Africa Group; Asia-Pacific group; Eastern Europe group (EEG); group of Latin American and Caribbean States (GRULAC); Western Europe and Others Group (WEOG), including North America, Australia, and New Zealand).

Data aggregation
Many publications contain multiple environmental concentrations in rather evaluated form (e.g. average, median, 90th percentile, minimum or maximum of a monitoring campaign) than single observations. These aggregated data are compiled additionally in a database entry together with information on statistics and number of underlying measurements.

Quality assessment
A quality flag of each database entry refer to the reliability, plausibility and applied analytical standards of each publication. However, the quality of a publication is difficult to assess and can also be a matter of subjectivity, thus the information on data quality should be seen as an indicator only. Generally, peer-reviewed publications are considered verified sources of high quality. The quality of other sources such as reports or university theses are more difficult to evaluate. Nevertheless, even though some of the methods and results published in non-peer reviewed publications were difficult to verify, the majority of publications can be considered of good quality.

The database "Pharmaceuticals in the Environment" - Update for the period 2017-2020

The database "Pharmaceuticals in the Environment" - Update and new analysis

Arzneimittel in der Umwelt - vermeiden, reduzieren, überwachen

Empfehlungen zur Reduzierung von Mikroverunreinigungen in den Gewässern

Antibiotika und Antibiotikaresistenzen in der Umwelt

Gallery

<>
  1. Figure 1: Map of worldwide distribution of MECs
  2. Figure 2: Map of worldwide distribution of publications reporting MECs

Tables

<>
  1. Table 1 Key Facts DB v3
  2. Tab2: MECs in 5 UN regions
Share:
Article:
Printer-friendly version