Skip to main content Skip to main menu Skip to footer

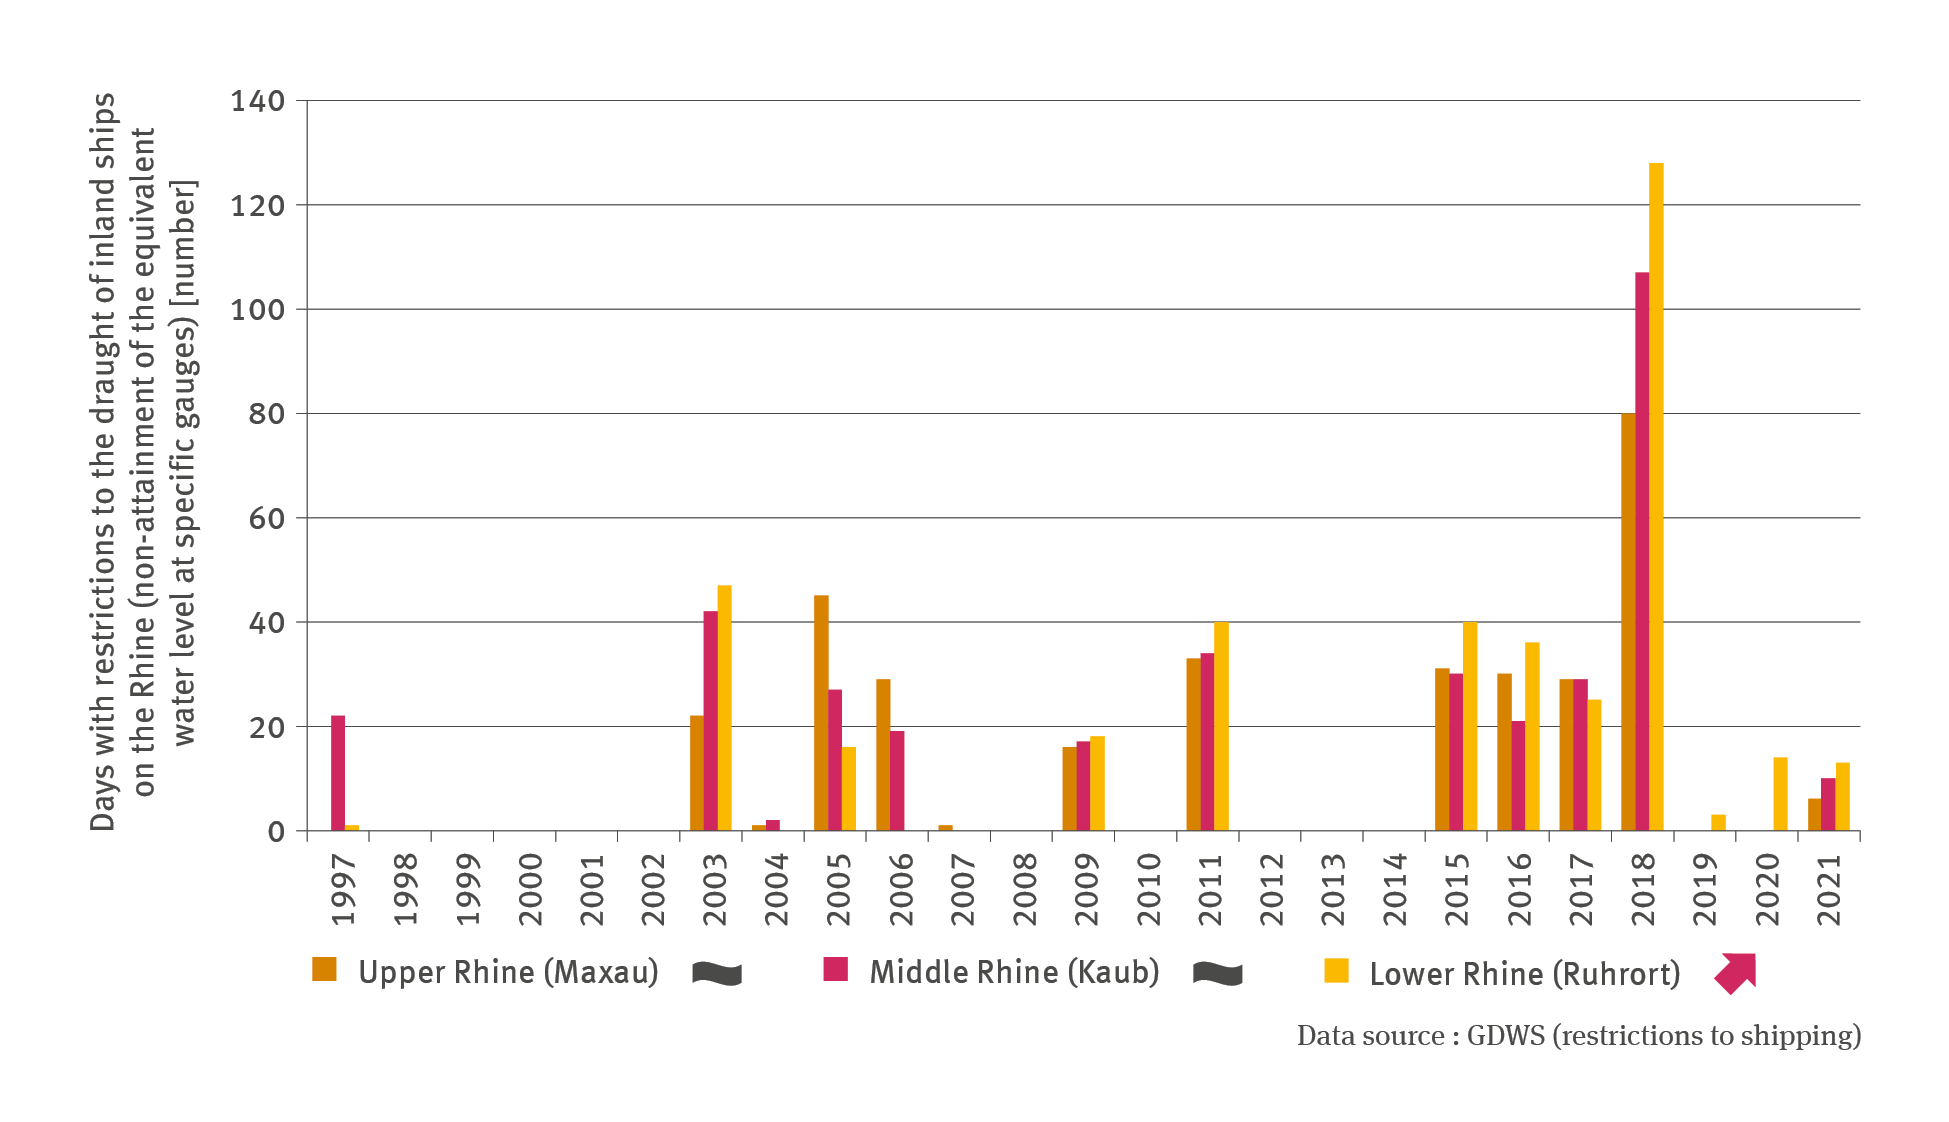
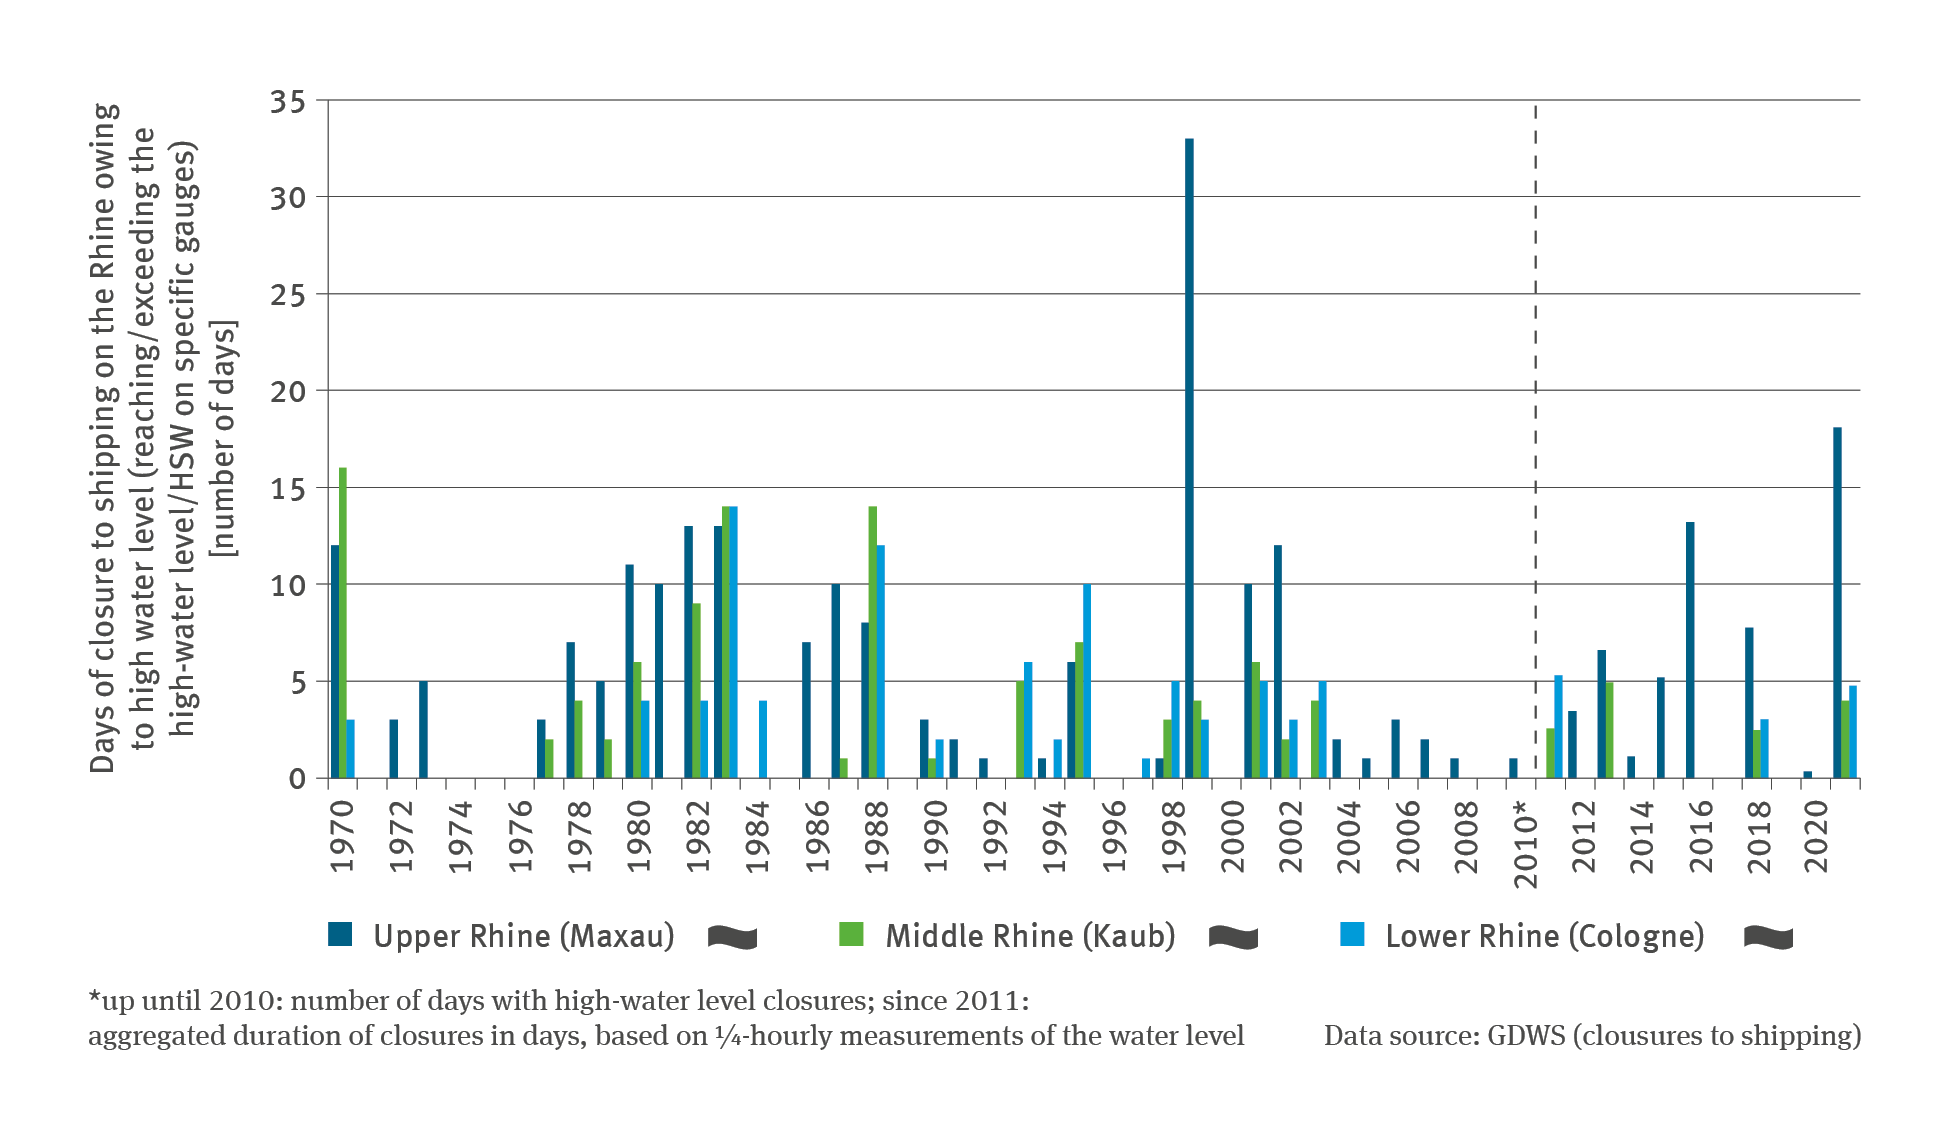
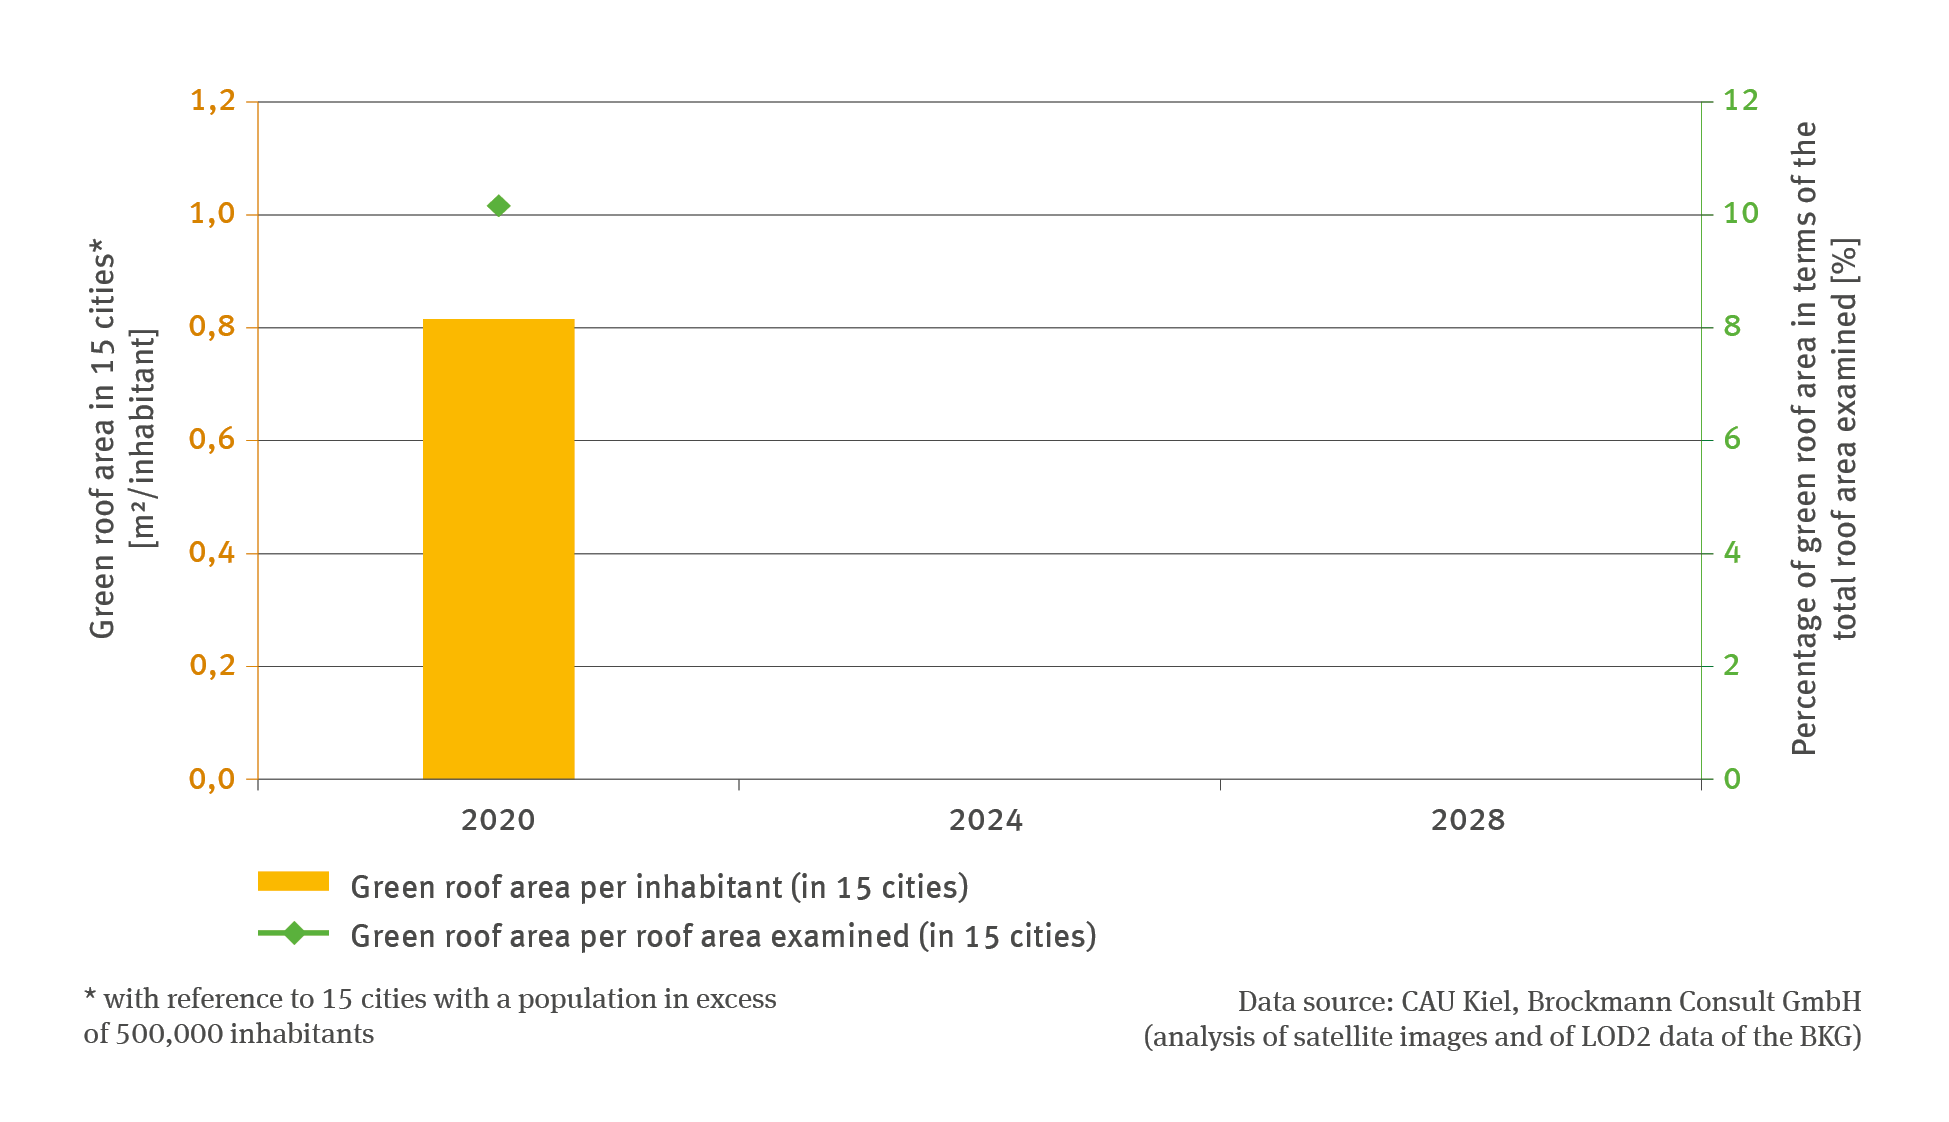
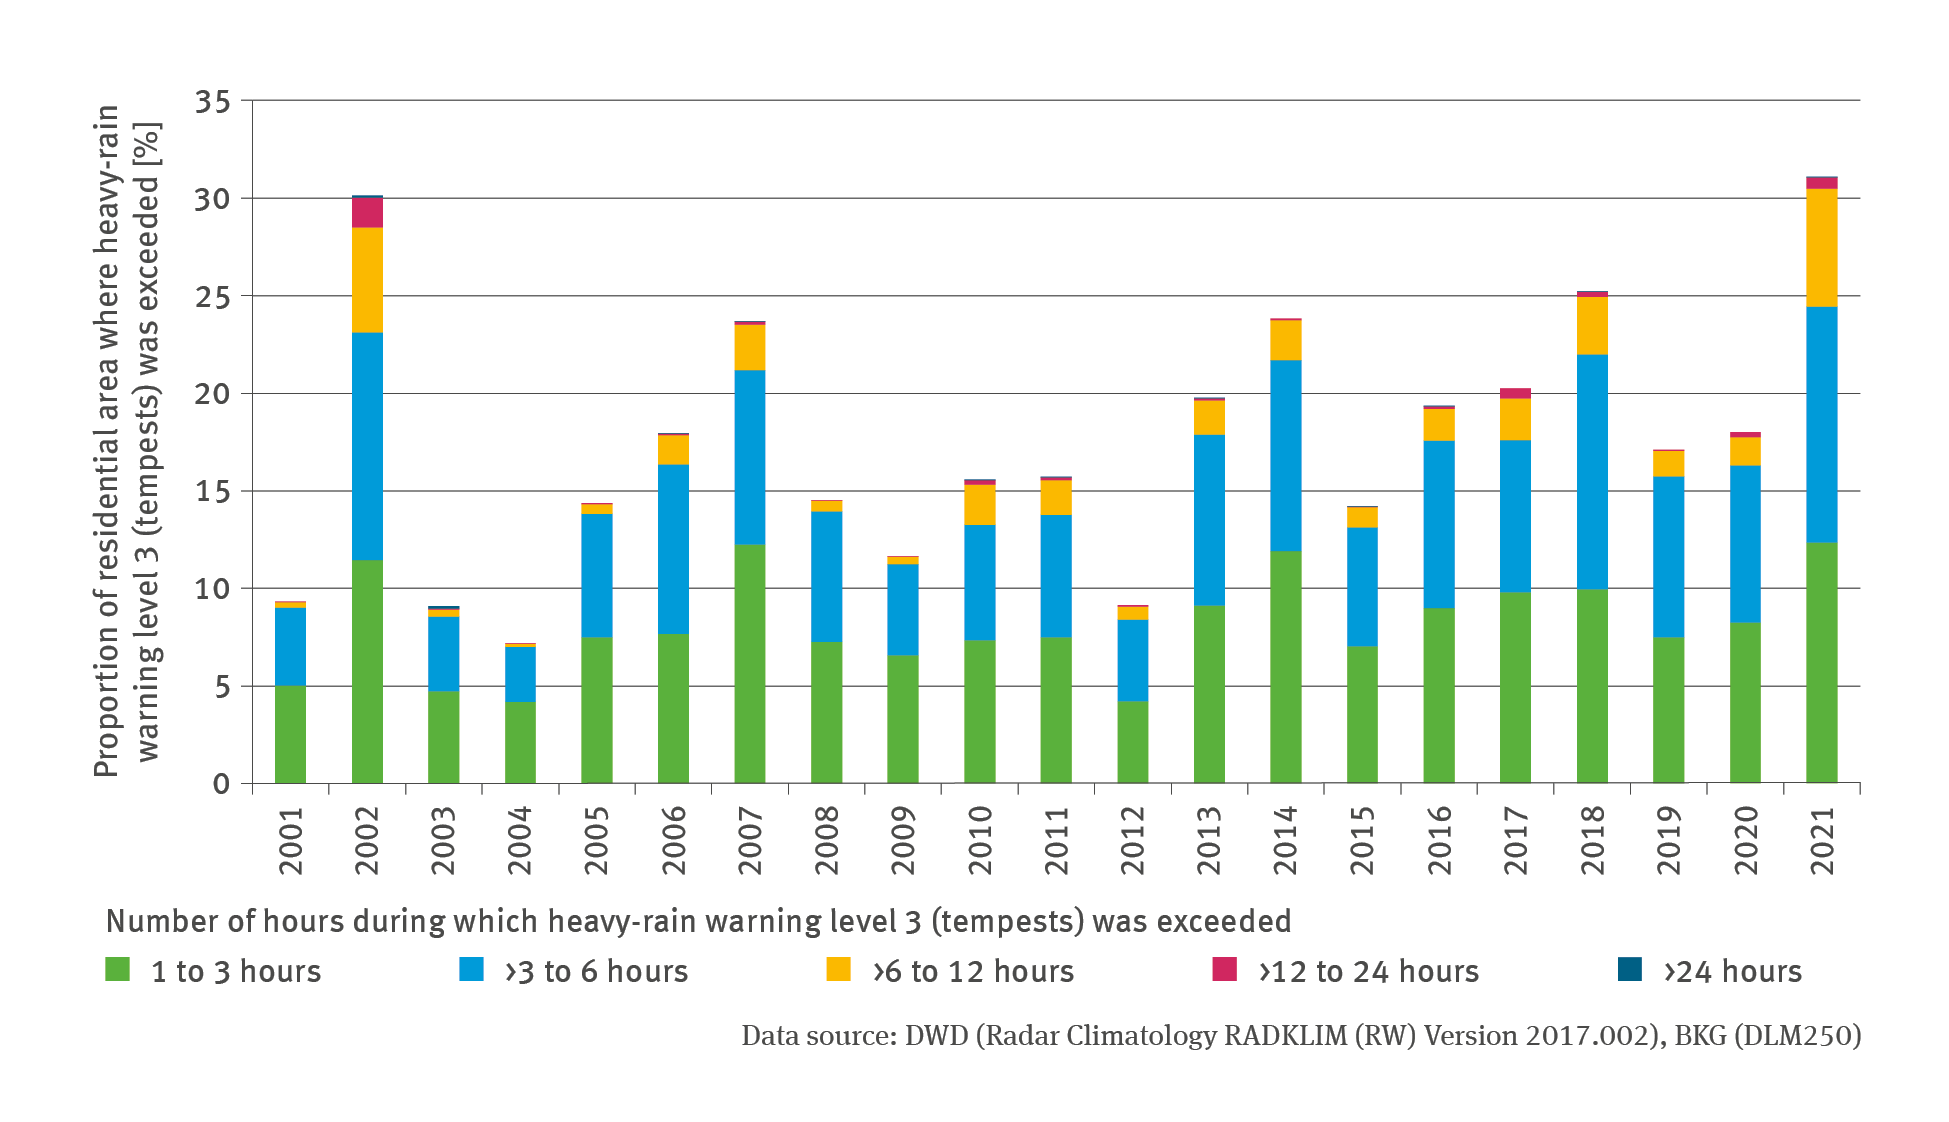
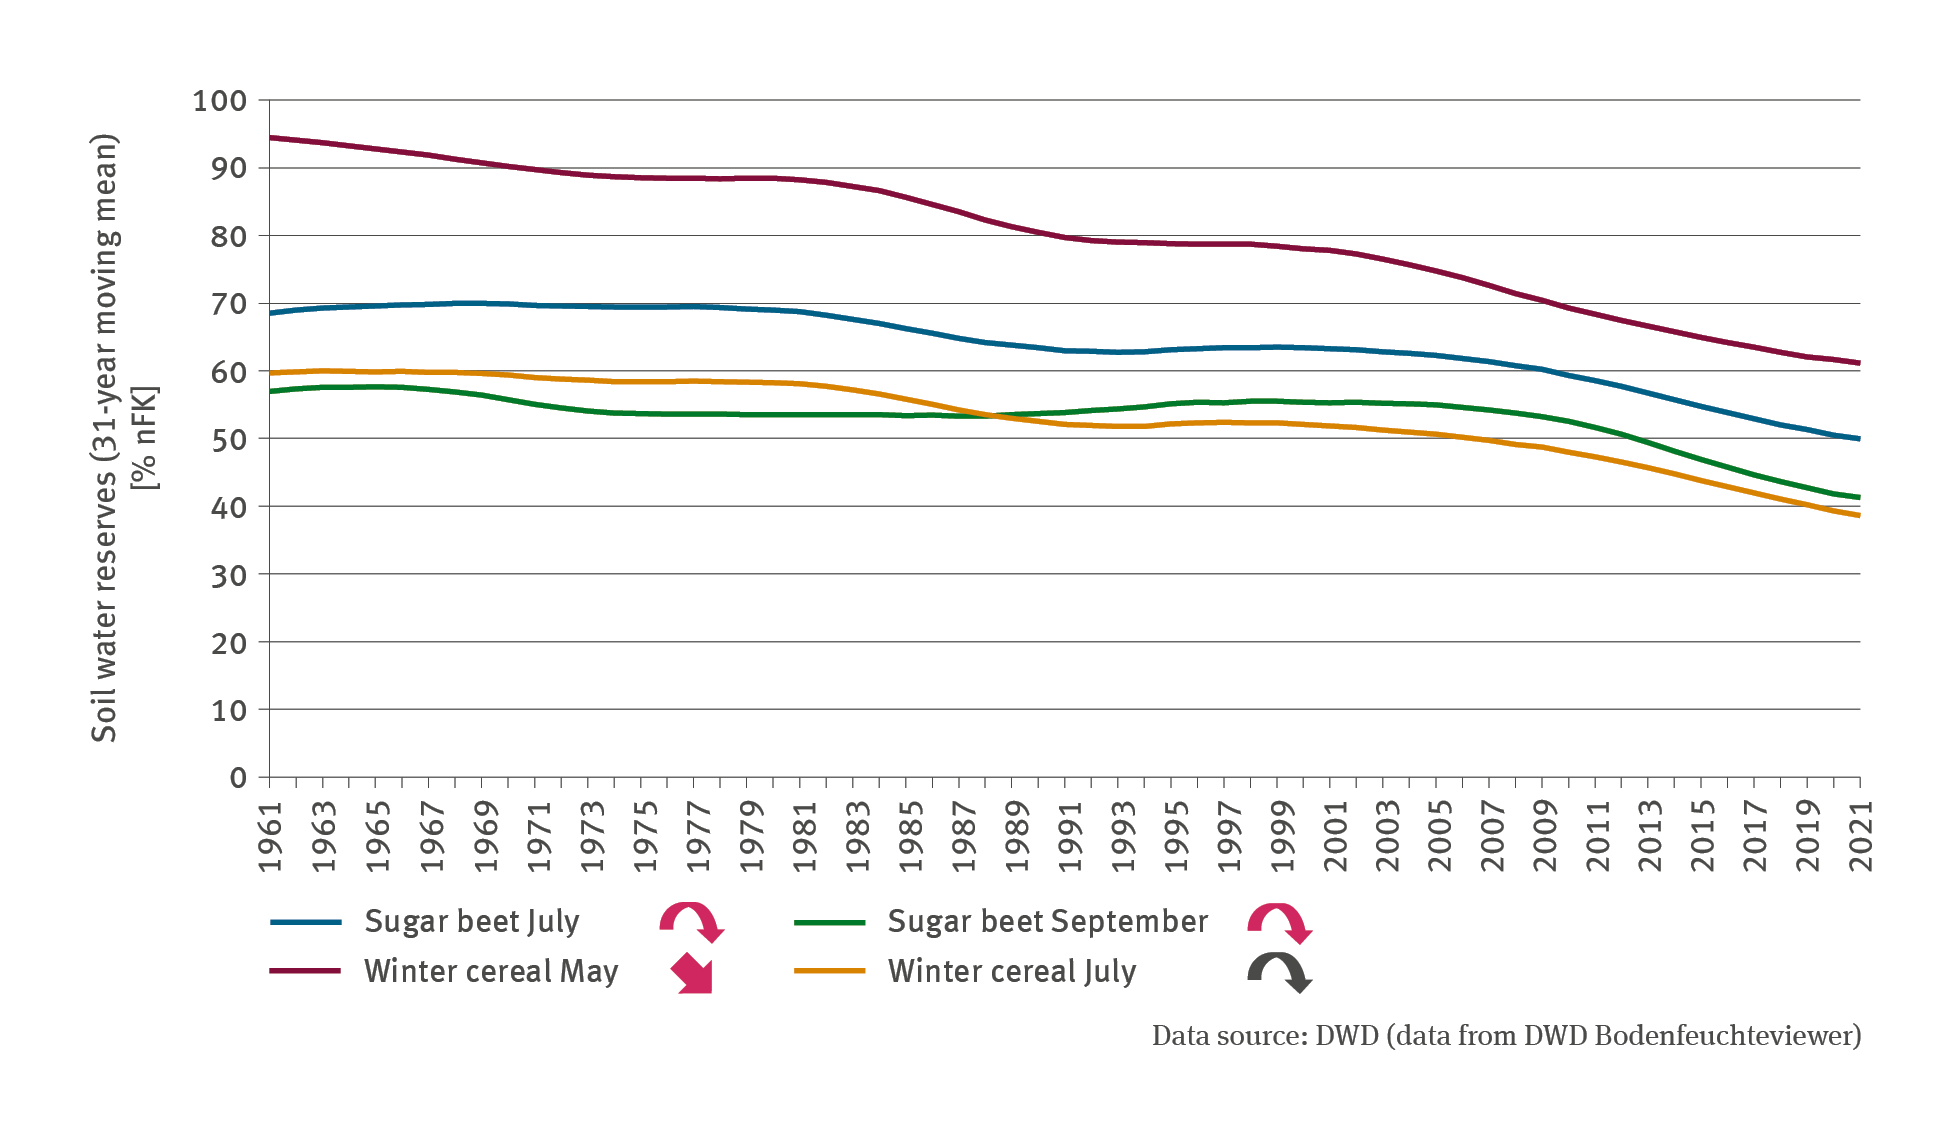
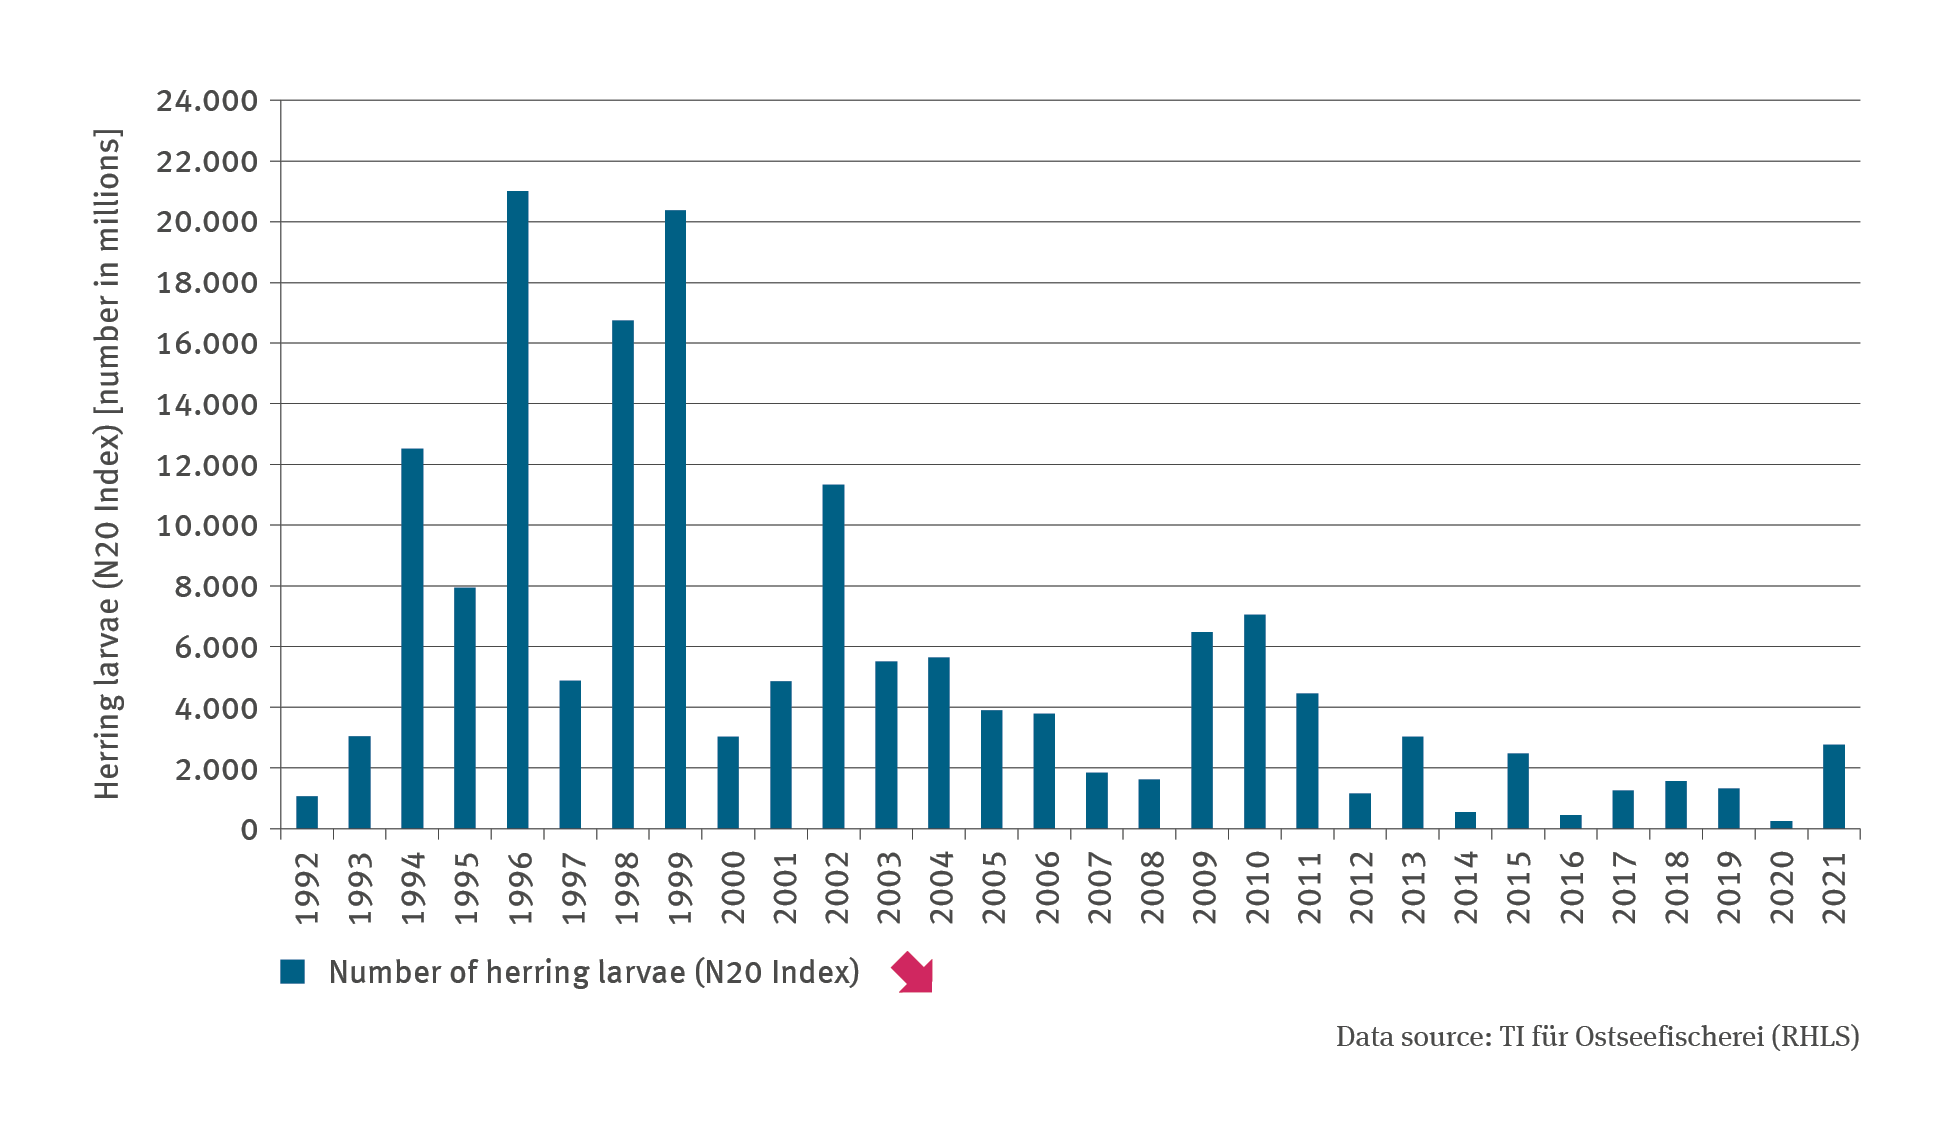
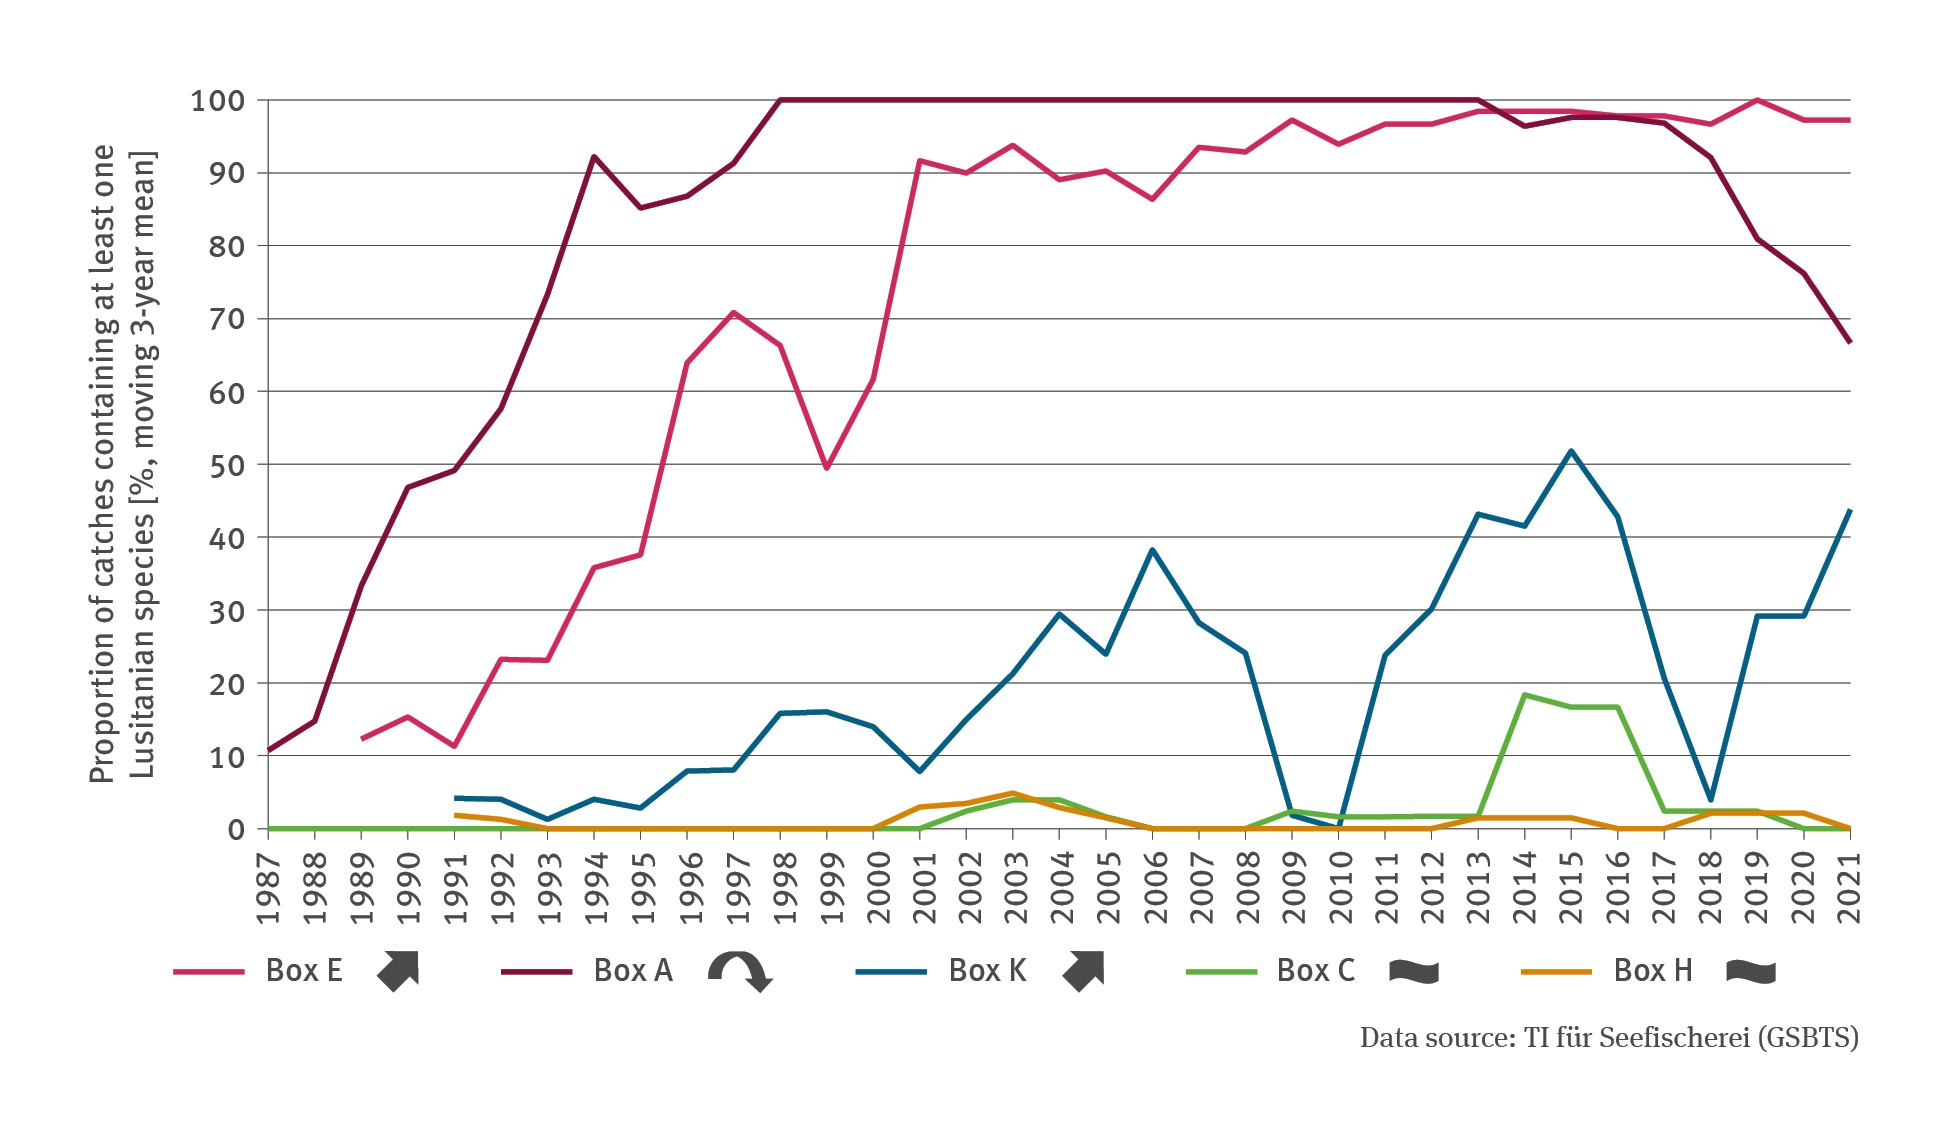
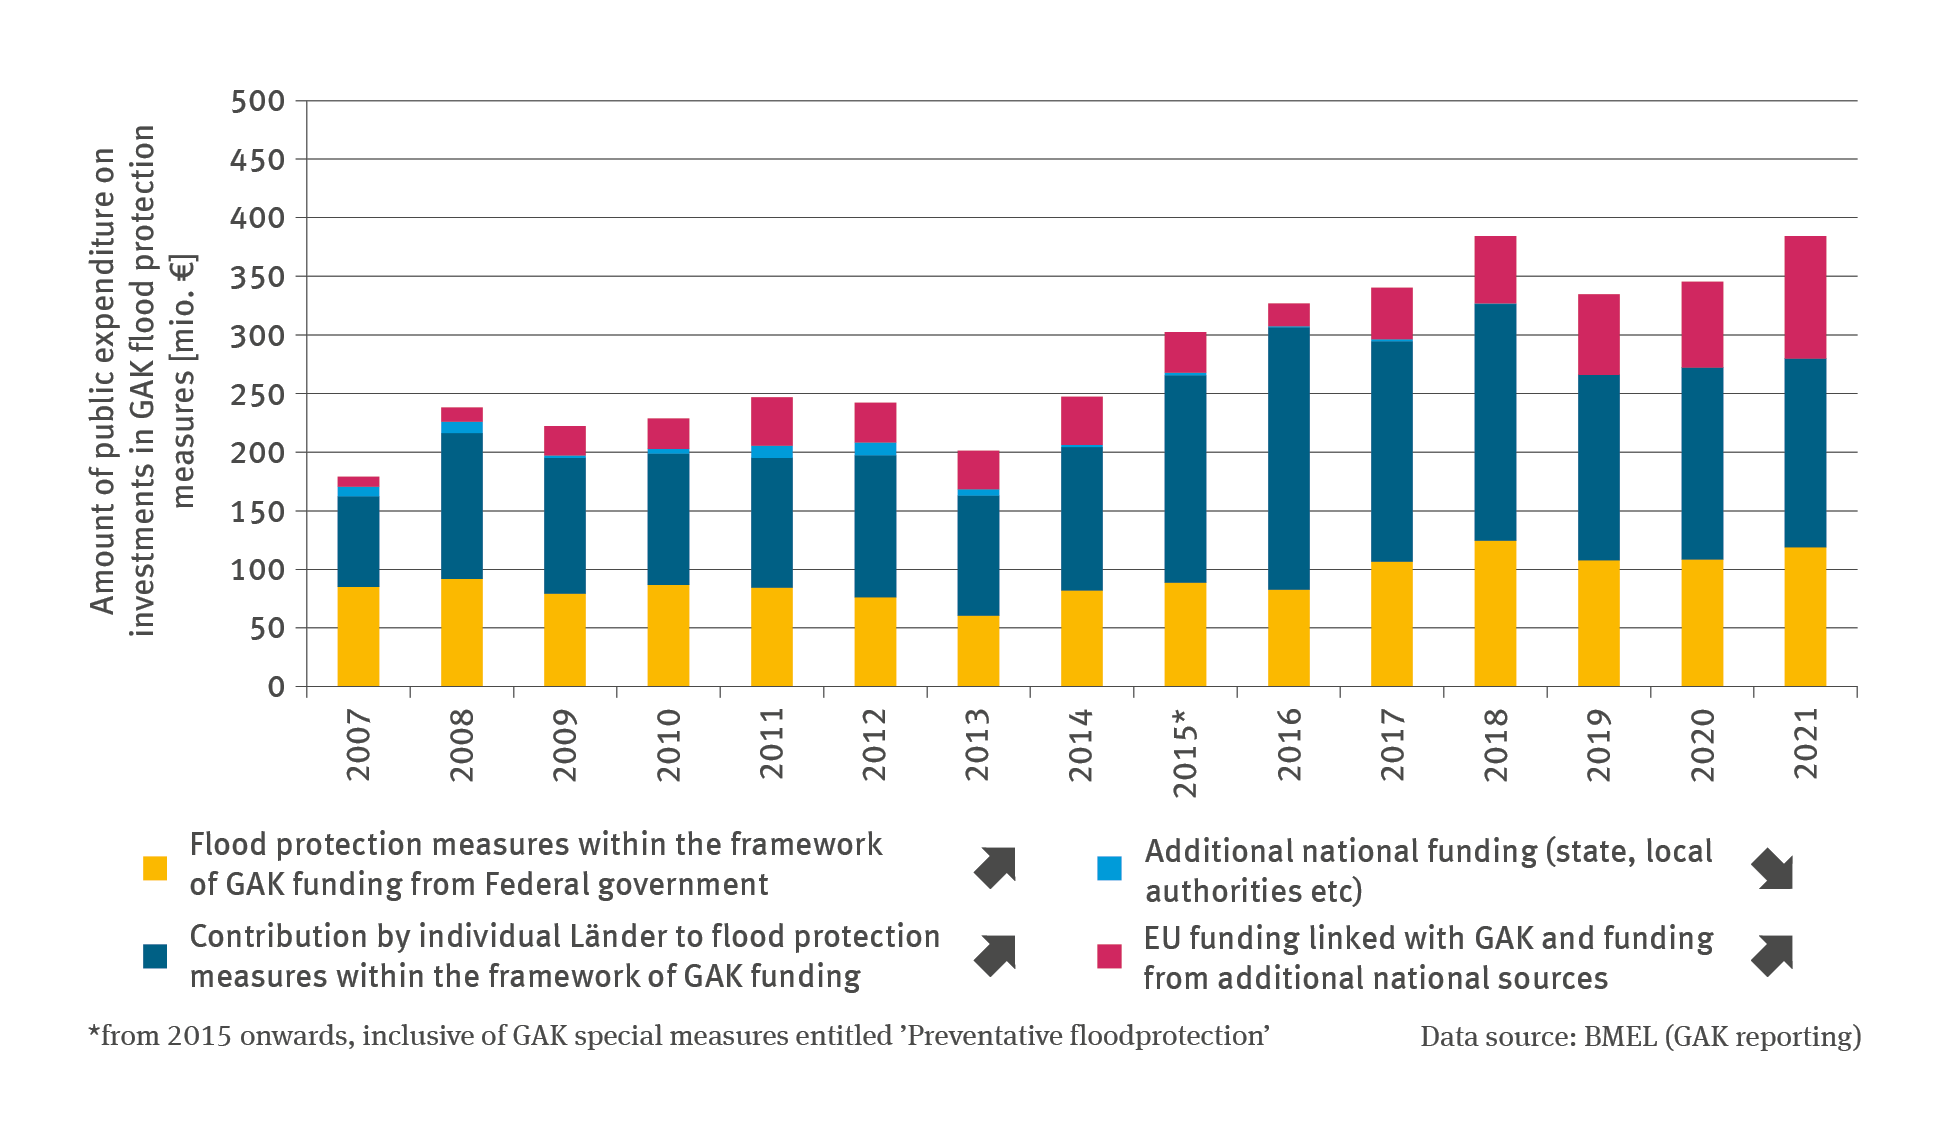
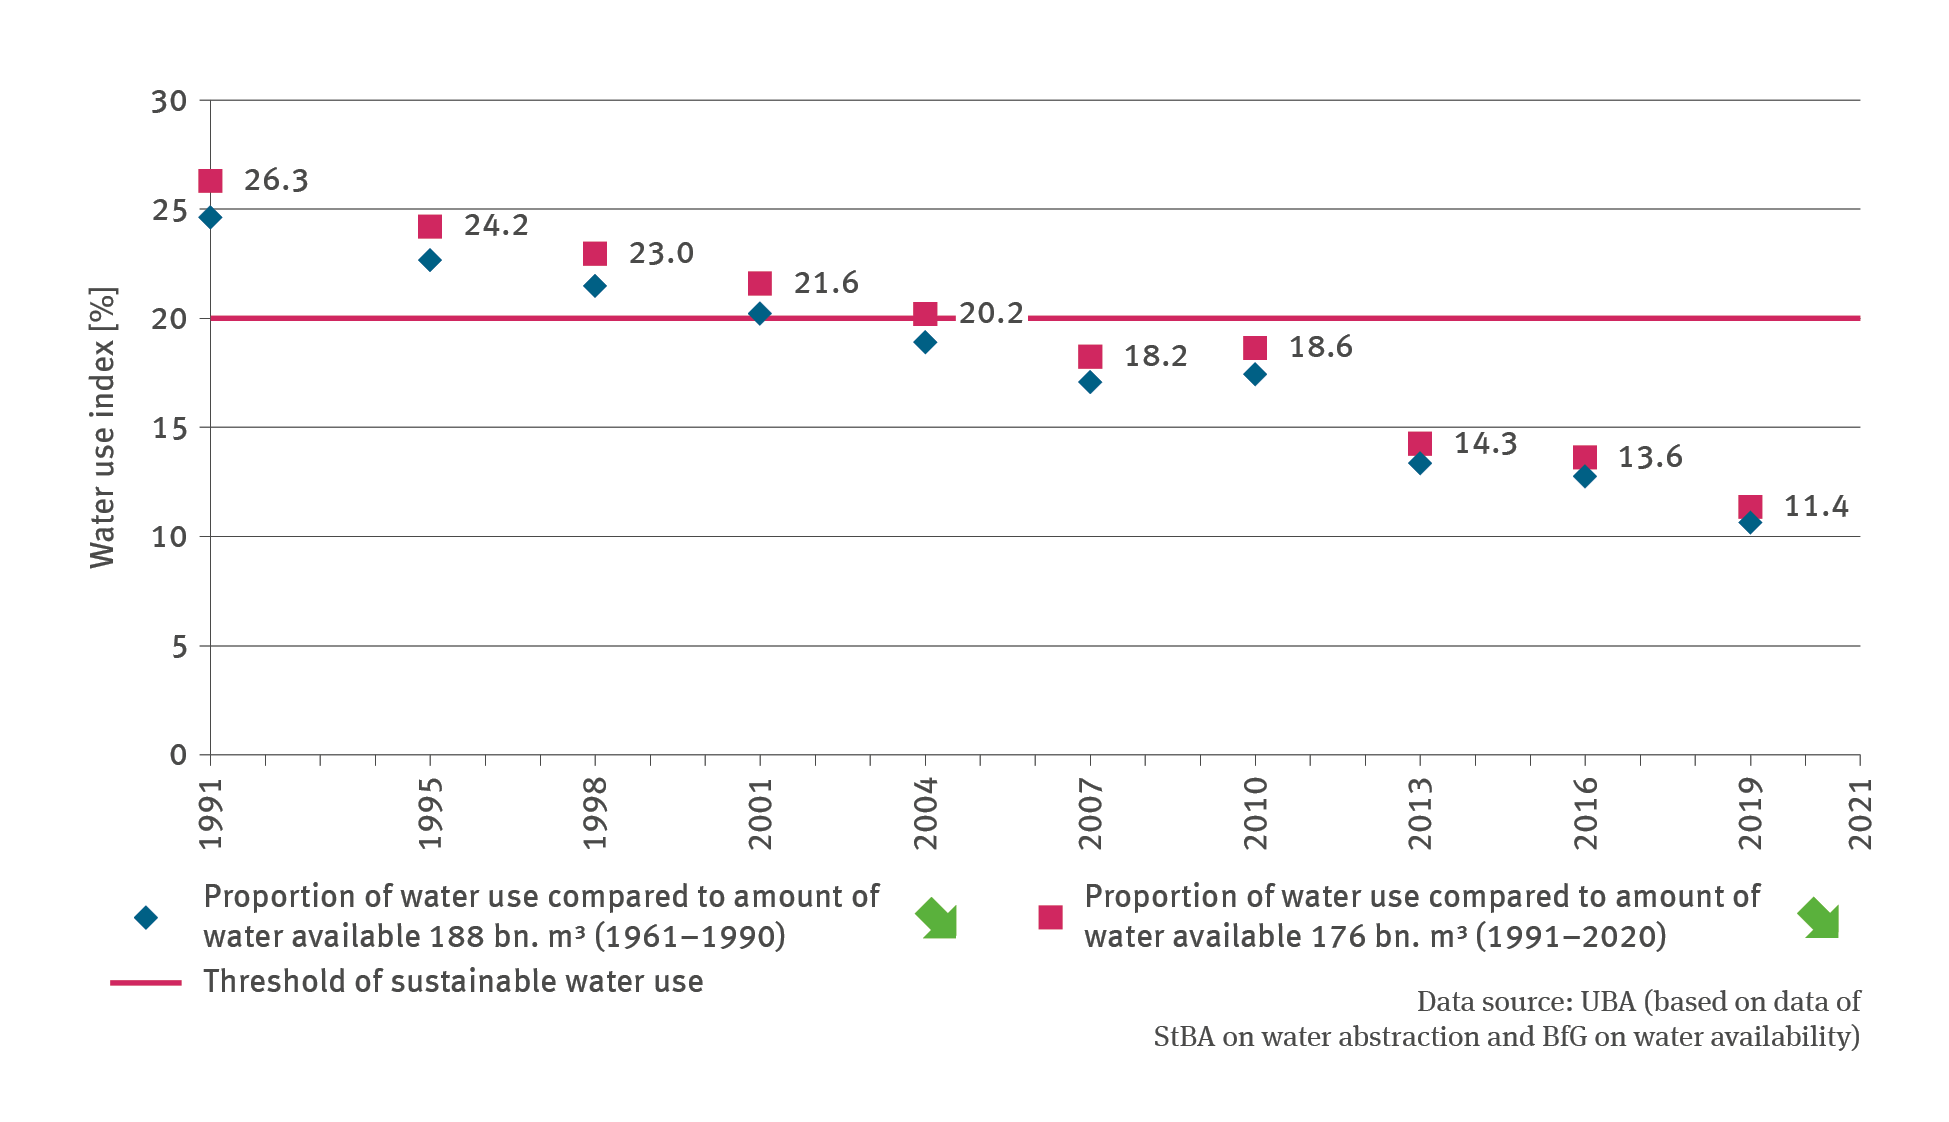
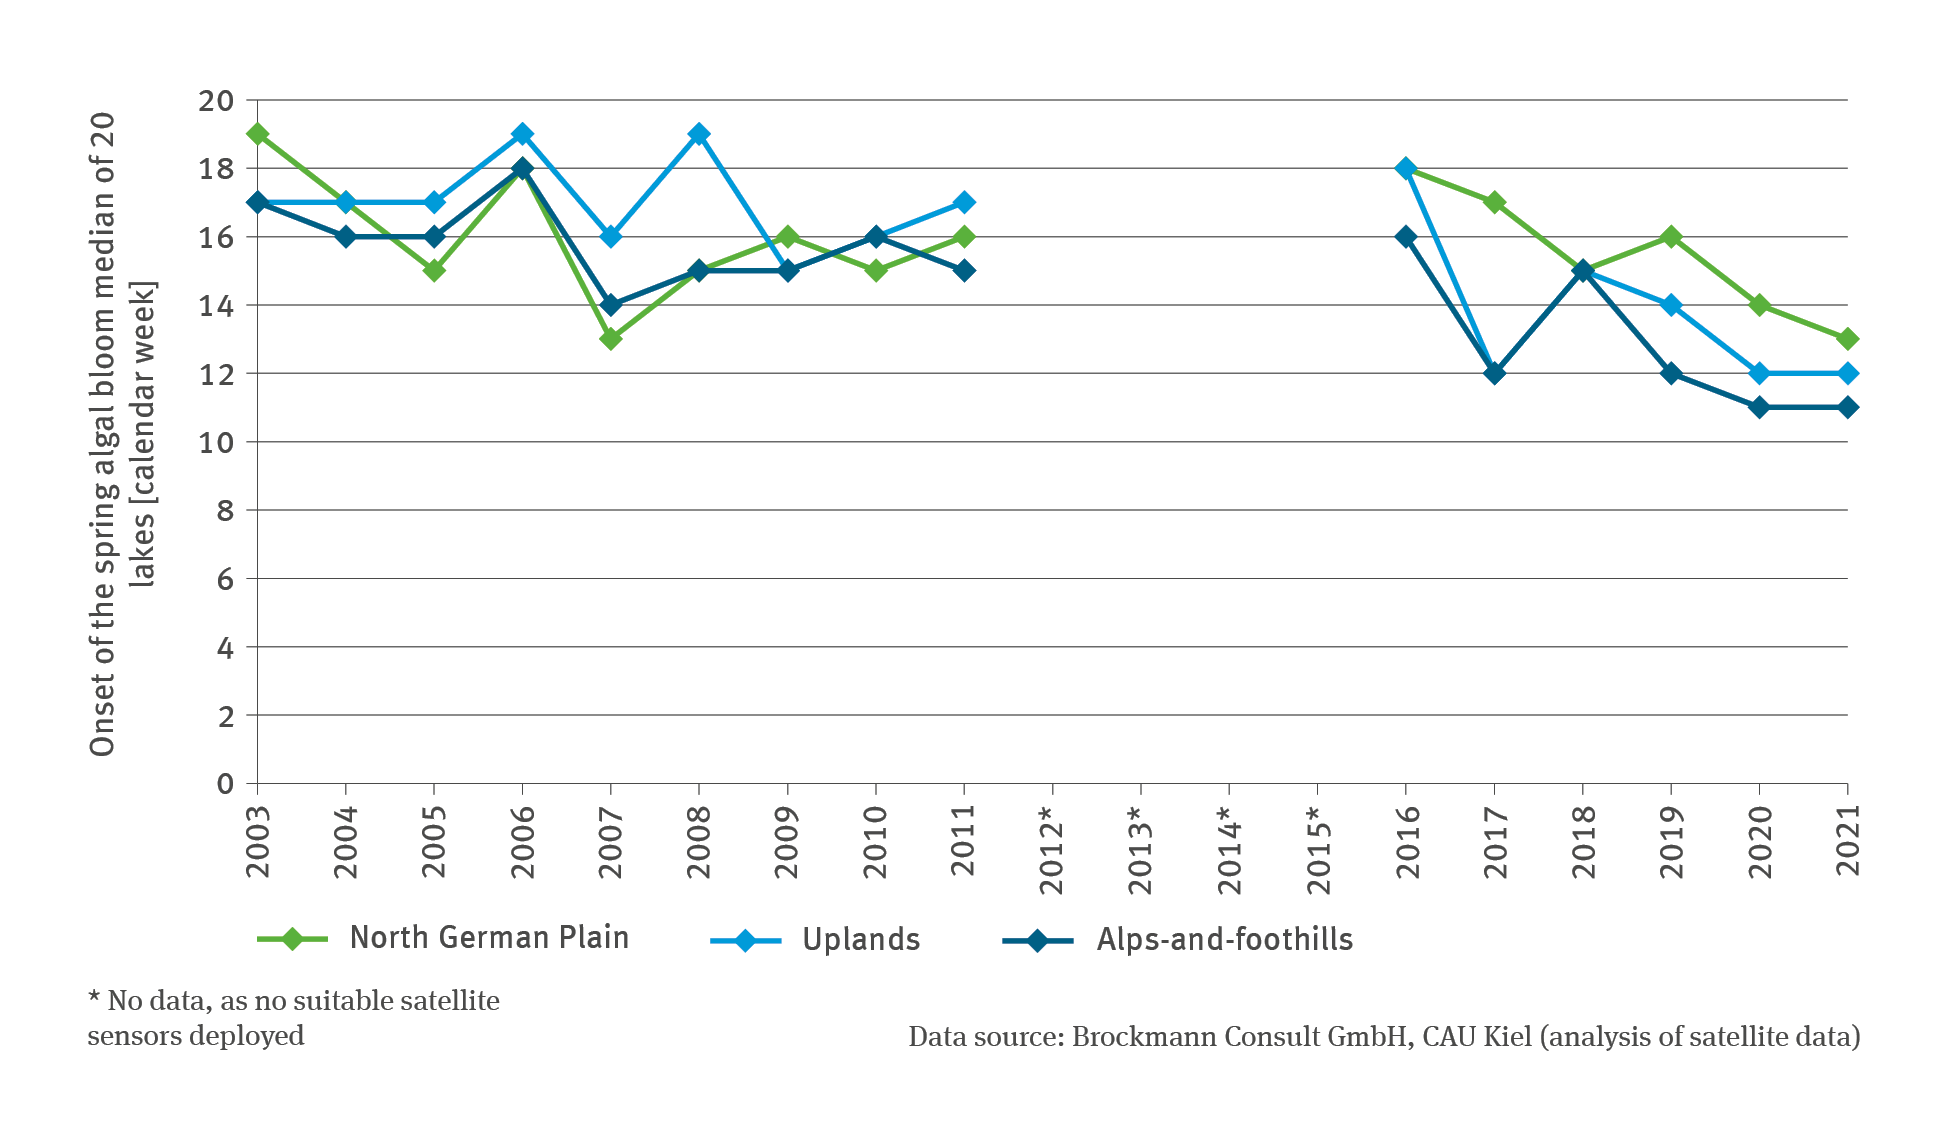
Data Search

Data Search

Here you will find diagrams, infographics, maps and tables for direct download.

Data Search

The illustration entitled VE-I-2 ’Low-water restrictions on the Rhine’ is a grouped bar chart showing the number of days for the period of 1997 to 2021 when the equivalent water level values at the gauges of Maxau (Upper Rhine), Kaub (Middle Rhine) and Ruhrort (Lower Rhine) were not attained. Non-attainment of the equivalent water level signifies restrictions on the draught of vessels navigating the Rhine. There is no significant trend discernible for the Upper Rhine or the Middle Rhine.

VE-I-2: Low-water restrictions to shipping on the Rhine

  • Klima
  • Wasser
  • Verkehr
  • Diagramme
Export data
PNG
The illustration VE-I-1 entitled ’High-water closures on the Rhine’ contains a grouped bar chart which shows closures to Rhine shipping owing to high water when the HSW was reached or exceeded at the gauges of Maxau (Upper Rhine), Kaub (Middle Rhine) and Cologne (Lower Rhine). The number of high-water closures is illustrated, covering the period from 1970 to 2010, and from 2011 to 2021 the aggregated duration of closures in days with reference to quarter-hourly measurements of water levels is shown.

VE-I-1: High-water closures to shipping on the Rhine

  • Klima
  • Wasser
  • Verkehr
  • Diagramme
Export data
PNG
The illustration shows a biaxial diagram. For 2020 the green roof area in 15 cities with a population in excess of 500,000 inhabitants per square metre per inhabitant is illustrated by a bar chart. In addition, the percentage of green roof area in respect of the overall roof area examined is illustrated in dot form. In 2020 the green roof area amounted to 0.8 square metres per inhabitant and to approximately 10 per cent of the overall roof area examined.

BAU-R-2: Green roofs in cities

  • Klima
  • Wasser
  • Umwelt und Wirtschaft
  • Diagramme
Export data
PNG
The stacked column chart in the illustration BAU-I-4 entitled ‘Heavy rain in residential areas’ shows the percentual proportion of settlement area where heavy-rain warning level 3 (tempests) was exceeded in terms of the number of hours. Five categories have been illustrated: 1 to 3 hours, more than 3 to 6 hours, more than 6 to 12 hours, more than 12 to 24 hours, and more than 24 hours. The highest category is represented only in a few years.

BAU-I-4: Heavy rain in residential areas

  • Klima
  • Wasser
  • Umwelt und Wirtschaft
  • Diagramme
Export data
PNG
The illustration contains a line chart which indicates the development of soil water reserves in agriculturally used soils as a percentage of usable field capacity. The time series extends from 1961 to 2021.

BO-I-1: Soil water in agriculturally used soils

  • Klima
  • Fläche, Boden, Land-Ökosysteme
  • Wasser
  • Land- und Forstwirtschaft
  • Diagramme
Export data
PNG
The illustration contains a column chart which shows the number of herring larvae in the Greifswalder Bodden (N20-Index) in millions.

FI-I-2: Herring larvae in the Greifswalder Bodden

  • Klima
  • Wasser
  • Diagramme
Export data
PNG
Six curves show the percentage of catches with at least one Lusitanian fish species for different boxes in a time series from 1987 to 2013. The time series for Box C runs close to the 0 axis with a maximum value of just under 20 per cent in 2014. The curve for Box H is similar, with a maximum of around 5 per cent in 2003.
Export data
PNG
The stacked columns chart WW-R-2 ‘GAK funds for flood protection’ shows the amount of public expenditure on investments made in flood protection measures in million Euros from Federal Government funding, Länder funding, and from additional national funding as well as EU funding during the time series 2007 to 2021. The expenditure has increased significantly since 2013 reaching its highest point in 2018 with just under 400 million Euros. It was possible to reach the same level in 2021.

WW-R-2: GAK funds for flood protection

  • Klima
  • Wasser
  • Diagramme
Export data
PNG
The XY scatter chart WW-R-1 ’Water use index’ shows the development of the water use index between 1991 and 2021. Two time series show the water use index as a percentual proportion of water use compared to the available water supply in the amount of 188 billion cubic metres, which is the mean of available water resources in the years of 1961 to 1990, and as a percentual proportion of water use compared to the available water supply in the amount of 176 billion cubic metres.

WW-R-1: Water use index

  • Klima
  • Wasser
  • Diagramme
Export data
PNG
The line chart WW-I-9 ’Spring algal bloom in lakes’ shows the calendar week with the onset of spring algal bloom – for the years 2003 to 2021 and for the North German Plain, the uplands as well as the Alps-and-foothills. In each case the median is stated for 20 selected lakes. There are no data available for the years of 2012 to 2015. Depending on the region, spring algal bloom in 2003 still occurred in the calendar weeks 17 to 19, whereas in 2021, this process began as early as the calendar weeks 11 to 13.

WW-I-9: Spring algal bloom in lakes

  • Klima
  • Wasser
  • Diagramme
Export data
PNG

You can also search in other data portals of the German Environment Agency

Short link: www.umweltbundesamt.de/n300701en