The XY scatter chart WW-R-1 ’Water use index’ shows the development of the water use index between 1991 and 2021. Two time series show the water use index as a percentual proportion of water use compared to the available water supply in the amount of 188 billion cubic metres, which is the mean of available water resources in the years of 1961 to 1990, and as a percentual proportion of water use compared to the available water supply in the amount of 176 billion cubic metres.
WW-R-1: Water use index
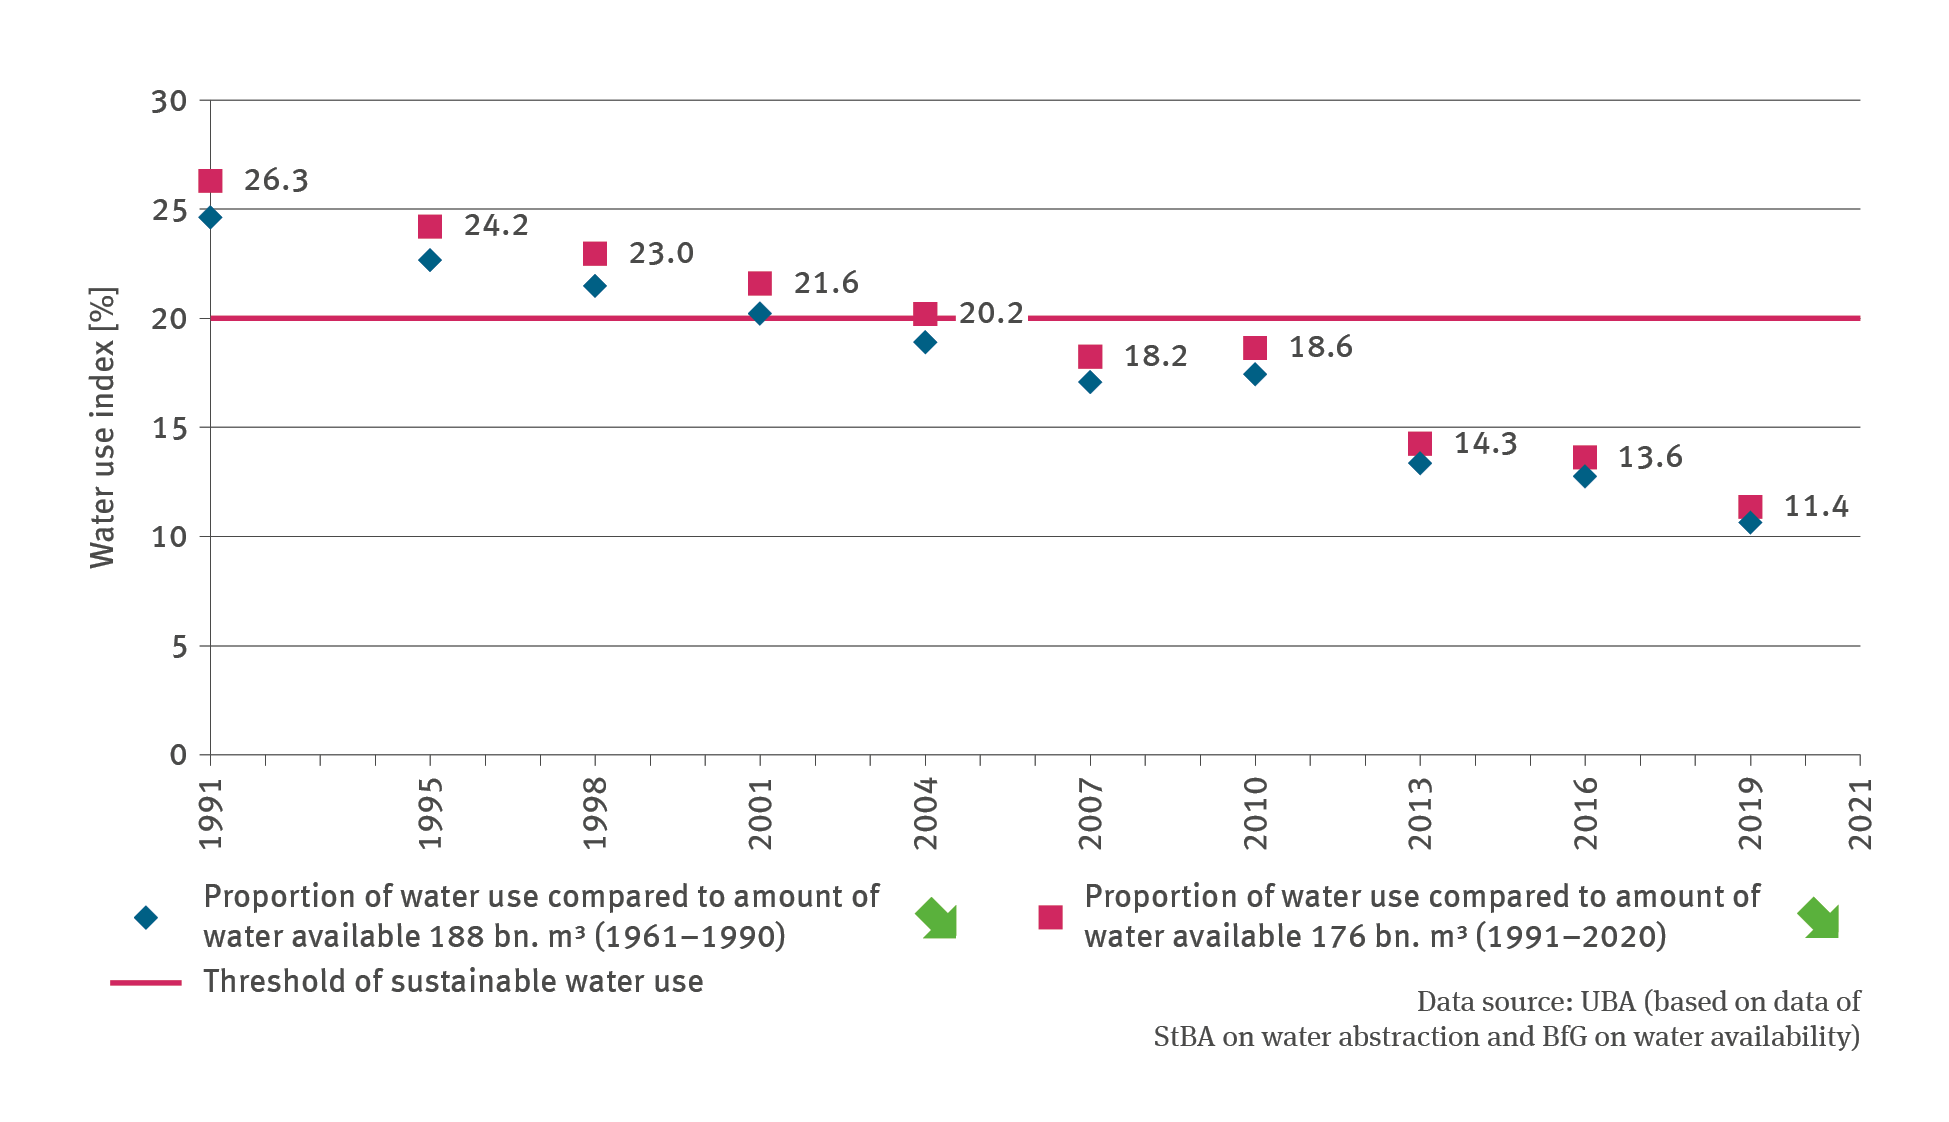
Source: UBA (based on data of StBA on water abstraction and BfG on water availability)image download

The following pages contain this image or document

The Umweltbundesamt

For our environment