Skip to main content Skip to main menu Skip to footer

FI-I-1: Distribution of thermophilic marine species

Six curves show the percentage of catches with at least one Lusitanian fish species for different boxes in a time series from 1987 to 2013. The time series for Box C runs close to the 0 axis with a maximum value of just under 20 per cent in 2014. The curve for Box H is similar, with a maximum of around 5 per cent in 2003.
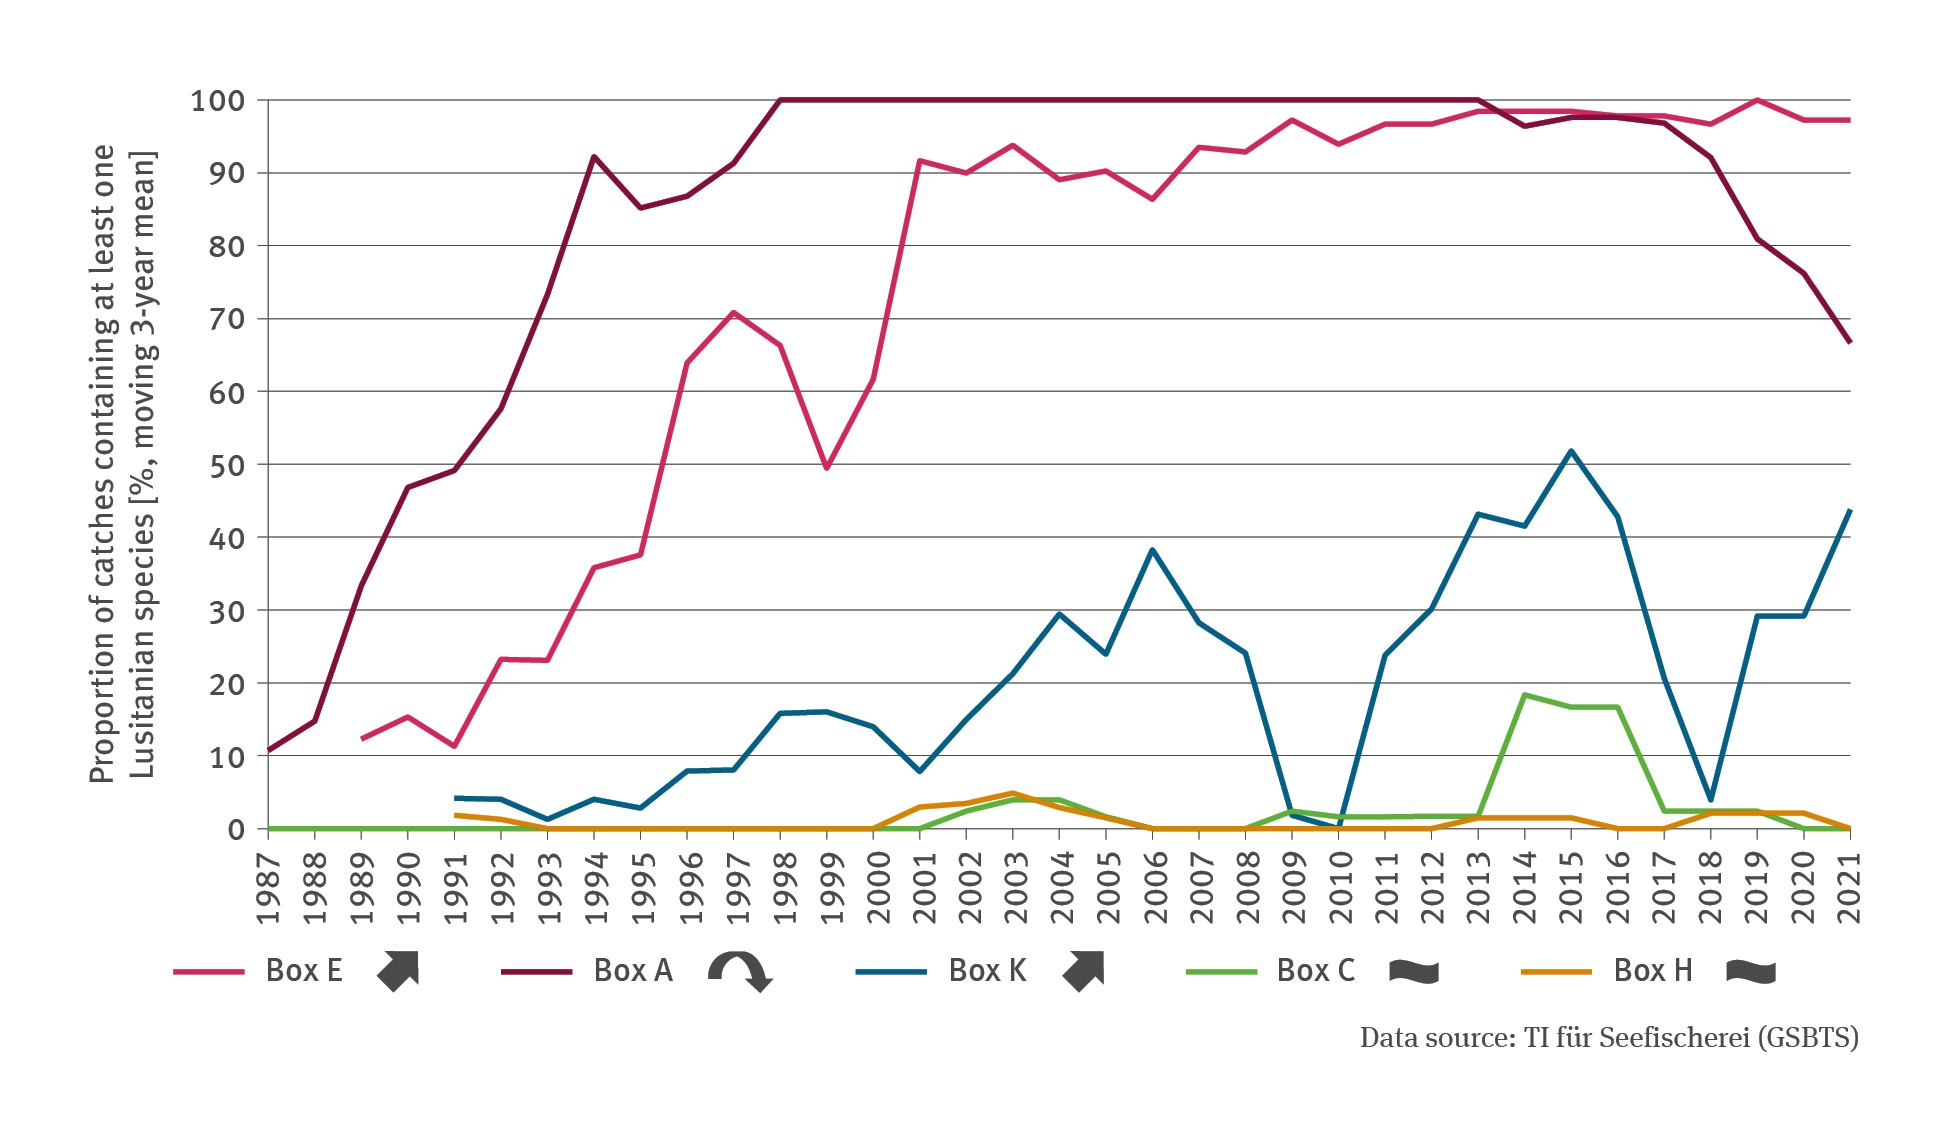
Source: Thünen-Institut für Seefischerei (GSBTS: German Small-scale Bottom Trawl Survey)
Download image (156.45 kB)

The following contents contain this medium:

Tags

Short link: www.uba.de/m42722en