Data Search

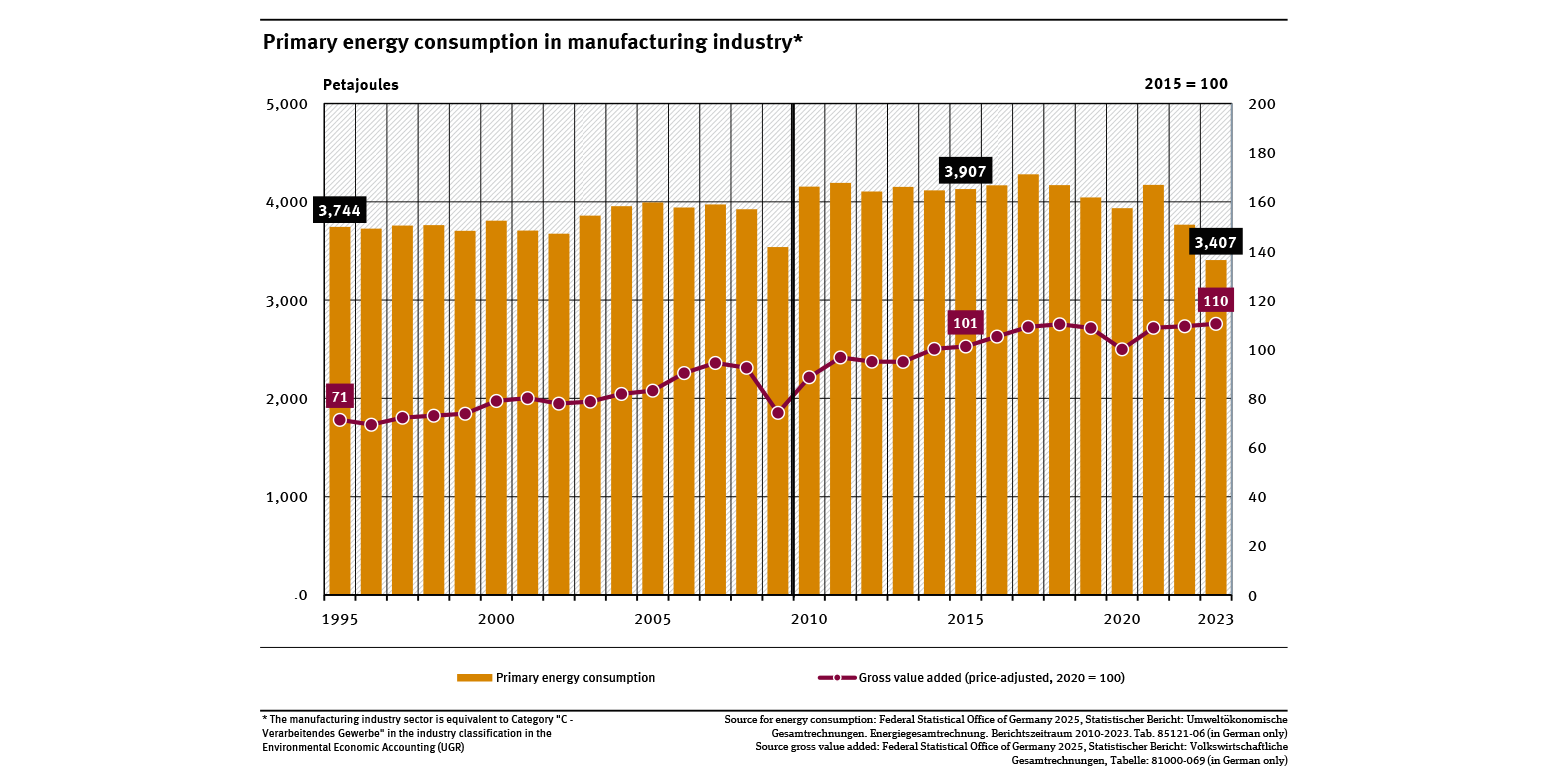
Primary energy consumption in manufacturing industry
- Energie
- Umwelt und Wirtschaft
- Diagramme
- Umwelt-Indikatoren
- Daten und Tabellen

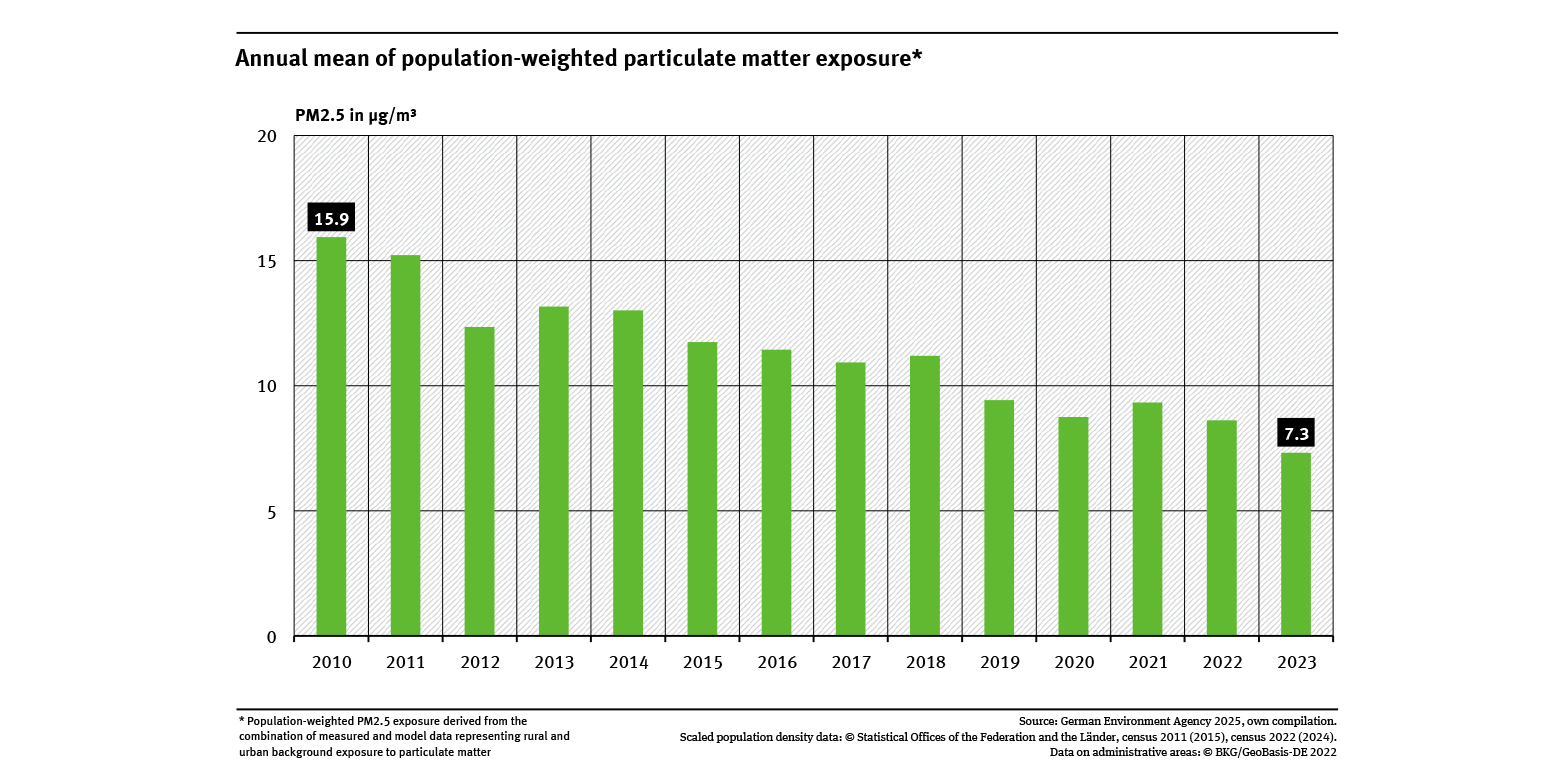
Annual mean of population-weighted particulate matter exposure
- Luft
- Umwelt und Gesundheit
- Diagramme
- Umwelt-Indikatoren
- Daten und Tabellen


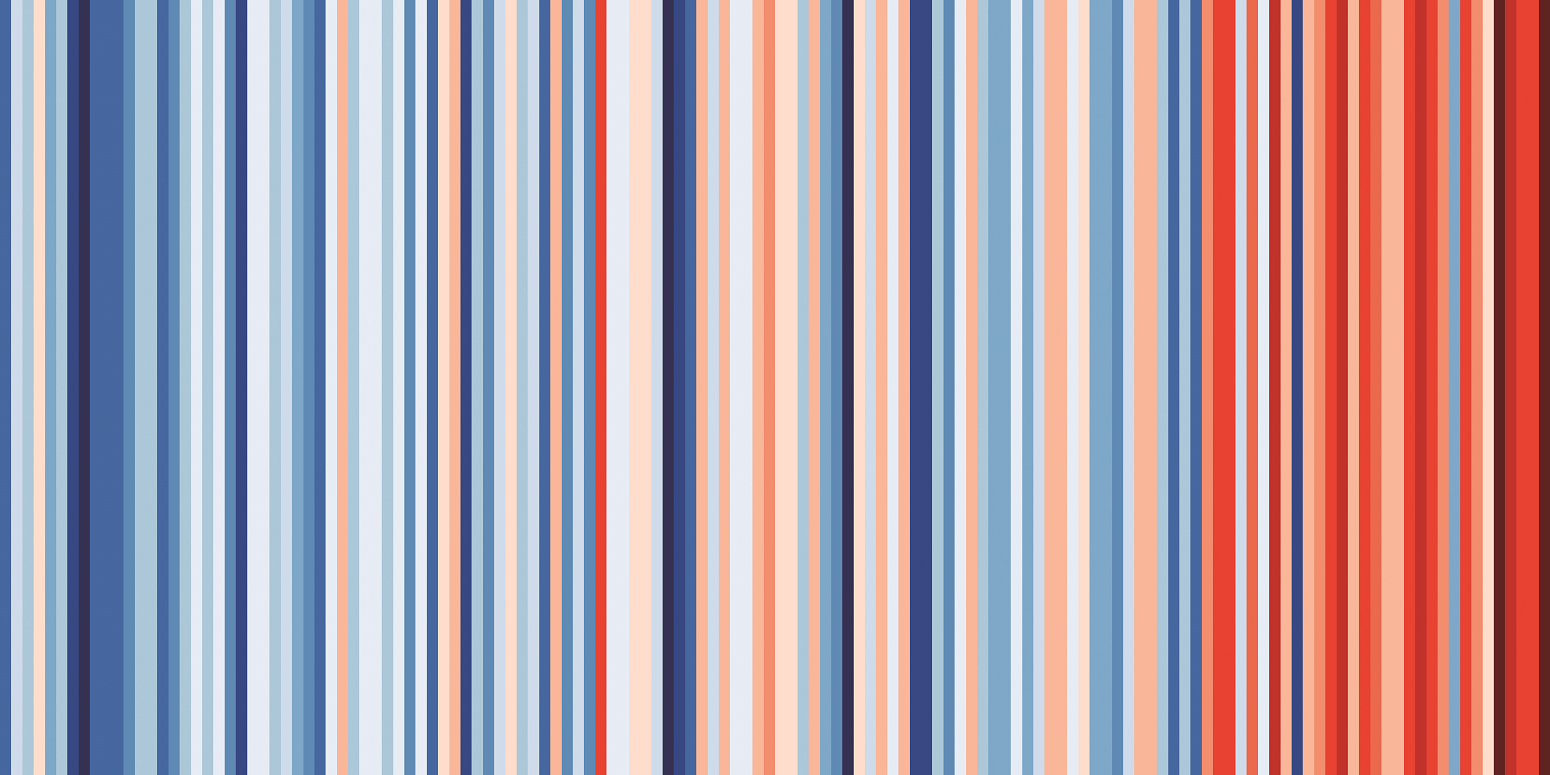
Figure 1: Chart of average temperature for Germany between 1881 and 2018
- Klima
- Infografiken
Export data

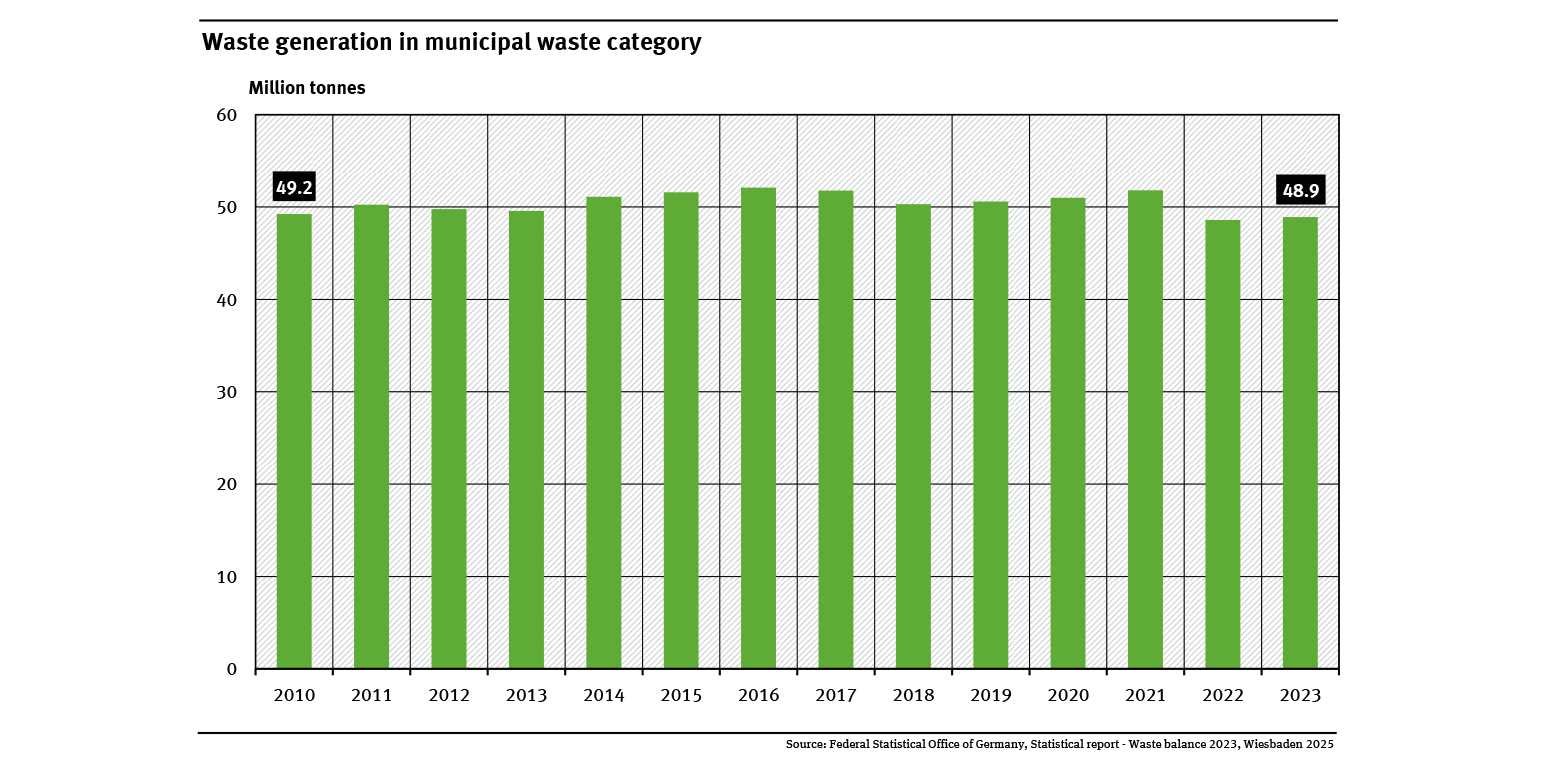
Waste generation in municipal waste category
- Ressourcen und Abfall
- Diagramme
- Umwelt-Indikatoren
- Daten und Tabellen

Final energy consumption
- Energie
- Diagramme
- Umwelt-Indikatoren
- Daten und Tabellen

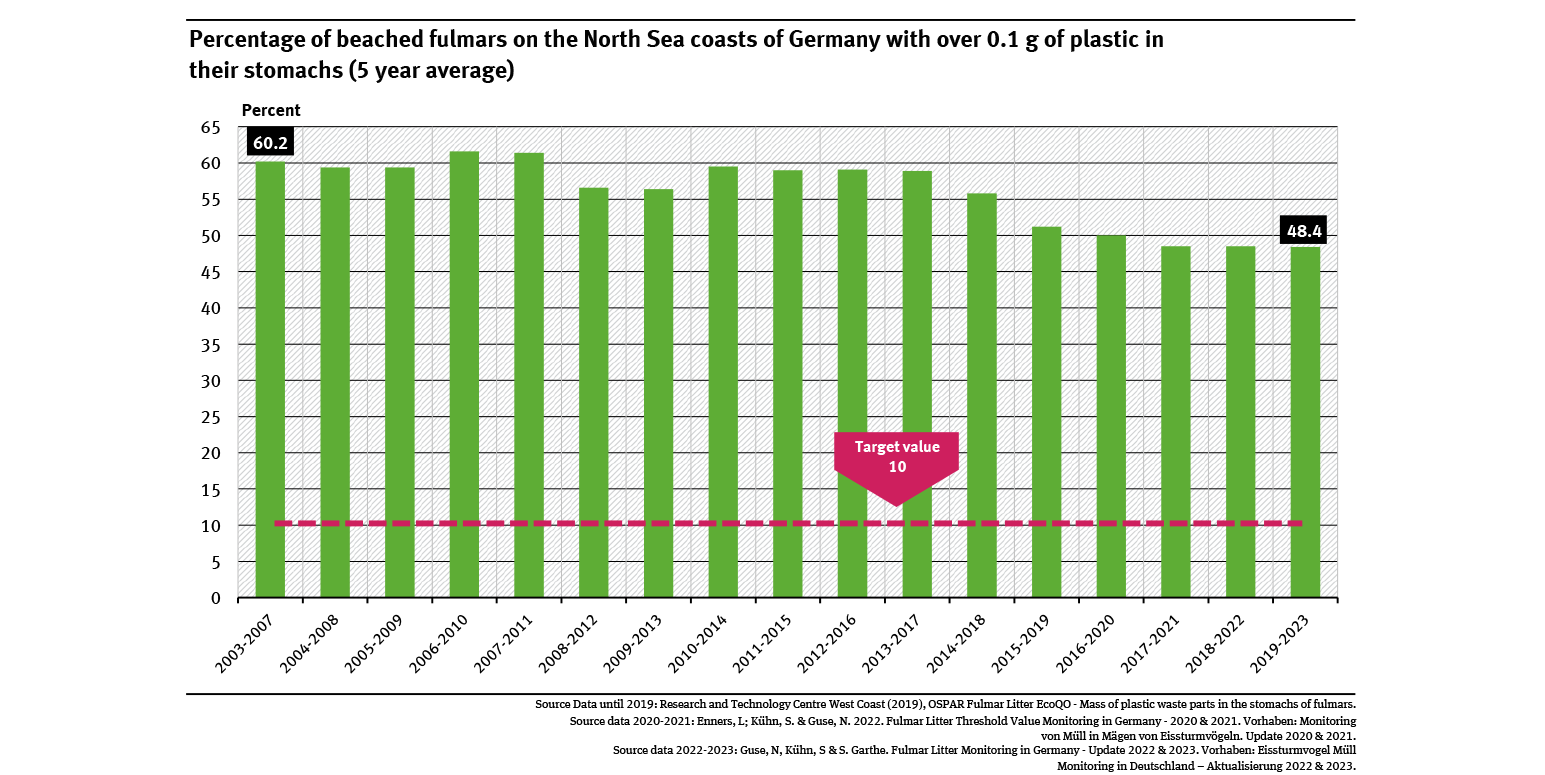
Percentage of beached fulmars on the North Sea coasts of Germany with over 0.1 g of plastic ...
- Wasser
- Diagramme
- Umwelt-Indikatoren
- Daten und Tabellen

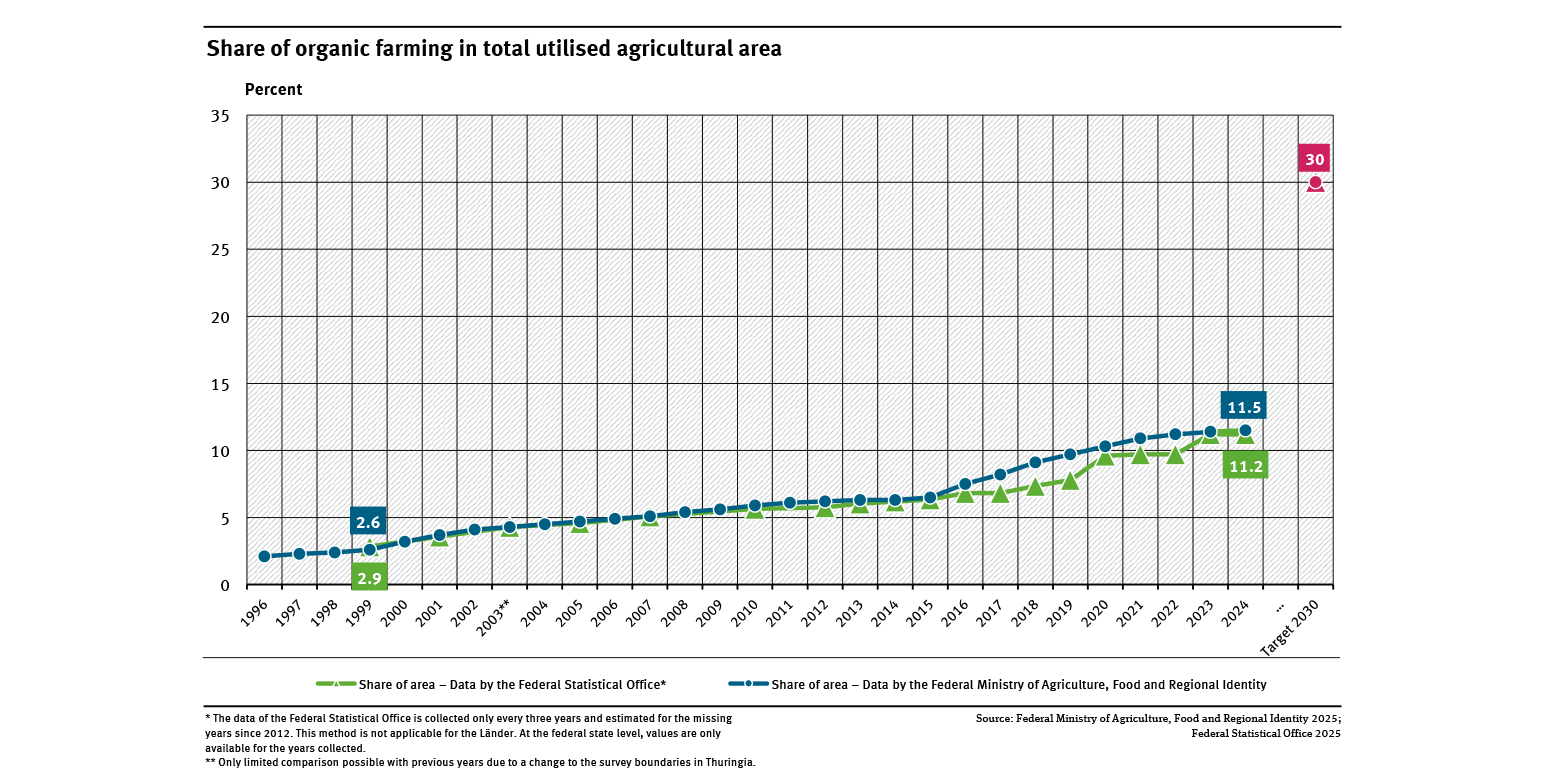
Share of organic farming in total utilised agricultural area
- Land- und Forstwirtschaft
- Diagramme
- Umwelt-Indikatoren
- Daten und Tabellen