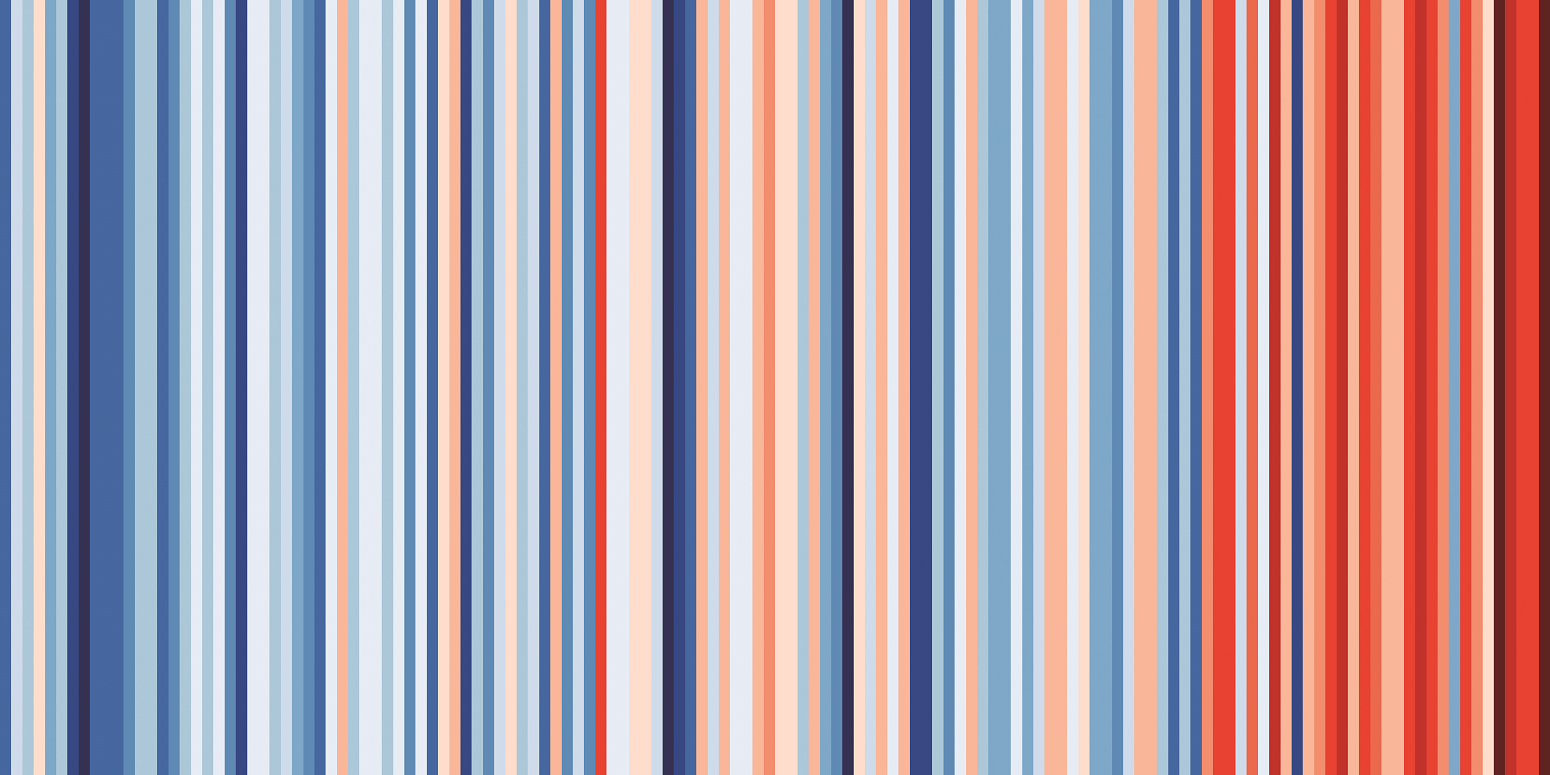
Figure 1: Chart of average temperature for Germany between 1881 and 2018 (each stripe representing one year, based on the DWD’s dataset)
Source: Ed Hawkins / showyourstripes.info
Download image (895.14 kB)