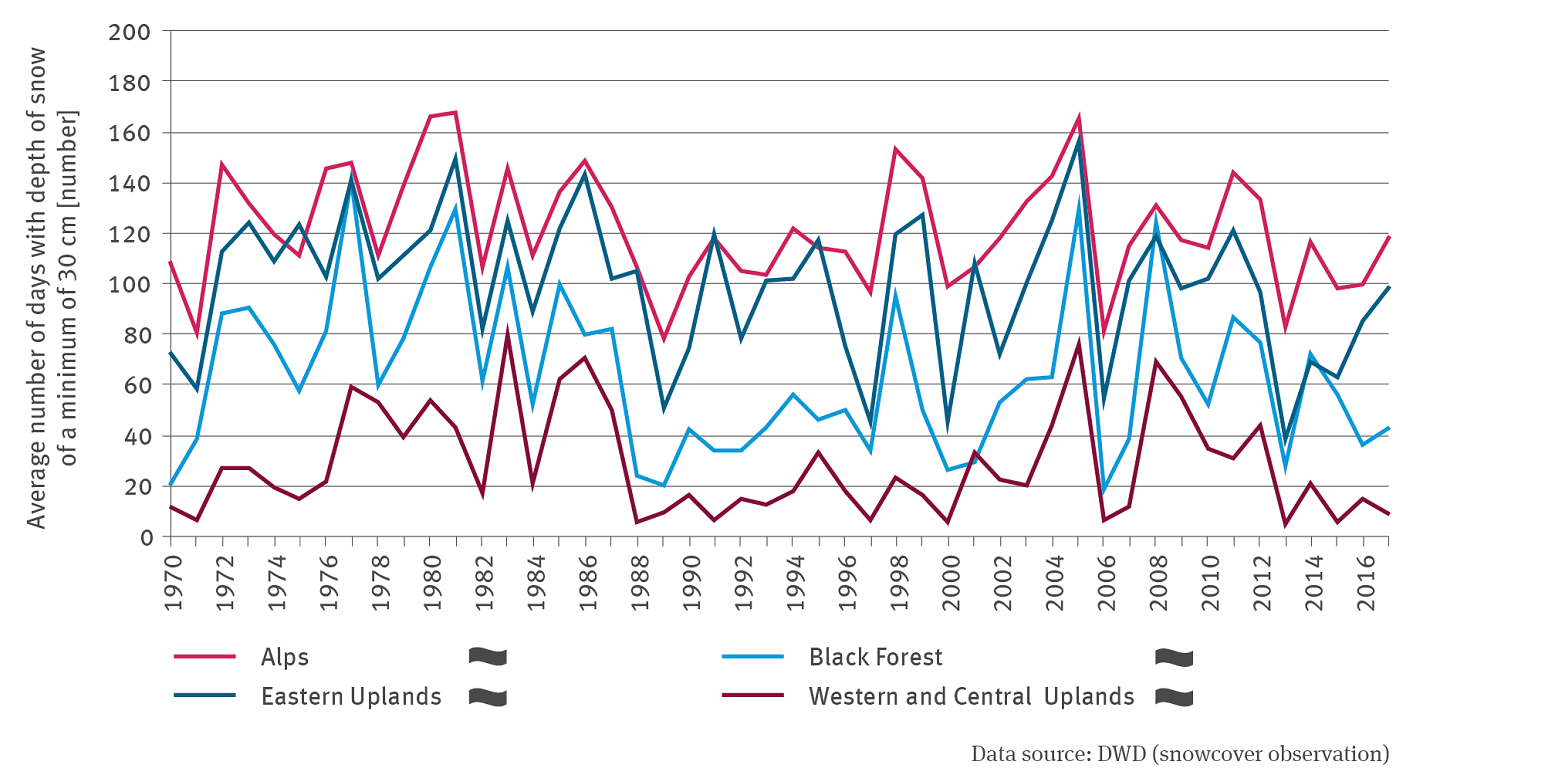
The line graph represents the number of days with snow depths of at least 30 centimetres in the Alps, the Black Forest, the Eastern Central Uplands and the Western and Central Central Uplands from 1970 to 2017. In all cases there is no trend. The values fluctuate very strongly between the years. The values are highest in all years for the Alps, followed by the eastern low mountain ranges, then the Black Forest, then the western and central low mountain ranges with the fewest snow days.
Source: DWD (snowcover observation)
Download image (304.83 kB)