Data Search

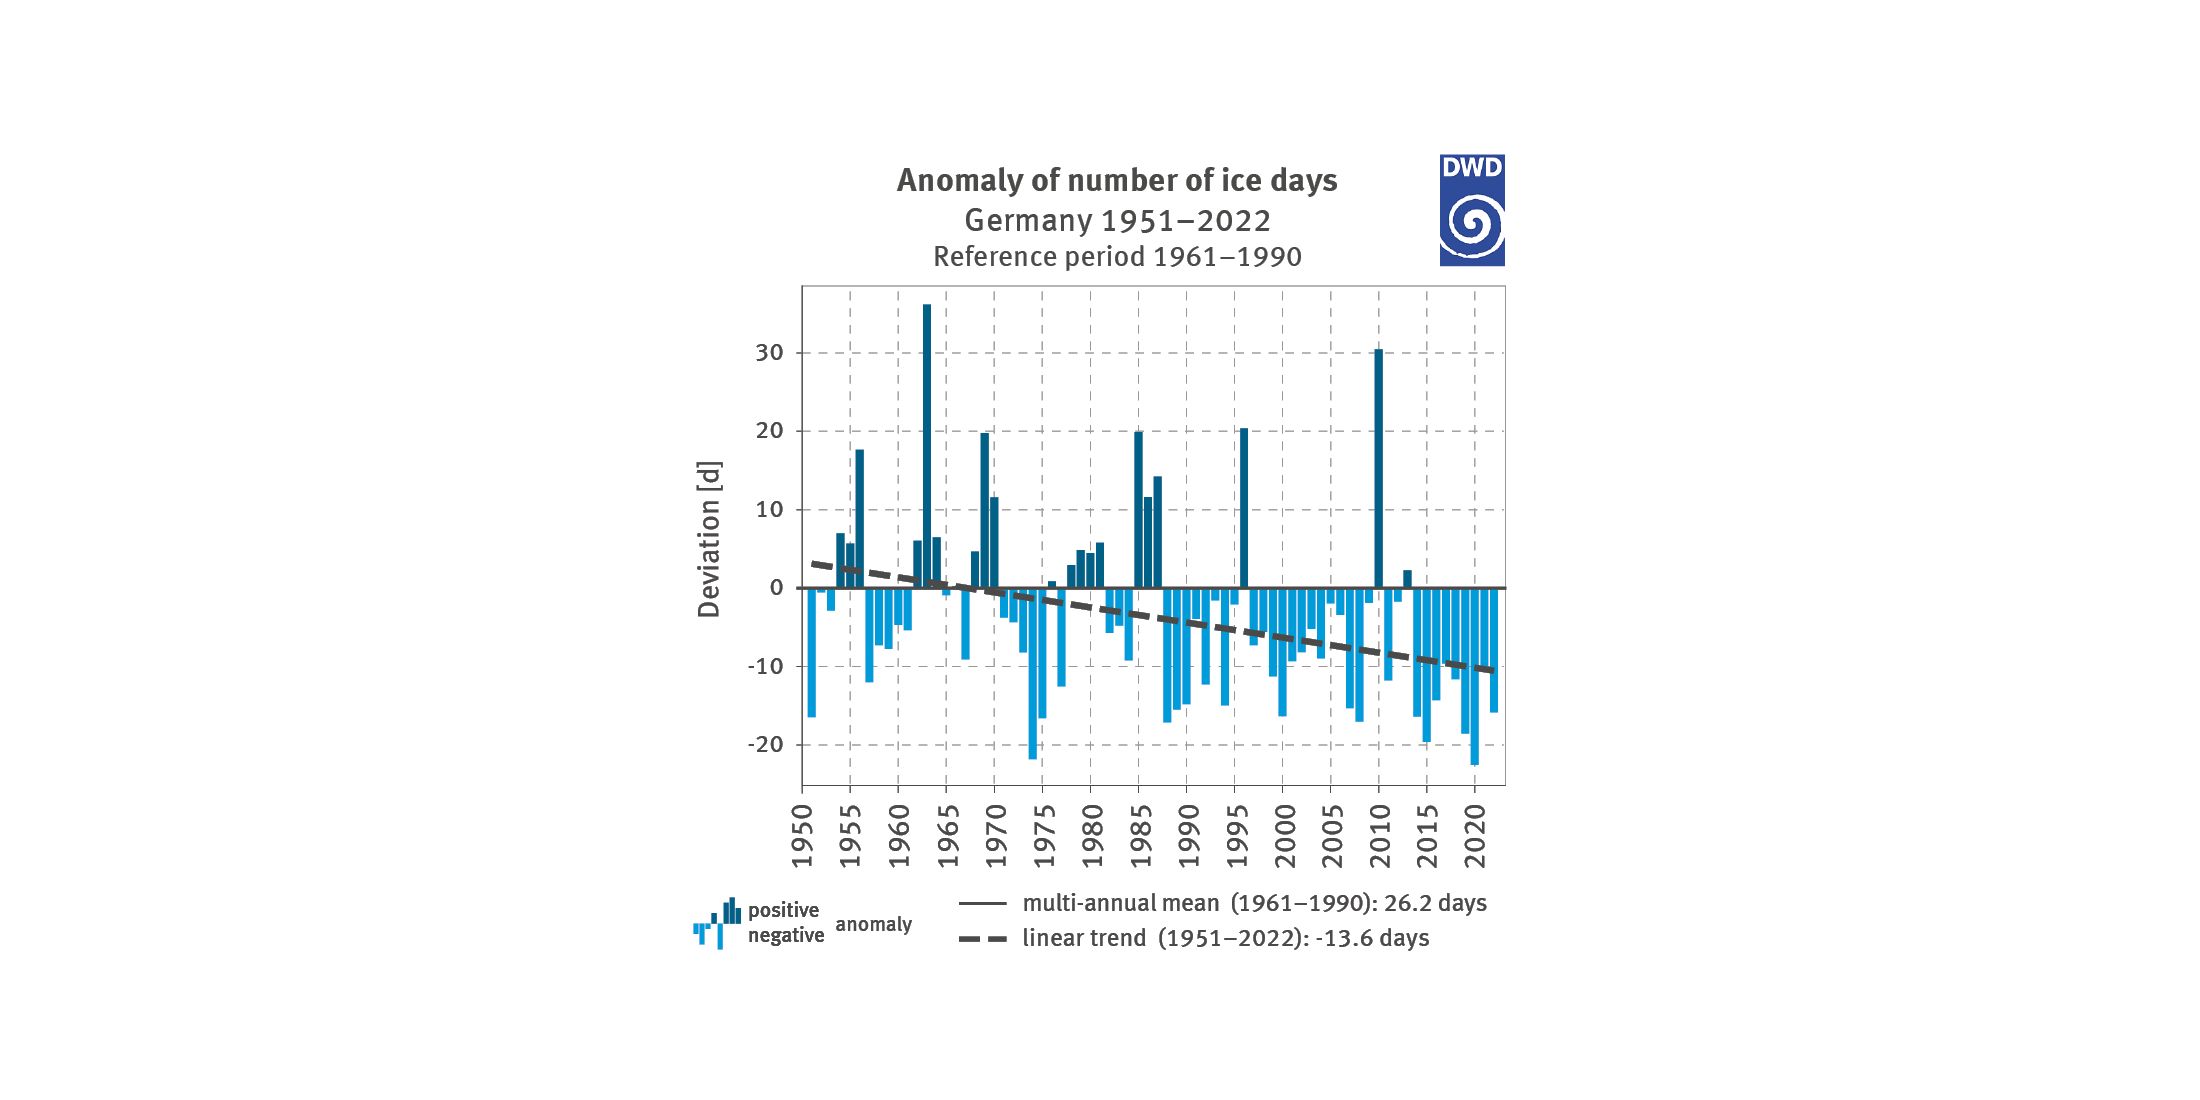
Figure 5: Deviation of the number of hot days for Germany from the multi-annual mean 1961–1990
- Klima
- Diagramme
Export data


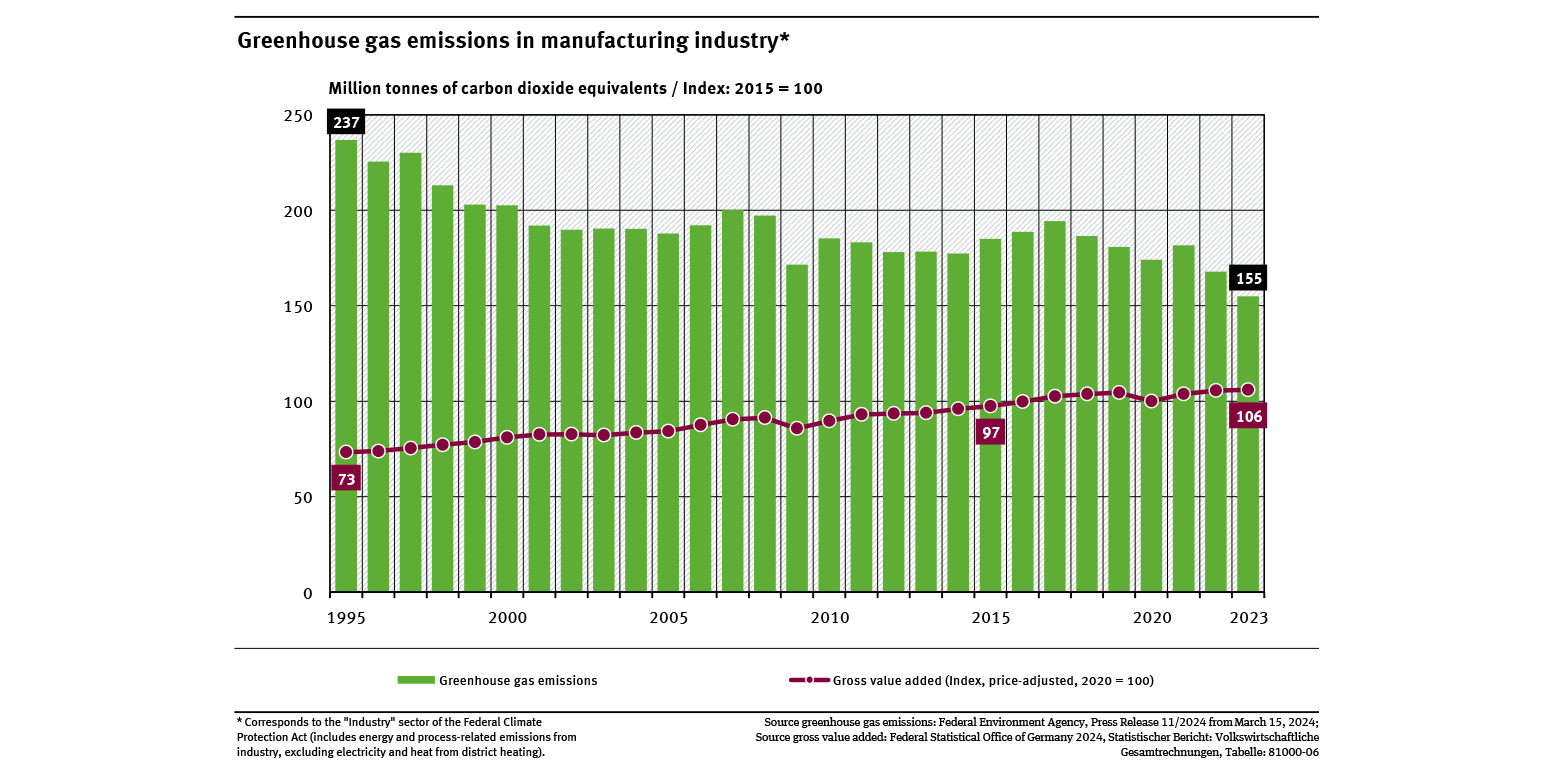
Greenhouse gas emissions in manufacturing industry
- Klima
- Umwelt und Wirtschaft
- Diagramme
- Umwelt-Indikatoren
- Daten und Tabellen

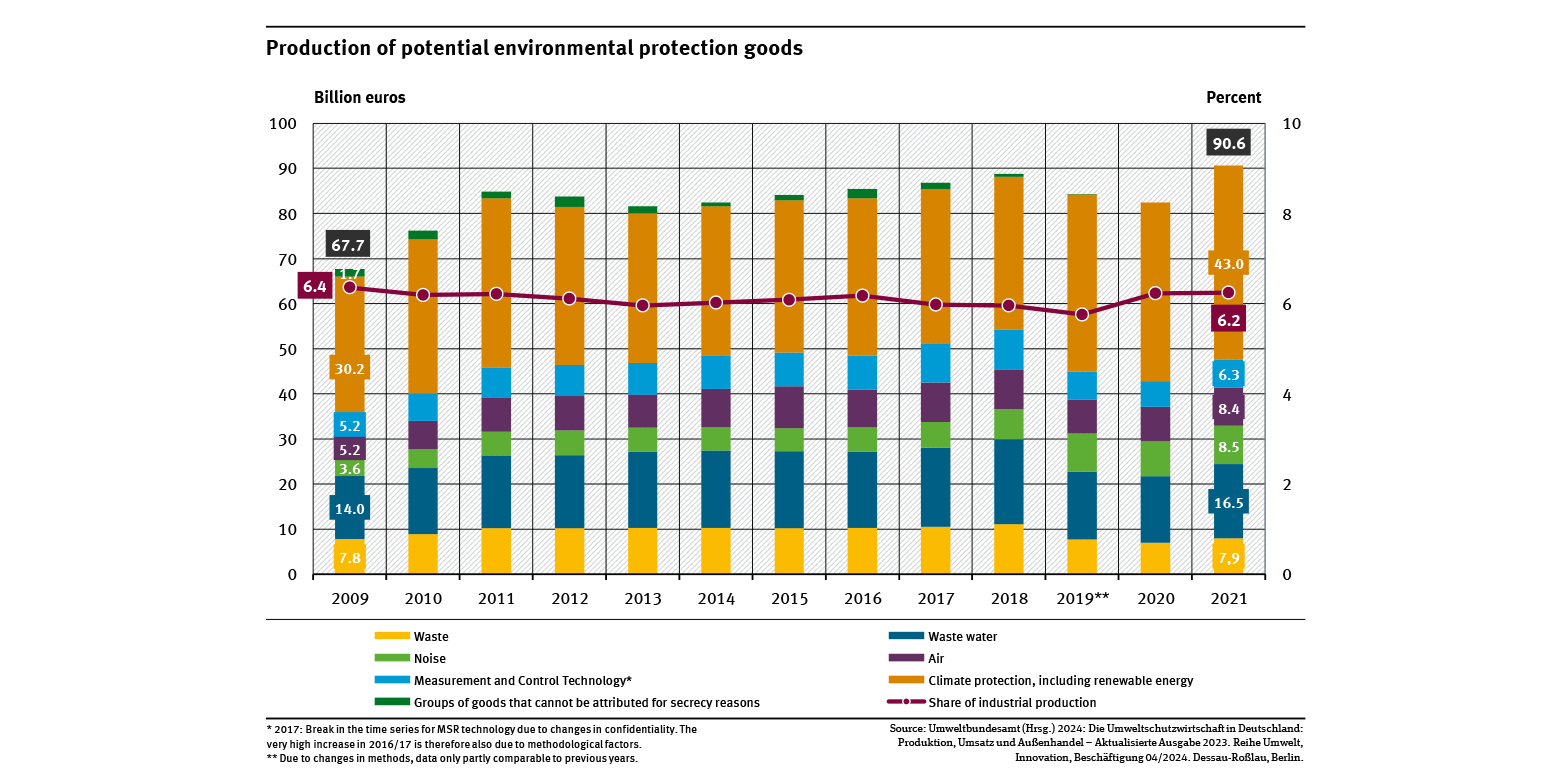
Production of potential environmental protection goods
- Umwelt und Wirtschaft
- Diagramme
- Umwelt-Indikatoren
- Daten und Tabellen

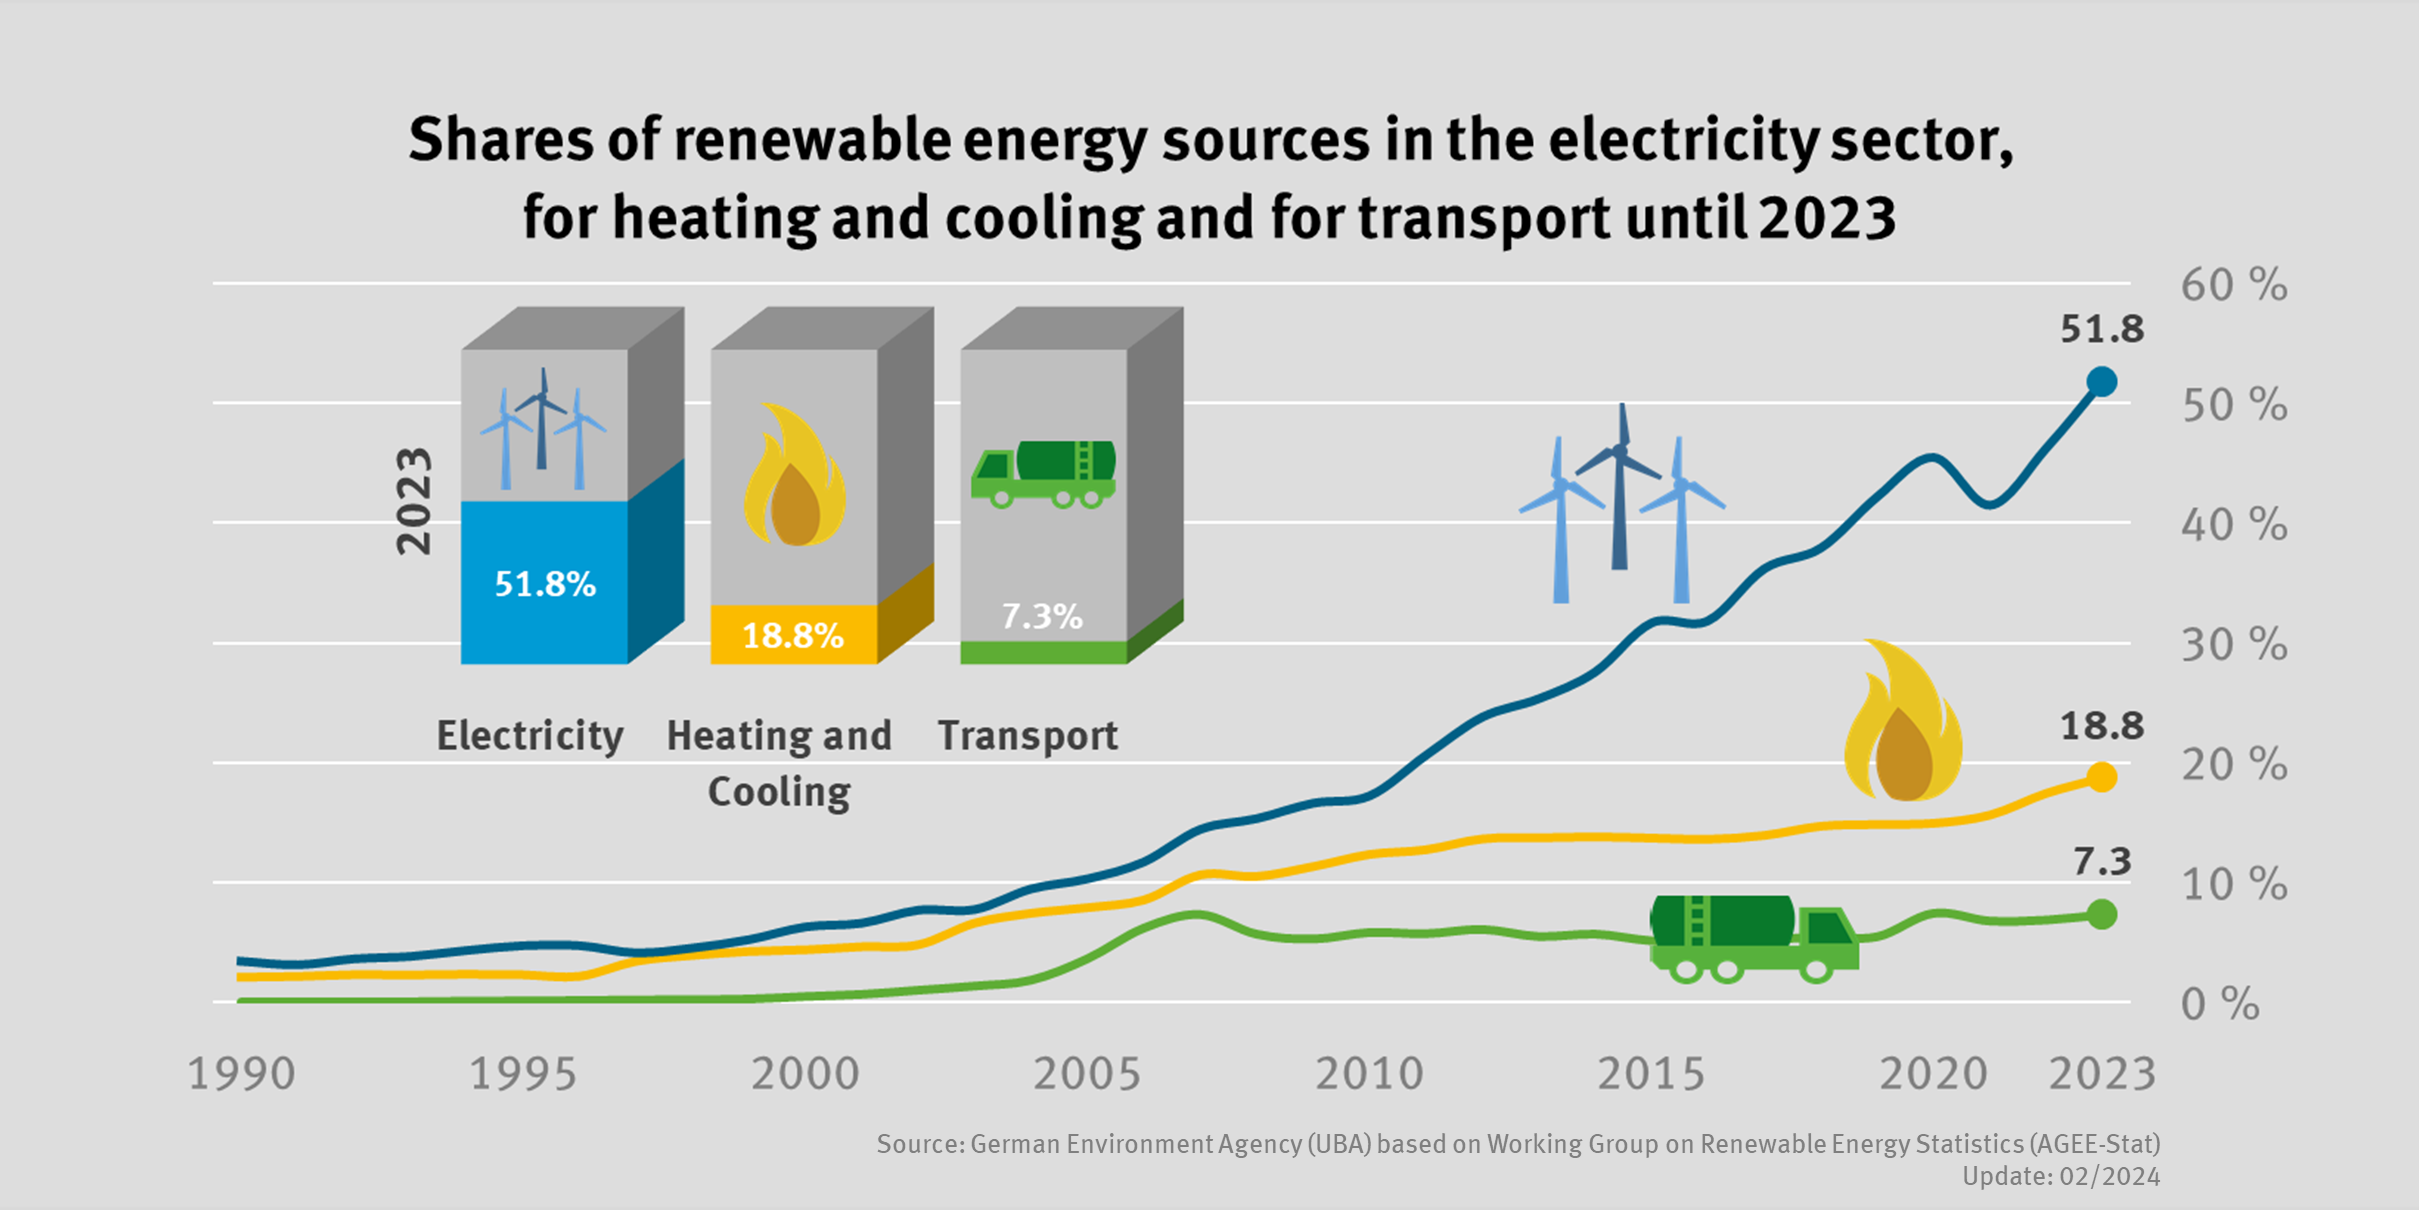
The share of renewable energies in the electricity, heating and transport sectors rose again in 2023
- Energie
- Diagramme
Export data

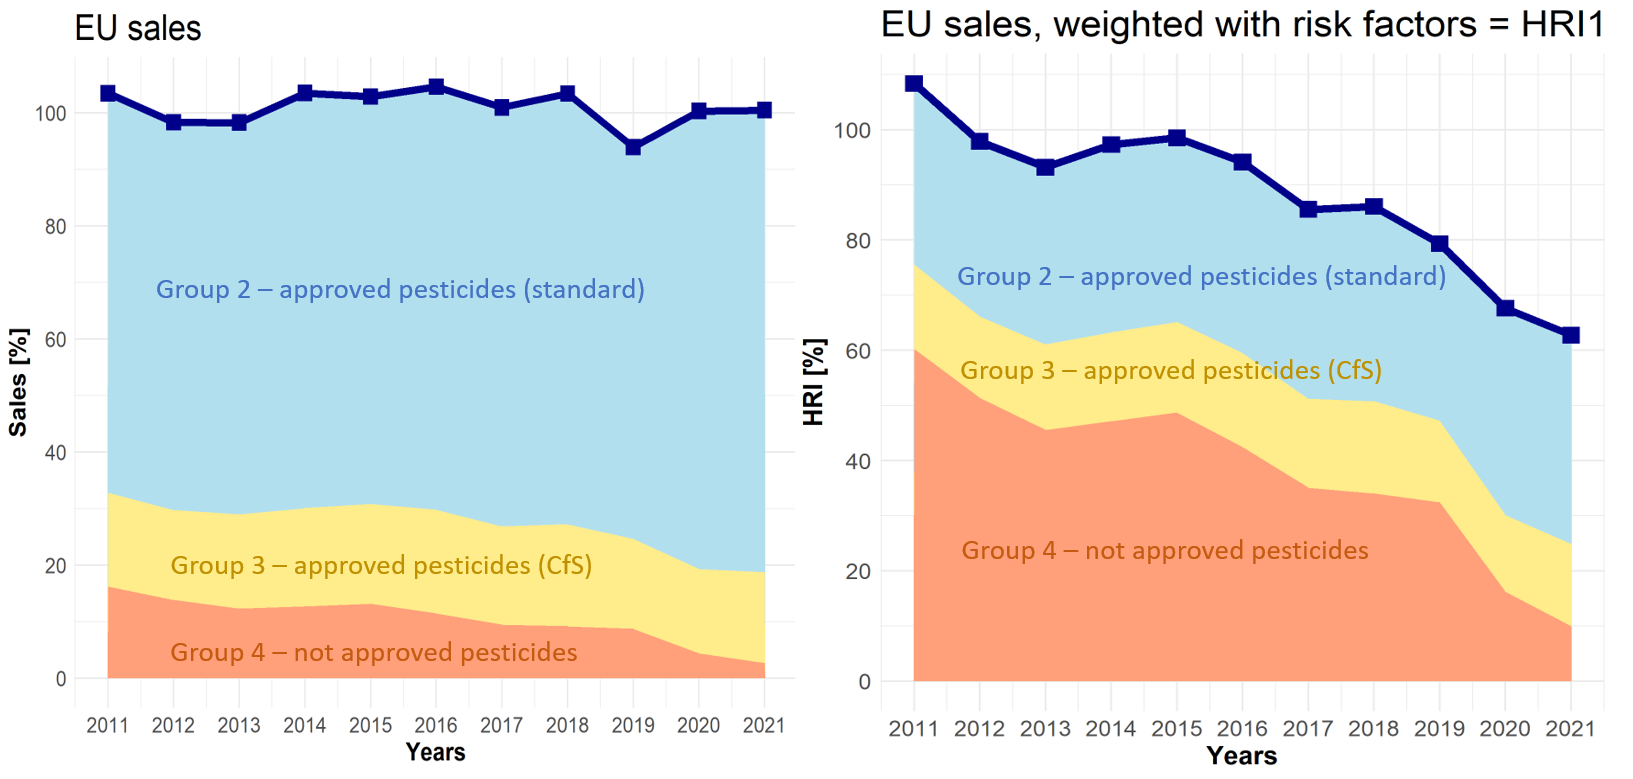
How the EU calculates the pesticide risk down to a minimum.
- Chemikalien
- Land- und Forstwirtschaft
- Diagramme