
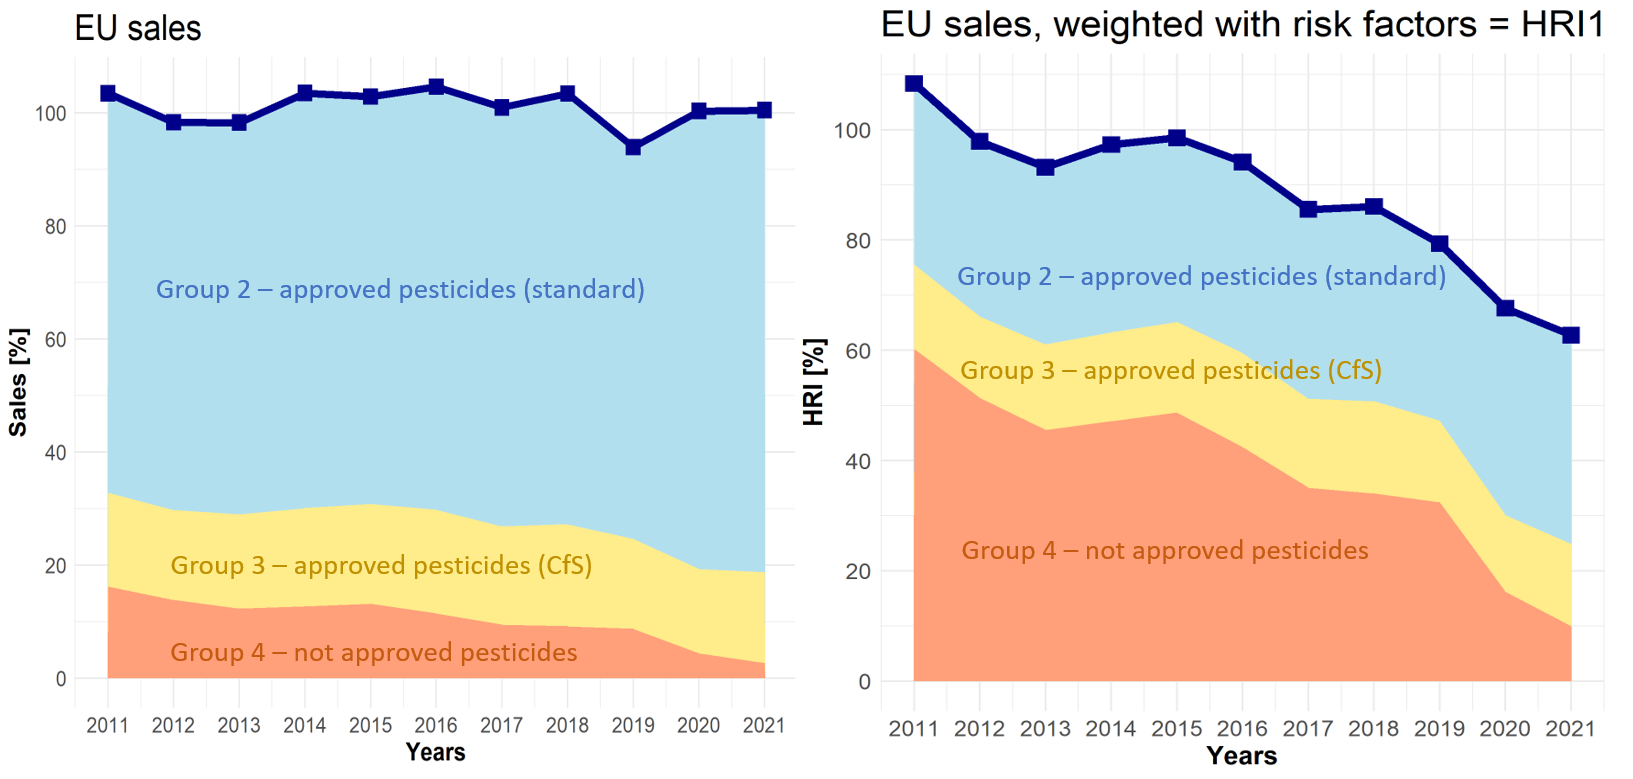
Left: Pure sales figures of pesticides in the EU from 2011 to 2021. Right: Decrease in pesticide risk calculated from this according to the HRI1 methodology. Accordingly, pesticides are divided into four groups and their sales figures are multiplied by the following weighting factors: Group 1 ─ Low-risk active substances: factor 1, Group 2 ─ Approved active substances (standard): factor 8, Group 3 ─ Candidates for Substitution (CfS): factor 16, Group 4 ─ Non-approved active substances: factor 64. The sales figures of all pesticides weighted in this way are subsequently added together. The grouping corresponds to the current approval status of the pesticides in 2021. Both sales figures (left) and HRI1 risk (right) are given as percentages relative to the baseline period 2011-2013. The percentage of Group 1 is < 0.01% and therefore not evident graphically.
The visualization of the four groups shows the systematic error of the HRI1 methodology. In fact, only the sales figures for non-approved active substances of group 4 are declining. This decrease in sales figures is drastically weighted by the indicator and dominates the HRI1 trend as a decrease in risk. This strong weighting is not scientifically justified and therefore misleading. The goal of the SUR would be achieved on paper within a foreseeable time after its adoption, without any reduction in pesticide use taking place in reality.