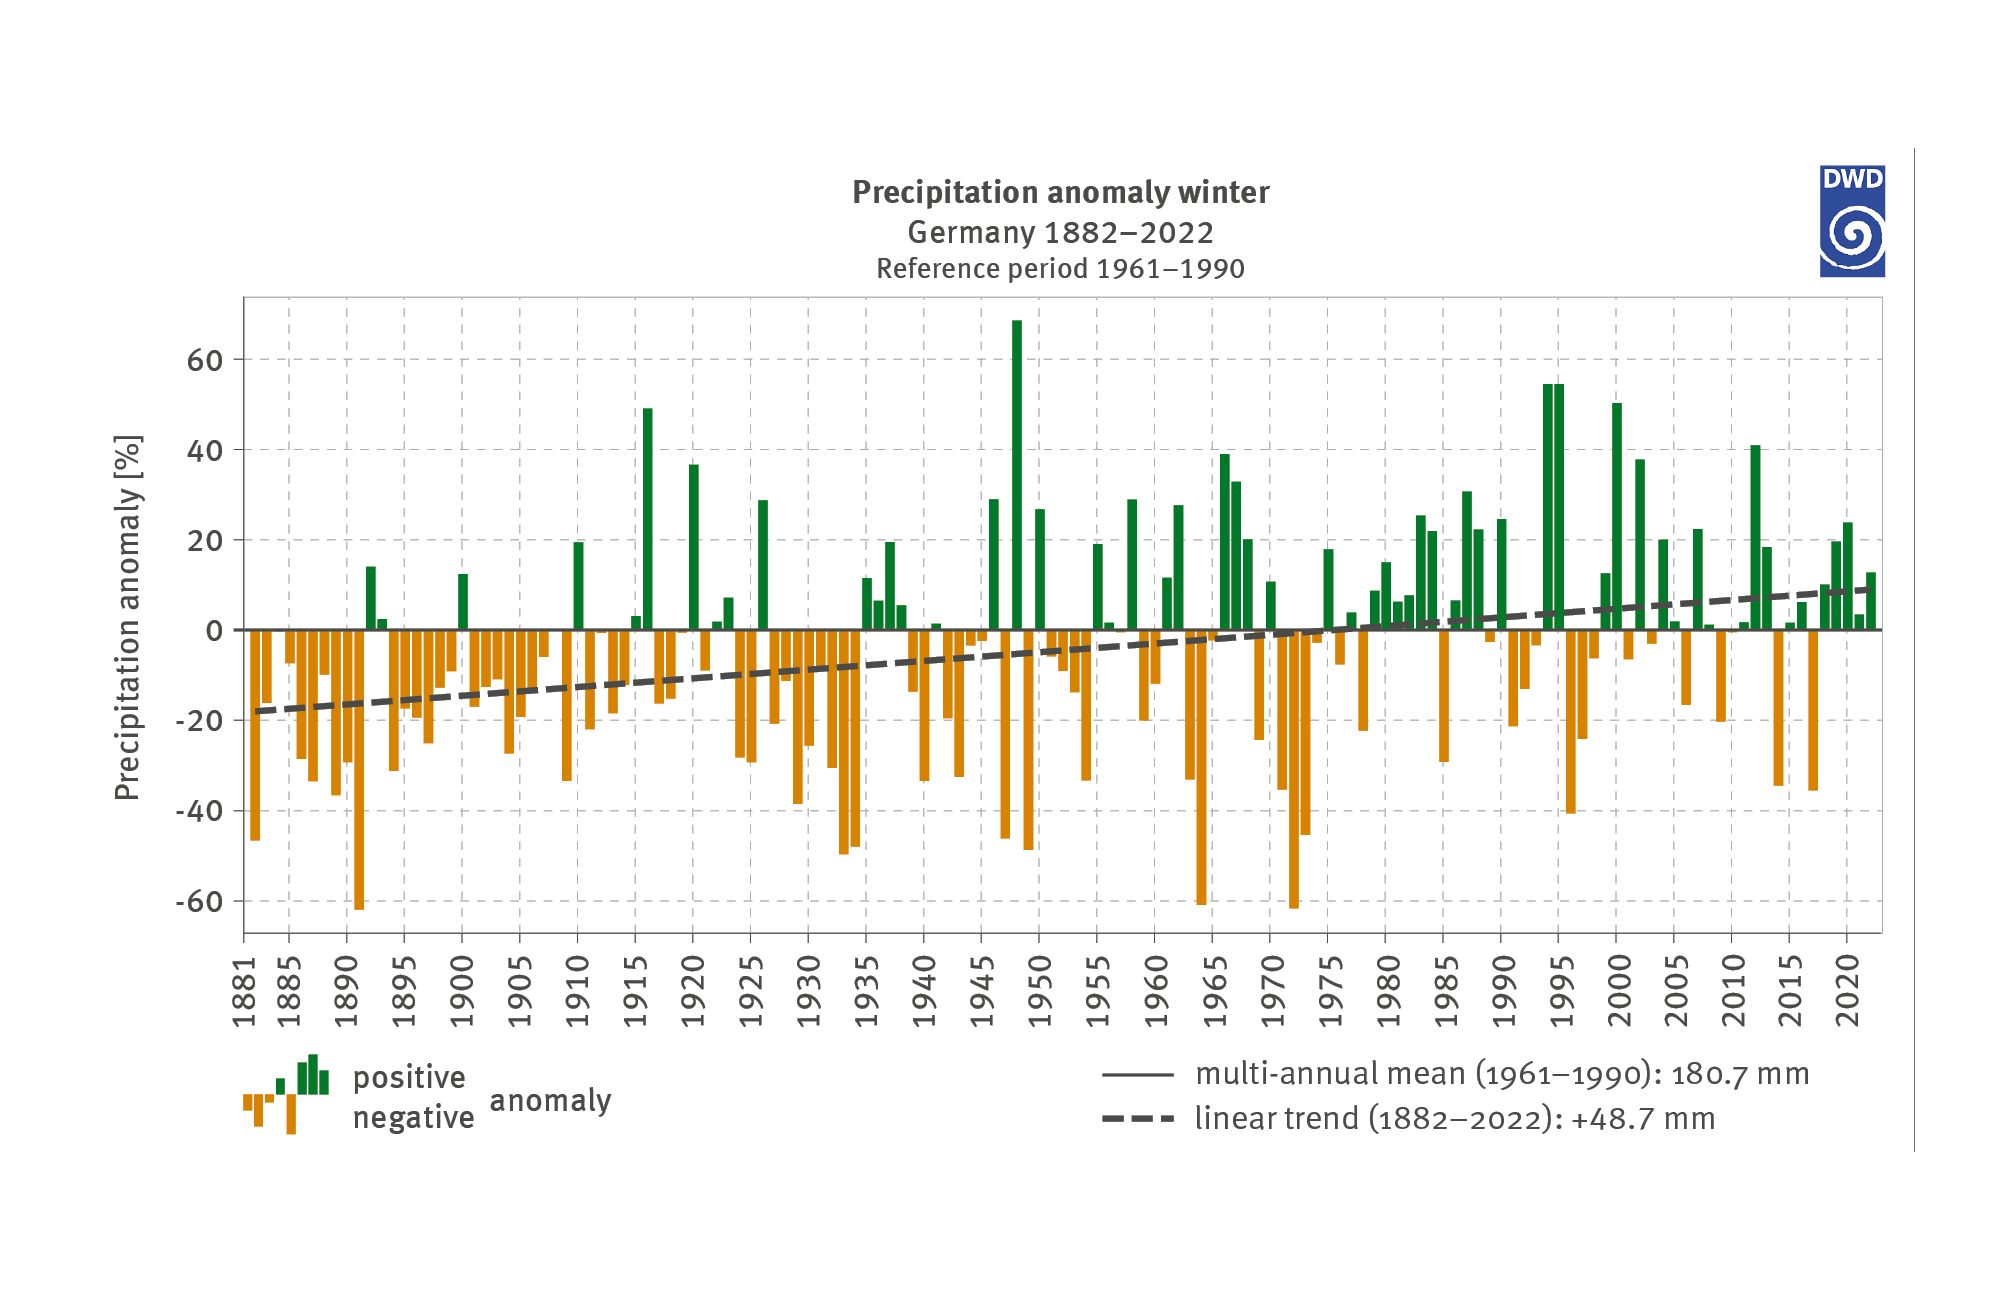
The graph shows the deviations of the annual mean of winter precipitation for Germany from the multi-annual mean for 1961 to 1990. The time series begins in 1882 and extends to 2022. The negative deviations are illustrated in yellow below the zero line, while the positive deviations are in blue above the zero line. The yellow bars show a more frequent and more extended tendency on the left-hand side of the chart, whereas from approximately 1960 onwards there are fewer and shorter yellow bars. From 1891 onwards there are only few blue bars, whereas approximately from 1960 onwards they occur more frequently. The multi-annual mean from 1961 to 1990 amounts to 180.7 millimetres. The linear trend for Germany for the period examined amounts to an increase by 48.3 millimetres.