Data Search


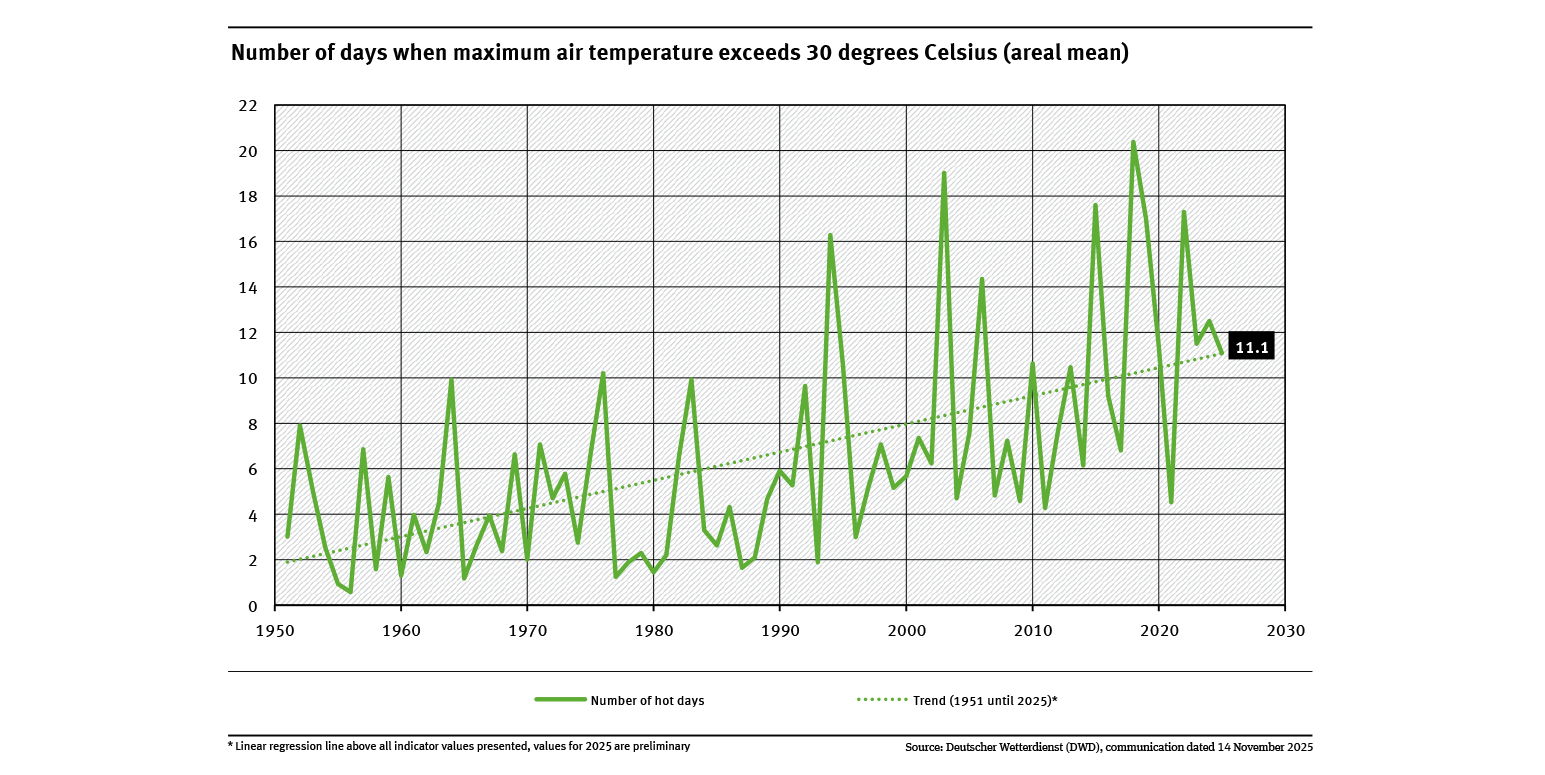
Number of days when maximum air temperature exceeds 30 degrees Celsius (areal mean)
- Klima
- Diagramme
- Umwelt-Indikatoren
- Daten und Tabellen

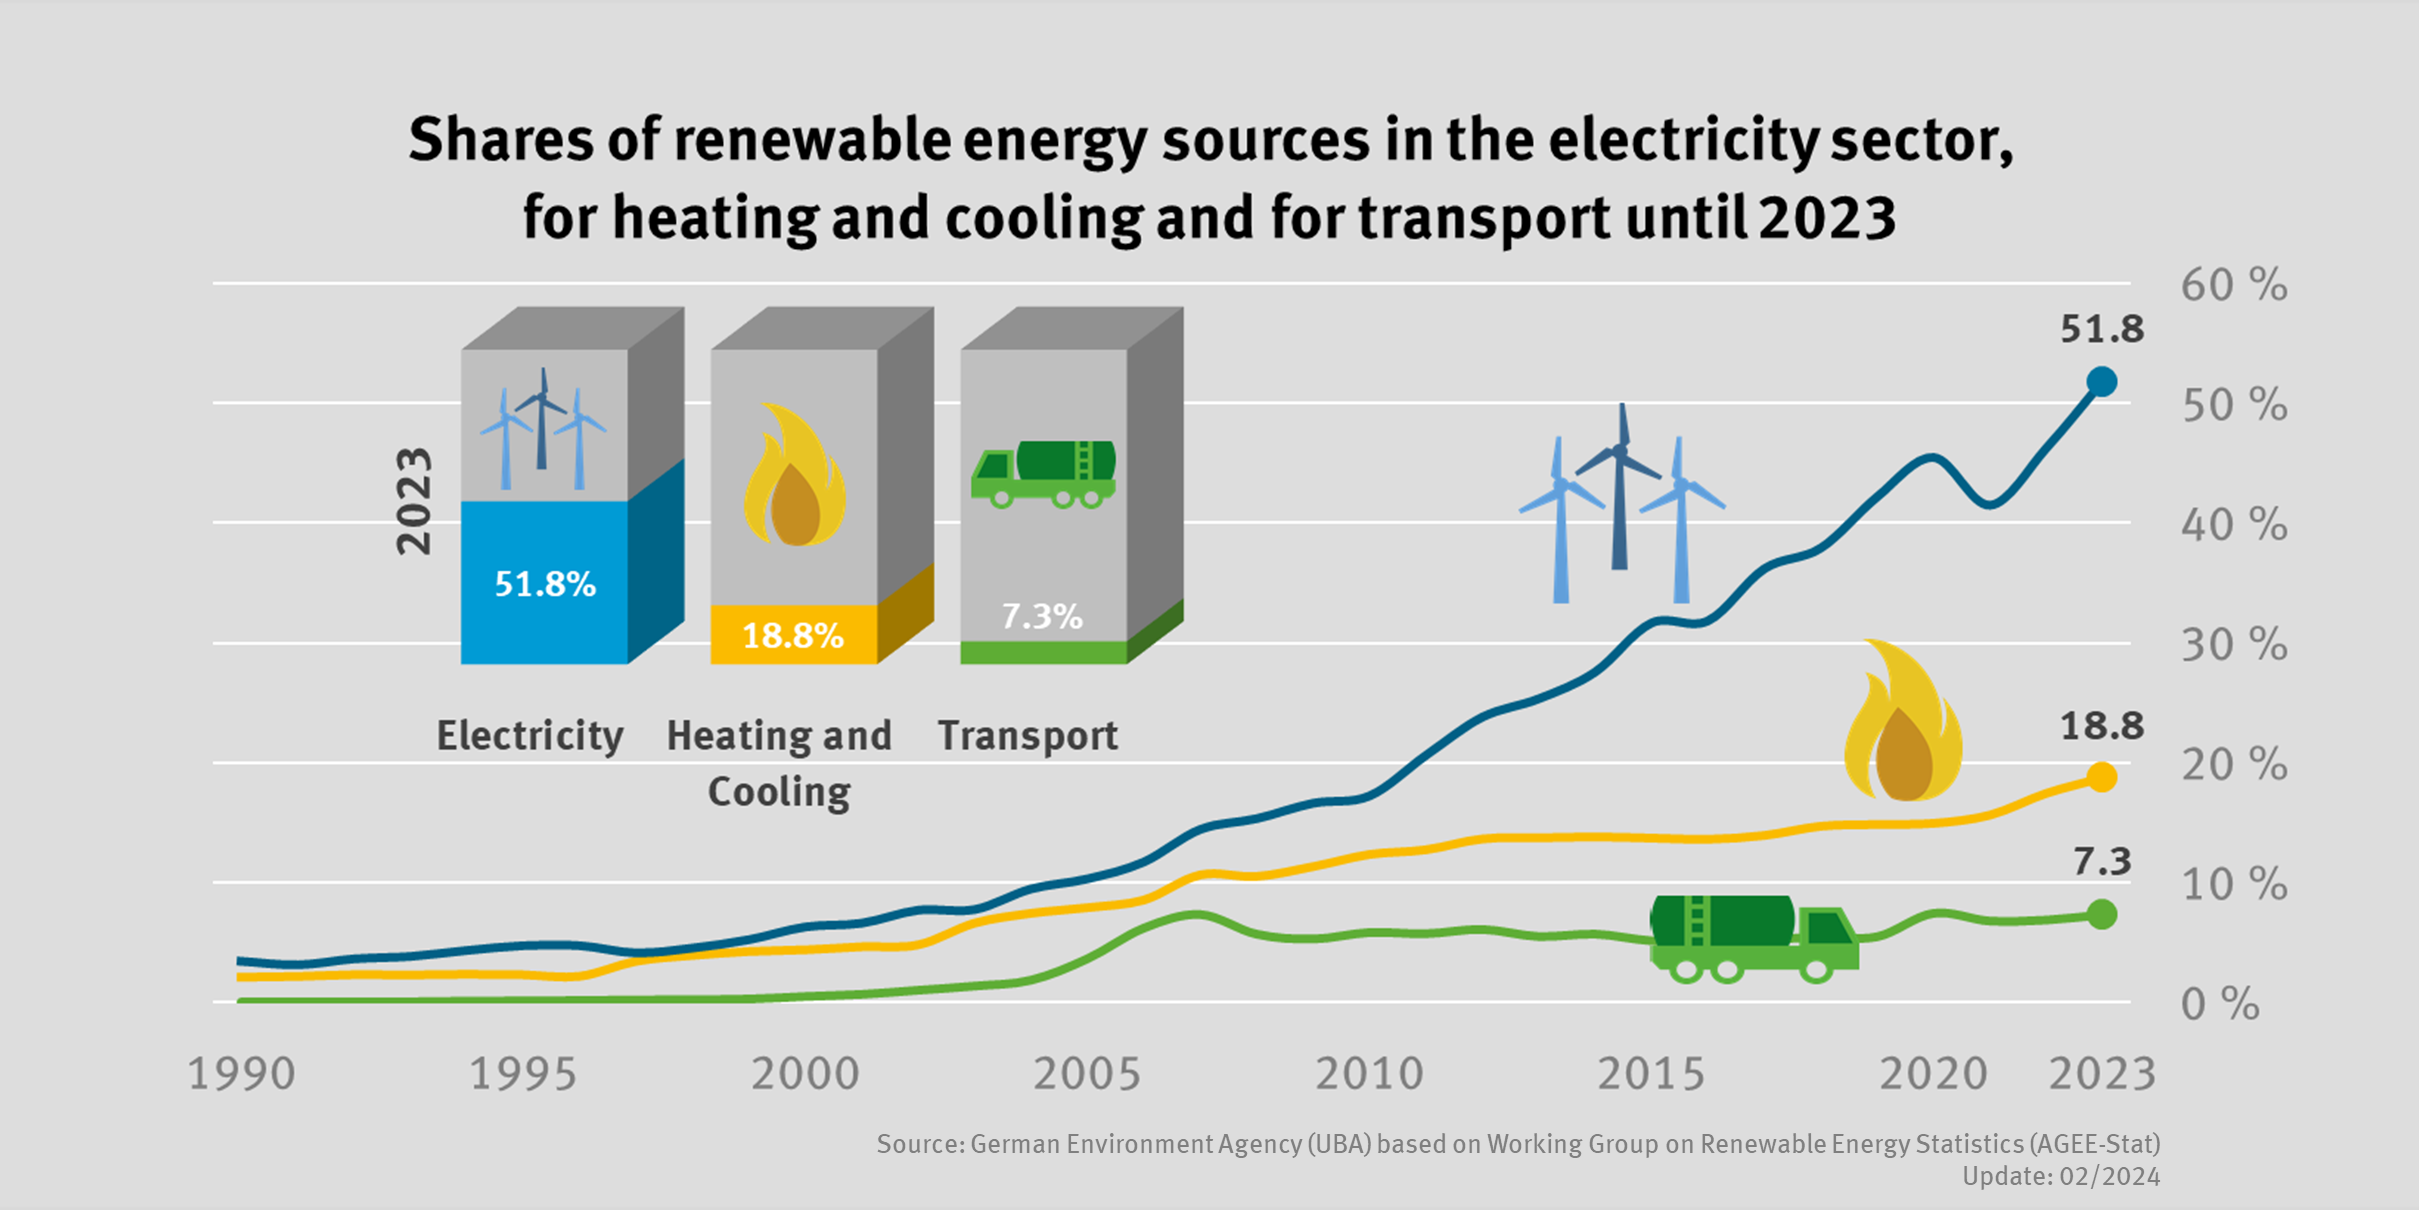
The share of renewable energies in the electricity, heating and transport sectors rose again in 2023
- Energie
- Diagramme
Export data

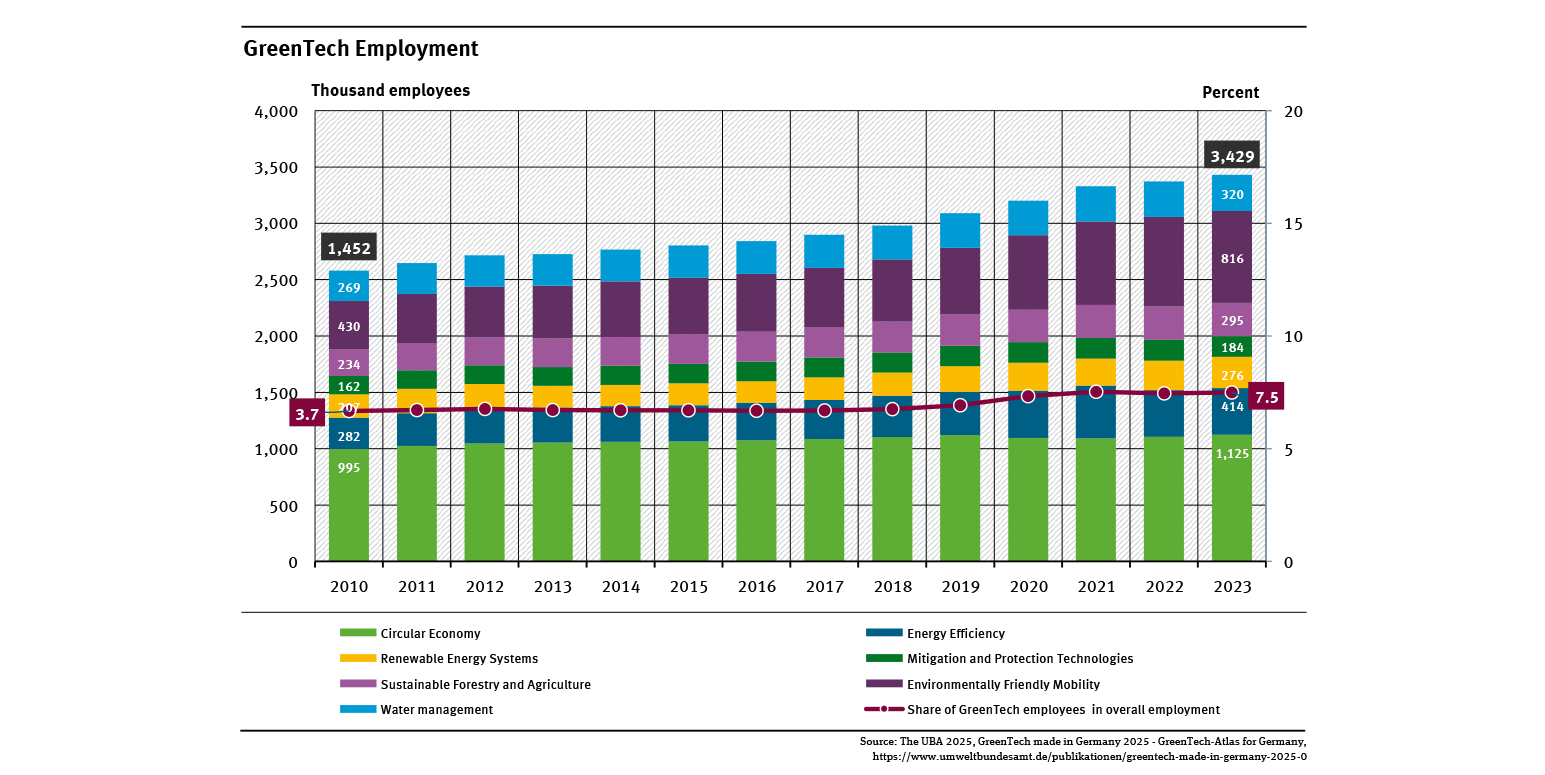
Employment in environmental protection
- Umwelt und Wirtschaft
- Diagramme
- Umwelt-Indikatoren
- Daten und Tabellen

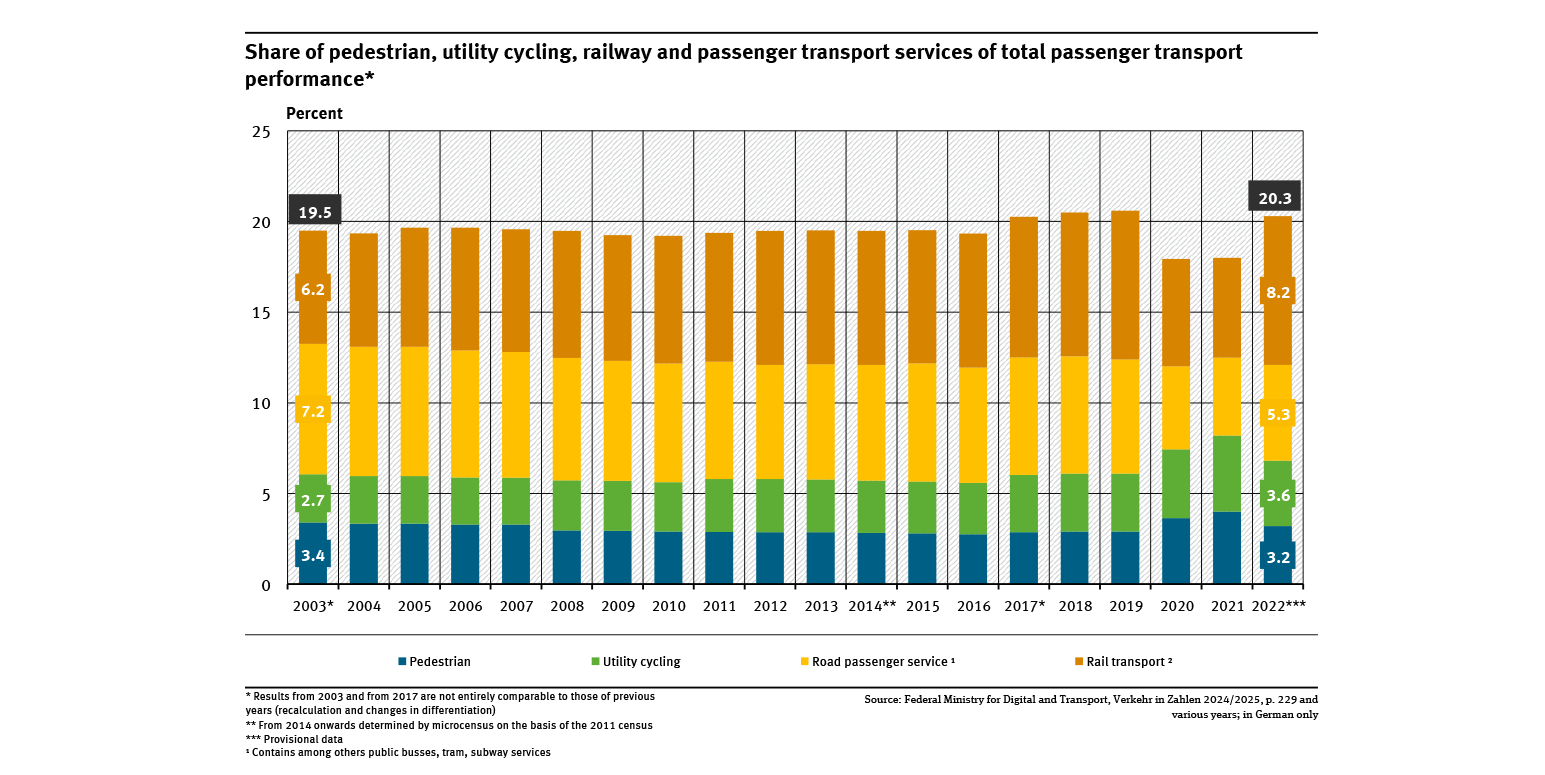
Share of pedestrian, utility cycling, railway and passenger transport services ...
- Verkehr
- Diagramme
- Umwelt-Indikatoren
- Daten und Tabellen

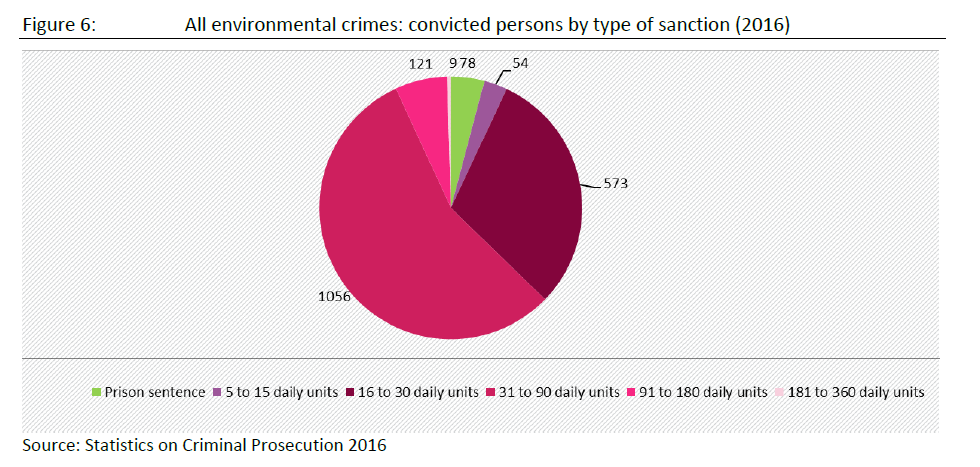
All environmental crimes: convicted persons by the type of sanction (2016)
- Umwelt und Wirtschaft
- Diagramme
- Daten und Tabellen
Export data

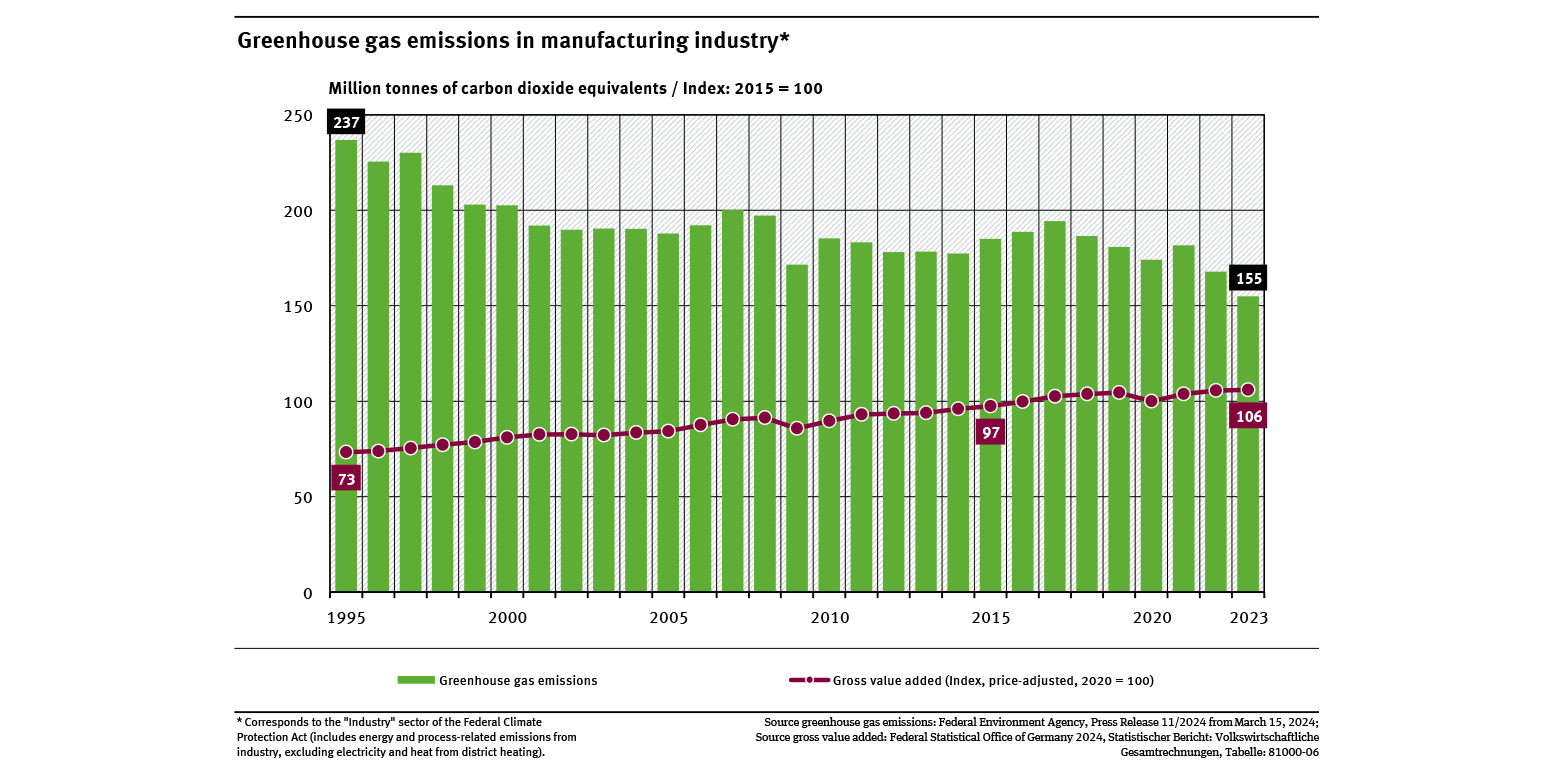
Greenhouse gas emissions in manufacturing industry
- Klima
- Umwelt und Wirtschaft
- Diagramme
- Umwelt-Indikatoren
- Daten und Tabellen

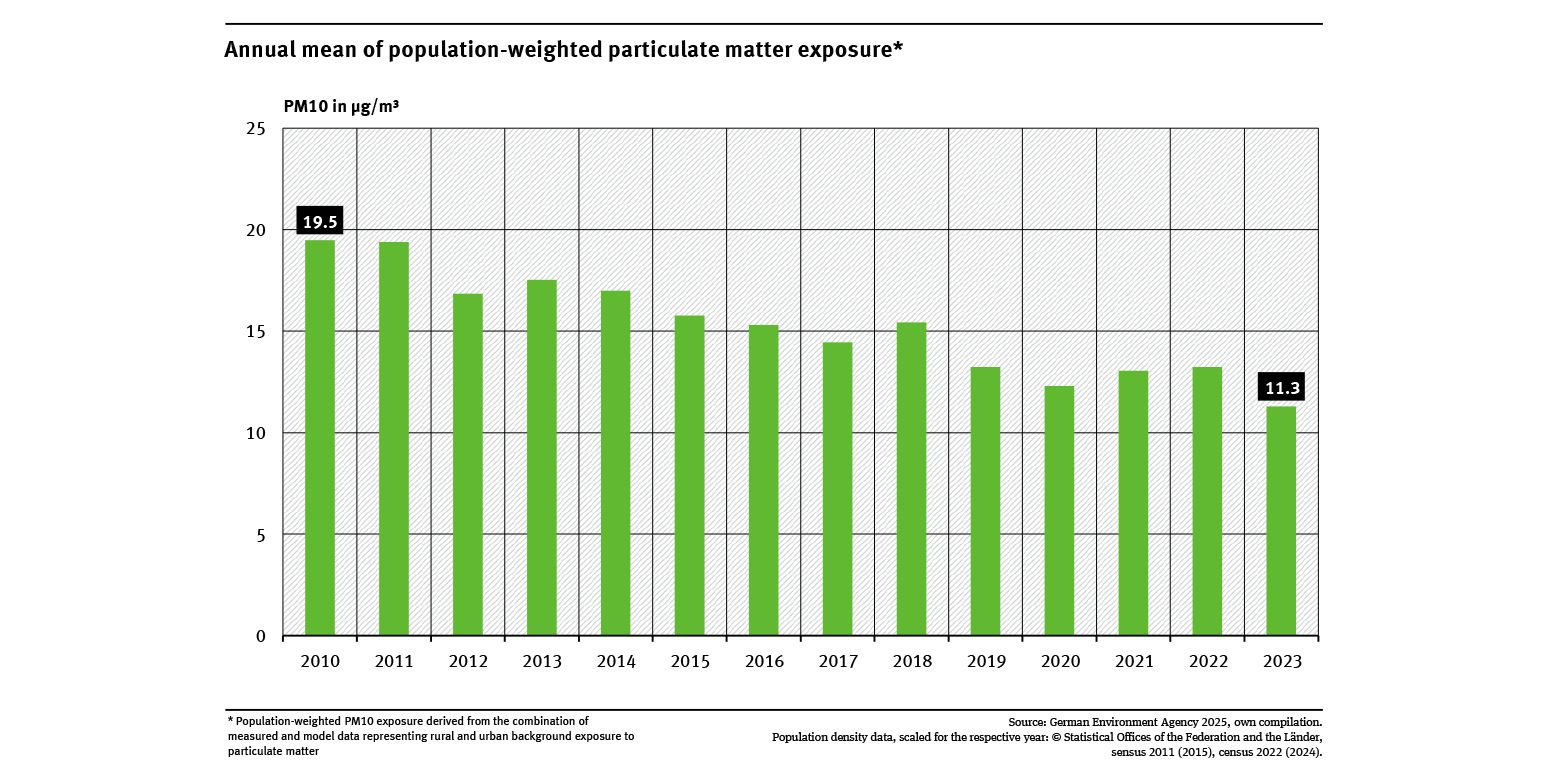
Annual mean of population-weighted particulate matter exposure
- Luft
- Umwelt und Gesundheit
- Diagramme
- Umwelt-Indikatoren
- Daten und Tabellen

Export data