Skip to main content Skip to main menu Skip to footer

Data Search

Data Search

Here you will find diagrams, infographics, maps and tables for direct download.

Data Search

A graph shows the proportion of people in Germany affected by levels exceeding the WHO guideline value and the EU limit value for fine particulate matter (PM10) (legally binding from 2030) for the period from 2010 to 2023 – with a clear declining trend.

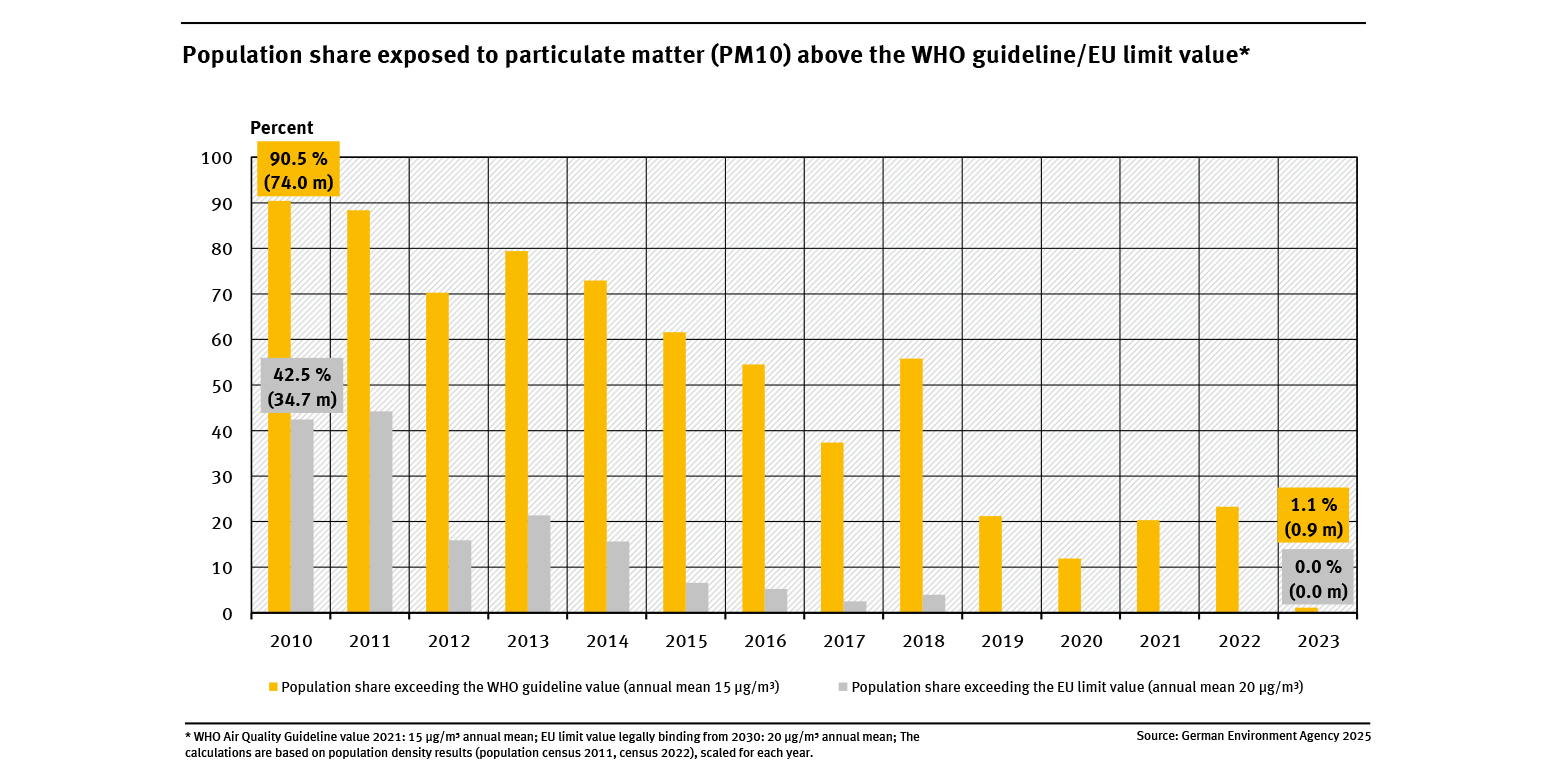
Population share exposed to particulate matter (PM10) above the WHO guideline/EU limit value

  • Luft
  • Umwelt und Gesundheit
  • Diagramme
  • Umwelt-Indikatoren
  • Daten und Tabellen
Export data
A graph shows the development of environmental taxes for the year 1995 (39.9 billion euros), the year 2000, and the period 2005 to 2023 (69.5 billion euros, preliminary data) as well as their share of total tax revenues in the public budgets.

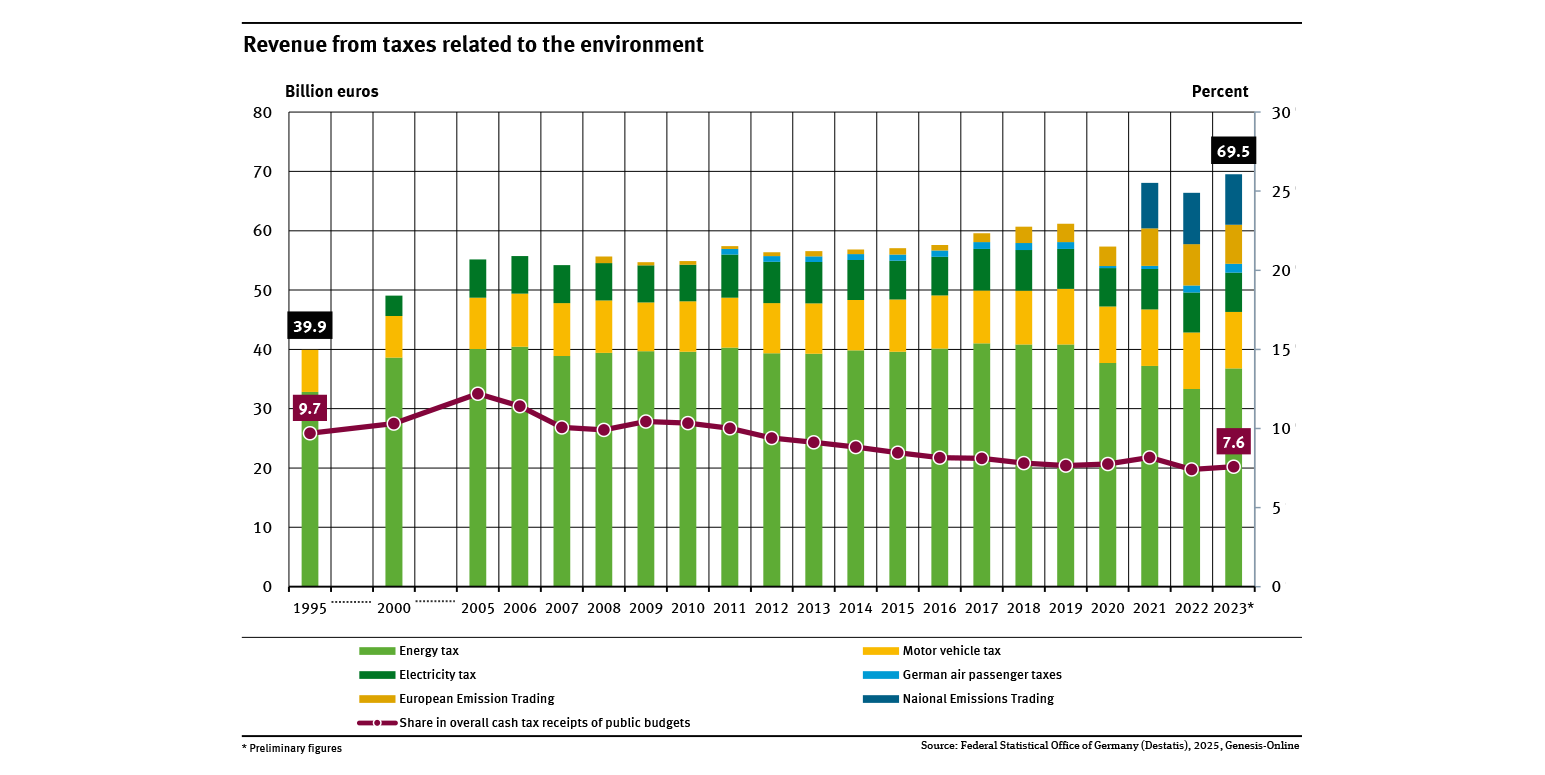
Revenue from taxes to the environment

  • Umwelt und Wirtschaft
  • Diagramme
  • Umwelt-Indikatoren
  • Daten und Tabellen
Export data
A graph shows the shares of rail and inland shipping in freight transport volume between 1999 and 2023. The share of rail transport first increased and then began to stagnate, while the share of inland shipping declined.

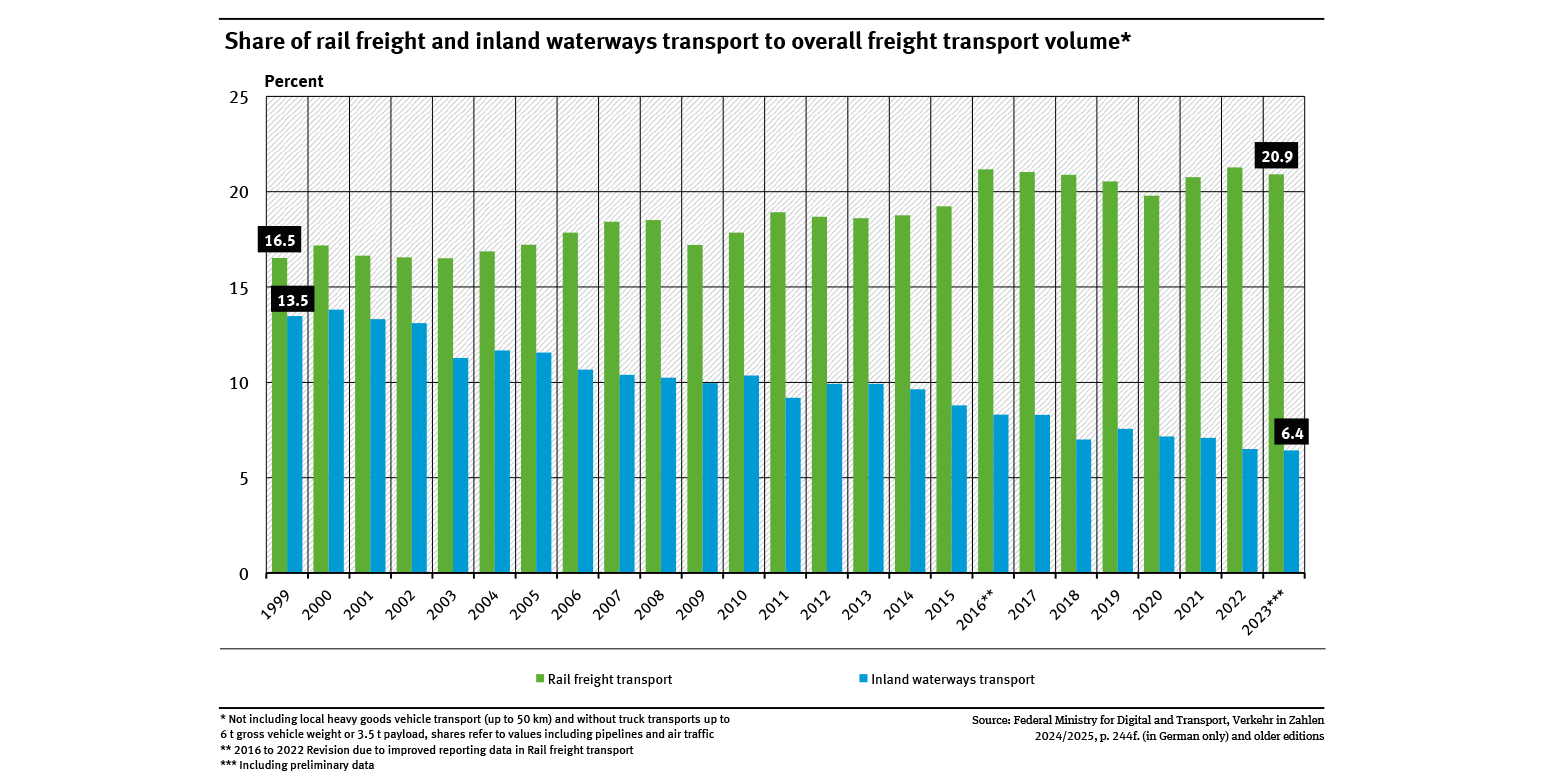
Share of rail freight and inland waterways transport to overall freight transport volume

  • Verkehr
  • Diagramme
  • Umwelt-Indikatoren
  • Daten und Tabellen
Export data
A graph shows the agricultural nitrogen surpluses for individual years and as rolling 5-year means between 1990 and 2023. The 5-year-mean nitrogen surpluses in kilogrammes per hectare dropped from 117 to 70. The target for 2026-2030 is 70 kilogrammes per hectare and year.

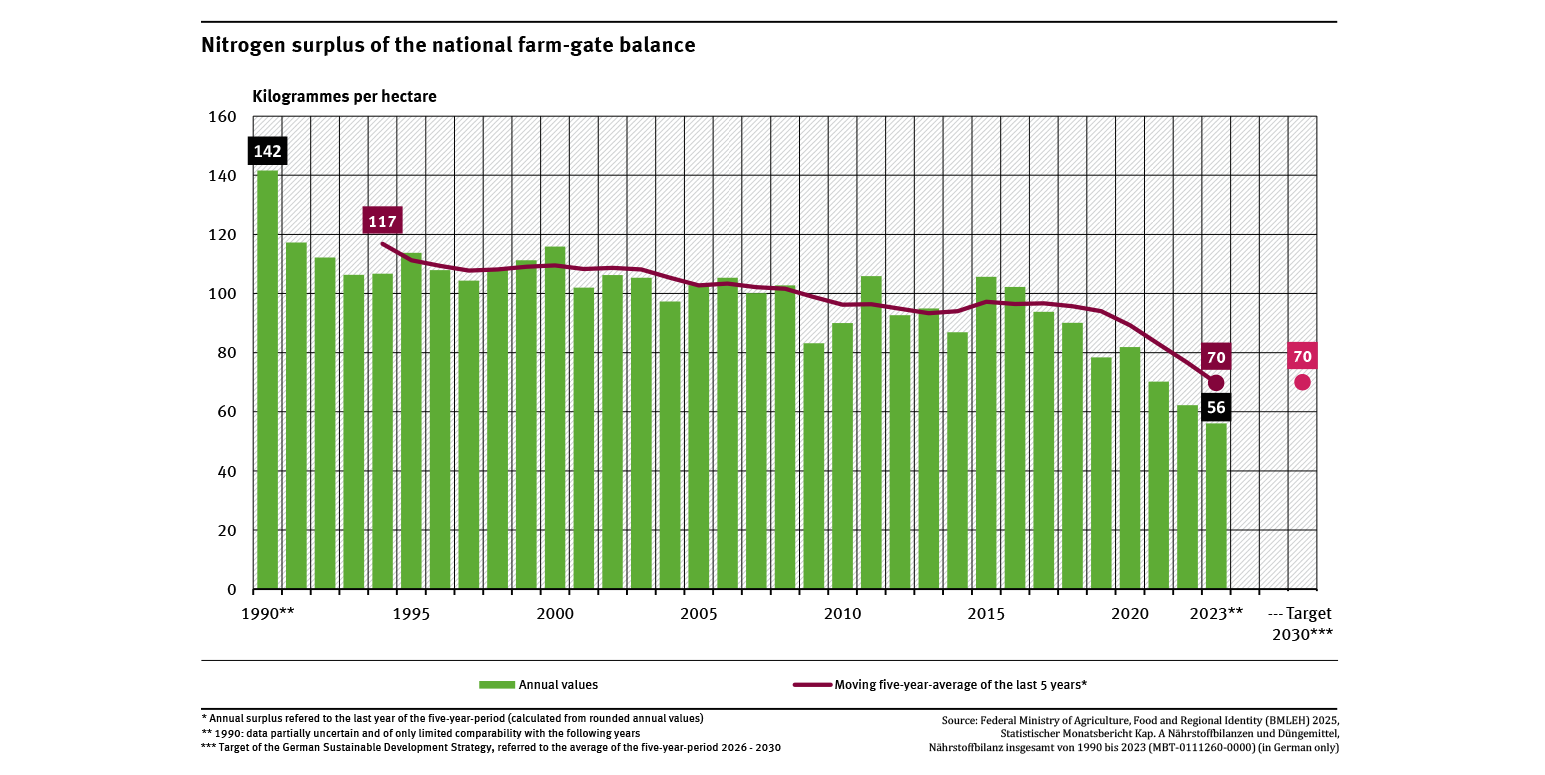
Nitrogen surplus of the national farm-gate balance

  • Fläche, Boden, Land-Ökosysteme
  • Land- und Forstwirtschaft
  • Diagramme
  • Umwelt-Indikatoren
  • Daten und Tabellen
Export data
A graph shows the proportion of people in Germany affected by levels exceeding the WHO guideline value and the EU limit value for fine particulate matter (PM2.5) (legally binding from 2030) for the period from 2010 to 2023 – with a declining trend considering the EU limit value.

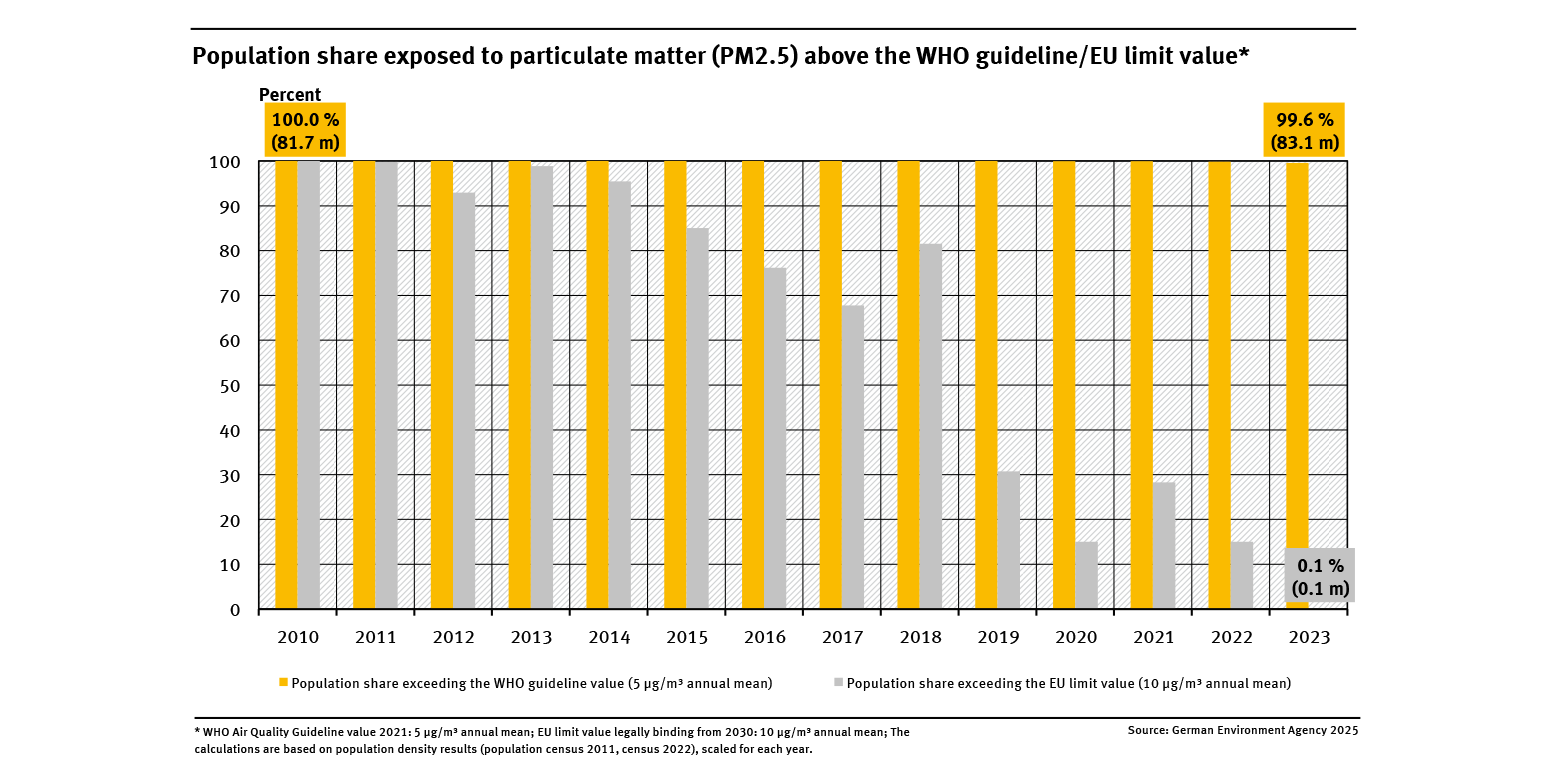
Population share exposed to particulate matter (PM2.5) above the WHO guideline/EU limit value

  • Luft
  • Umwelt und Gesundheit
  • Diagramme
  • Umwelt-Indikatoren
  • Daten und Tabellen
Export data
A graph shows the measuring points that do not comply with the orientation values for phosphorus for the years 1982 to 2023. These are divided into quality classes depending on the level of exceedance. The proportion without exceedances has increased. The proportion of medium and severe exceedances (QC IV) has fallen sharply.

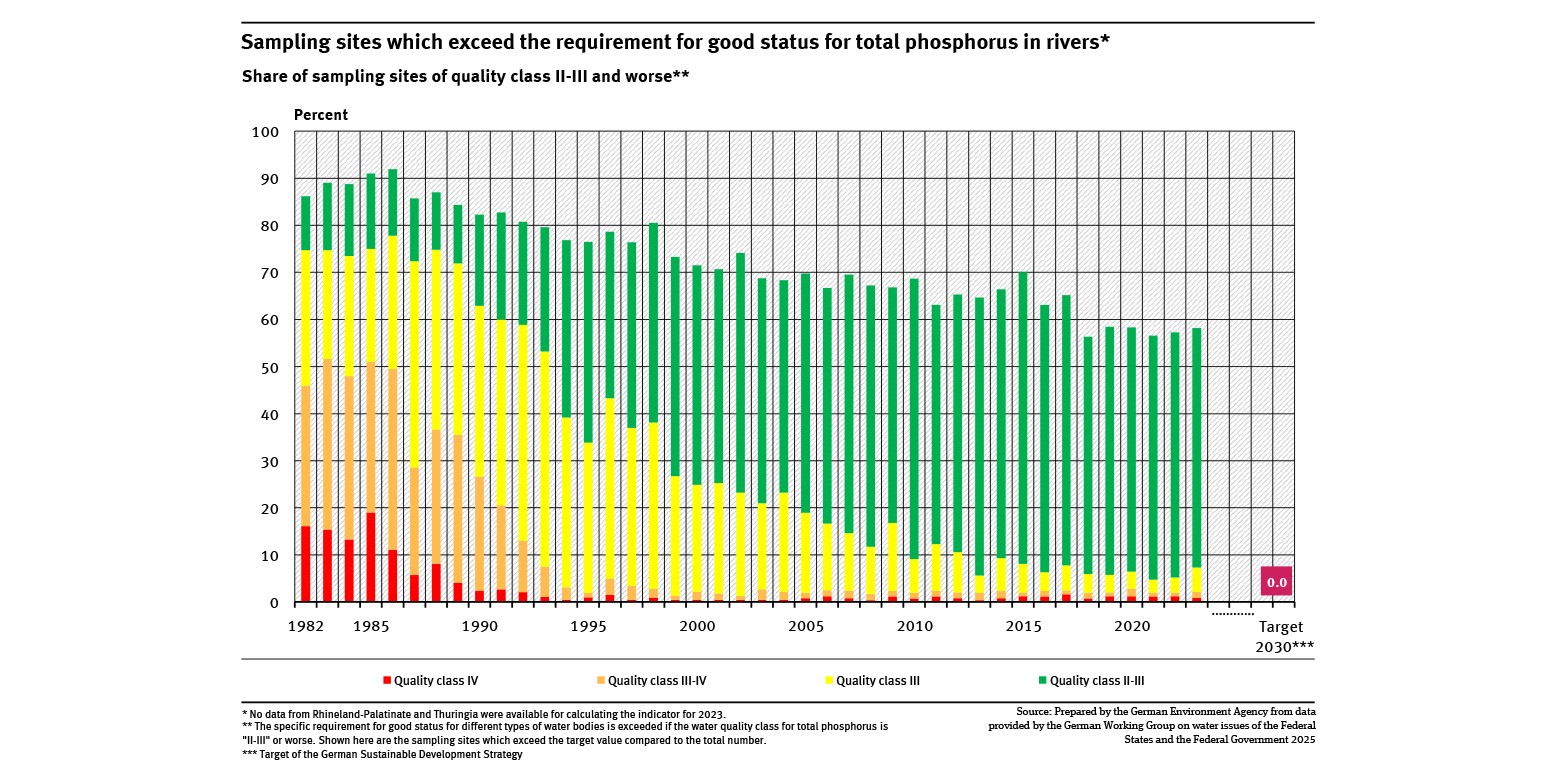
Sampling sites which exceed the requirement for good status for total phosphorus in rivers

  • Wasser
  • Diagramme
  • Umwelt-Indikatoren
  • Daten und Tabellen
Export data
Graph: After a strong increase since 2000, employment has been declining since 2012 due to the sharp job losses in solar energy. There was a slight increase from 2015 to 2016. Most jobs were created in the wind energy and biomass sectors. Between 2016 and 2019, there were sharp declines. By 2023, there were significant increases again, especially in solar energy and heat pumps.

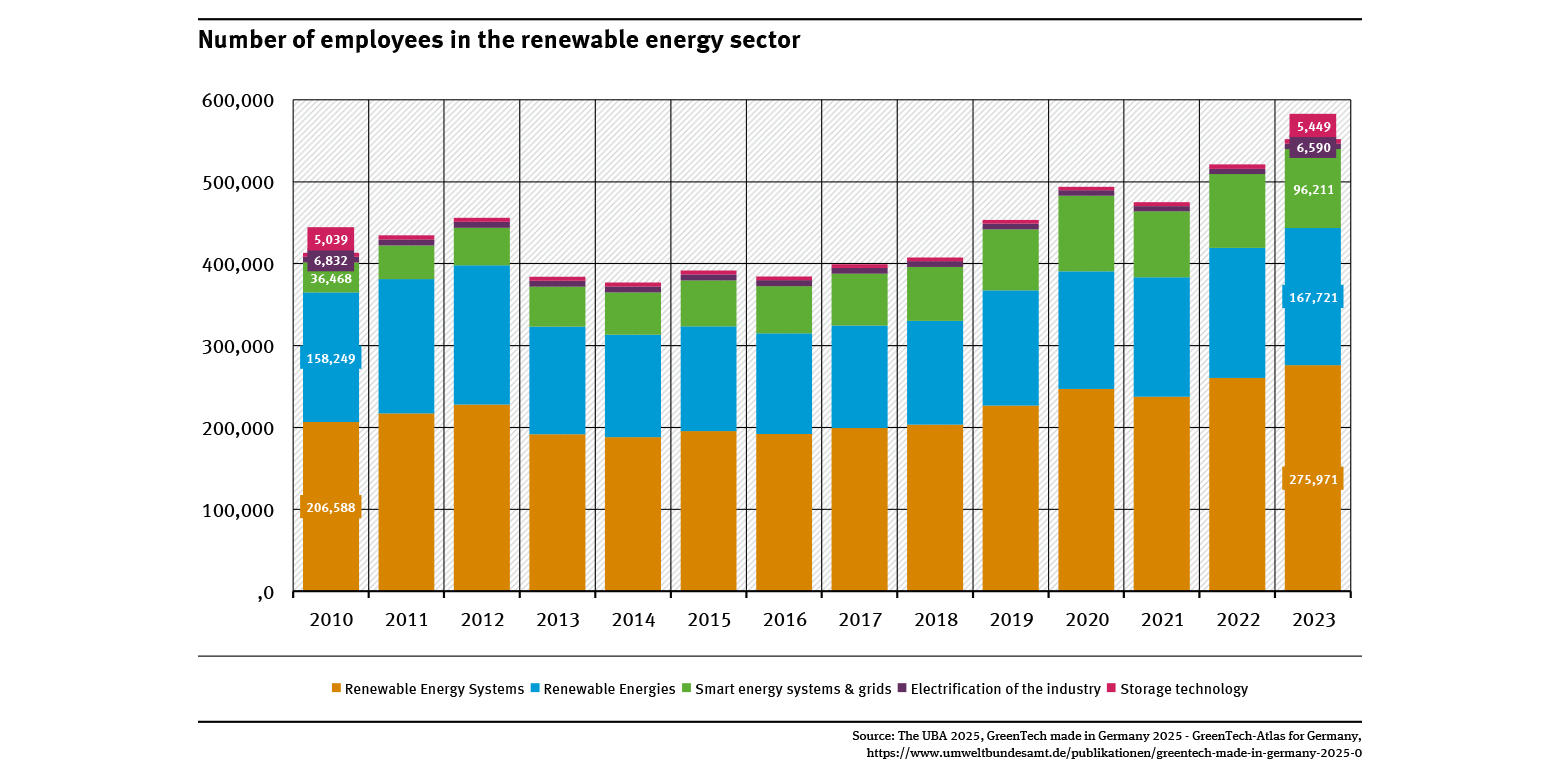
Number of employees in the renewable energy sector

  • Umwelt und Wirtschaft
  • Diagramme
  • Umwelt-Indikatoren
  • Daten und Tabellen
Export data
Two lines show the market shares of holiday trips to European destinations, specifically to the Mediterranean and to Scandinavia and Western Europe. In a stacked column display, a secondary axis shows the percentage market shares of holiday trips to Germany and abroad.

TOU-I-7: Holiday destination preferences

  • Klima
  • Private Haushalte und Konsum
  • Diagramme
Export data
PNG
The line graph shows the number of overnight stays in millions, differentiated for the main season from June to September, for the low season from March to May and October, and for winter from November to December of the previous year and January to February of the respective year. The time series ranges from 2007 to 2017.

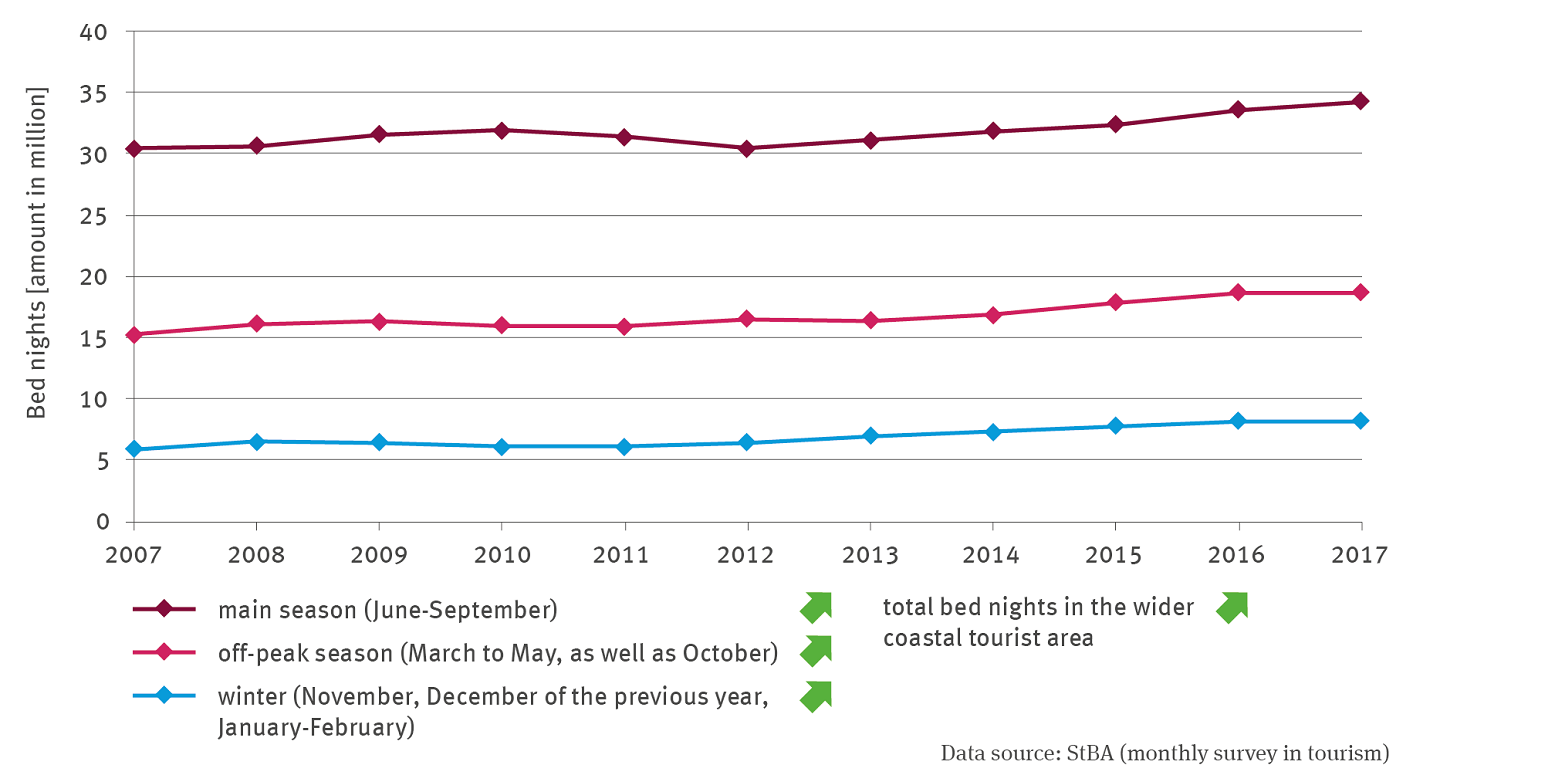
TOU-I-2: Bed nights in coastal tourist areas

  • Klima
  • Private Haushalte und Konsum
  • Diagramme
Export data
PNG
Deviation of annual mean air temperature for Germany and globally from the multi-annual mean 1961–1990

Figure 1: Air temperature for Germany

  • Klima
  • Diagramme
Export data
PNG

You can also search in other data portals of the German Environment Agency

Short link: https://www.uba.de/n300701en