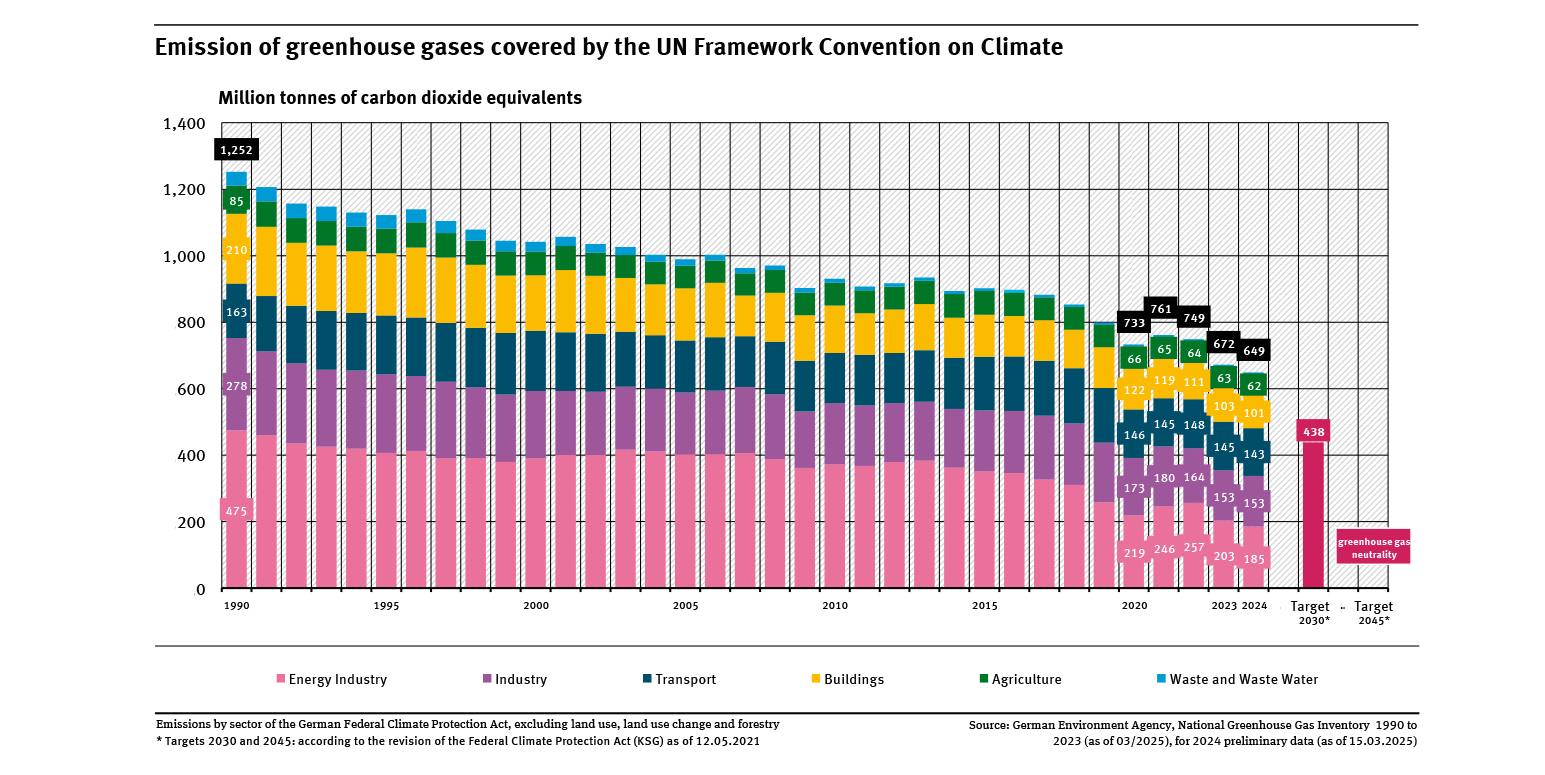
Skip to main content Skip to main menu Skip to footer

Data Search

Data Search

Here you will find diagrams, infographics, maps and tables for direct download.

Data Search

A graph shows the trend in greenhouse gas emissions in Germany, which fell from 1,252 million tonnes of CO2 equivalents in 1990 to 649 million tonnes in 2024. The bars are divided into different sectors. The graph shows all target values up to 2045.
Export data
A graph shows the change in the concentration of total nitrogen in all major rivers that discharge into the North and Baltic Sea in Germany and indicates the target value of 2.8 or 2.6 mg/L total nitrogen for North and Baltic Sea, respectively. The concentration value is calculated as the 5-year moving average of the flow-weighted mean concentration of all major rivers in milligrams total nitrogen per litre (mg/L).

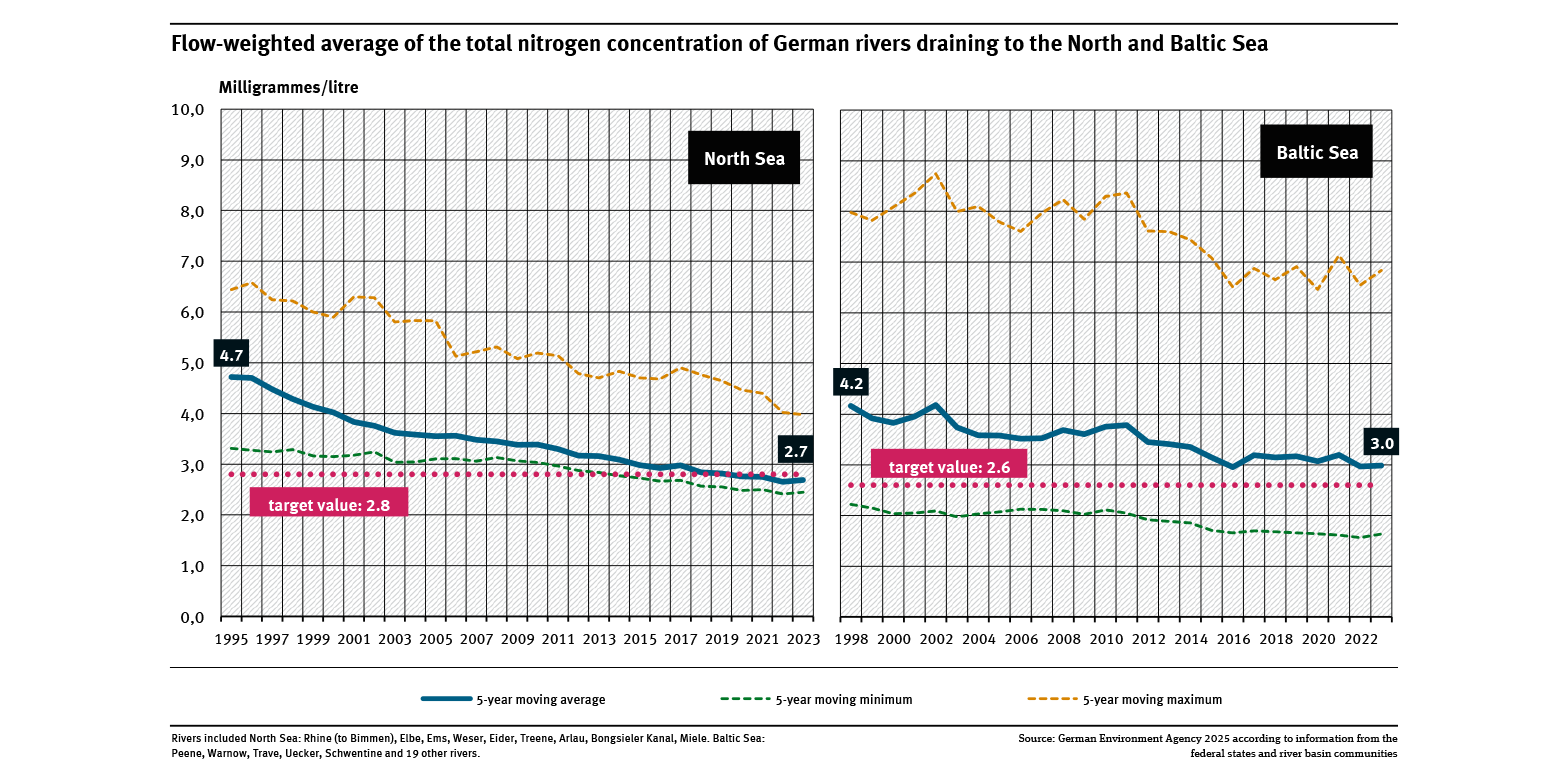
Outflow-weighted mean of the total nitrogen concentration of the North Sea and Baltic Sea inlets

  • Wasser
  • Diagramme
  • Umwelt-Indikatoren
  • Daten und Tabellen
Export data
A graph shows the percentage of the population actively involved in environmental protection and nature conservation or who could imagine becoming involved. In 2024 only the current involvement was surveyed (same as in 2022 and 2020) which was at 15 percent.

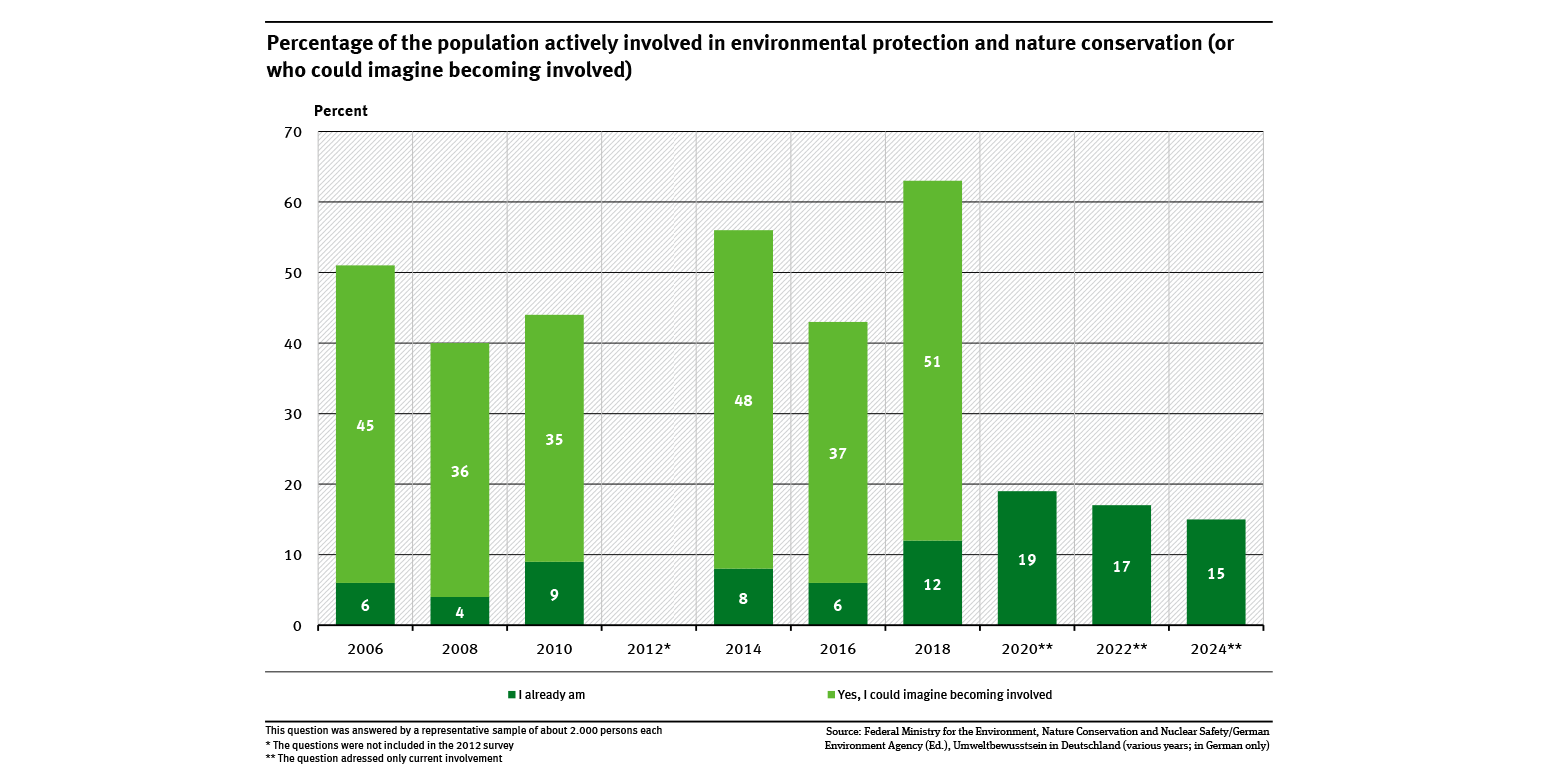
Percentage of the population actively involved in environmental protection and nature conservation..

  • Private Haushalte und Konsum
  • Diagramme
  • Umwelt-Indikatoren
  • Daten und Tabellen
Export data
A graph shows the water exploitation index for the years 1991 to 2022. Values are available for every three or four years. The index fell almost constantly and has been below the critical value of 20 percent since 2007. This presentation is based on the long-term potential water supply of 176 billion m³.

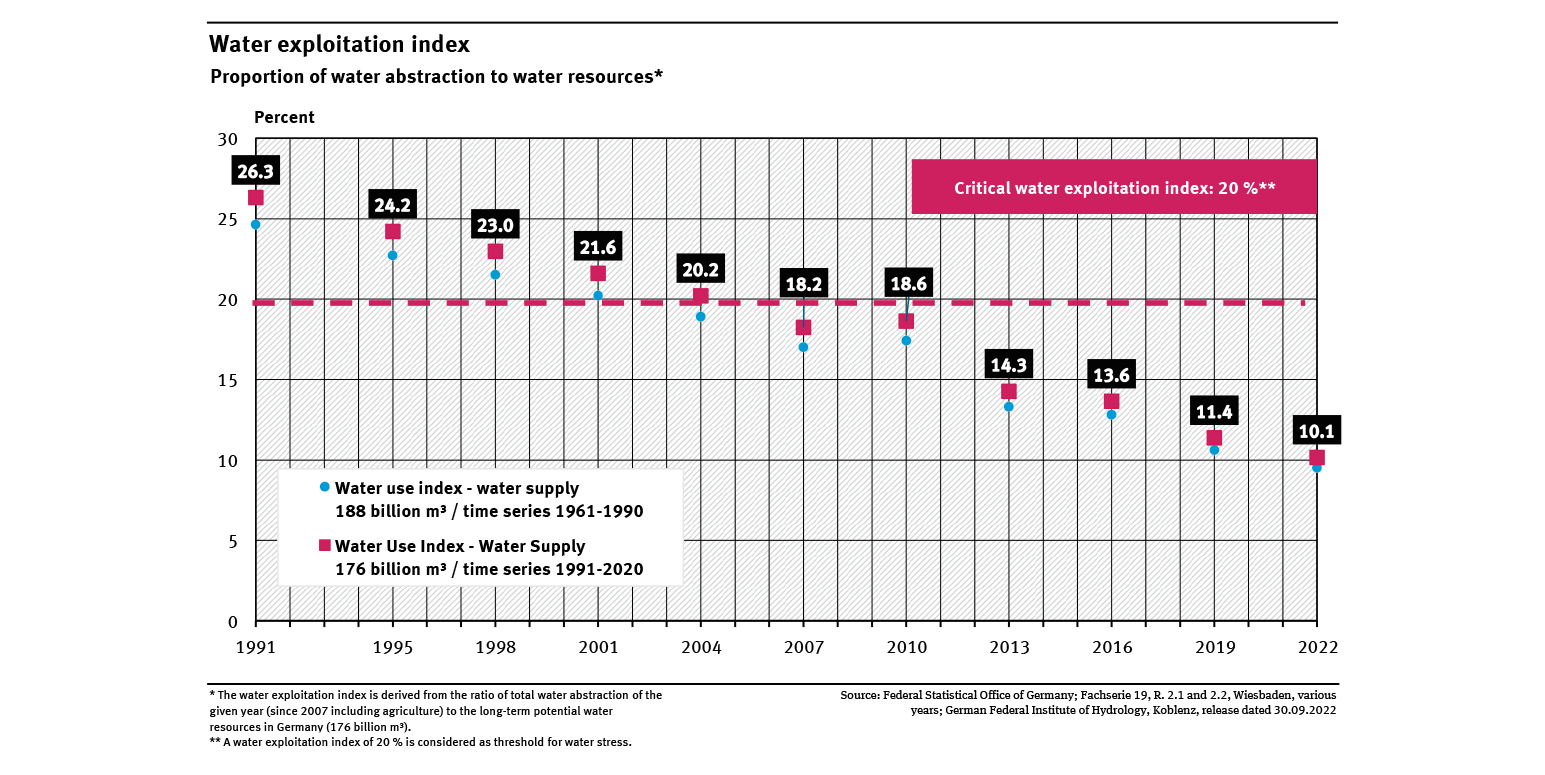
Water exploitation index

  • Wasser
  • Diagramme
  • Umwelt-Indikatoren
  • Daten und Tabellen
Export data
A graph shows the proportion of people exposed to traffic noise above 55 decibels during the day and above 50 decibels at night, as observed in the 2022 noise mappings. It differentiates between road, aircraft and rail traffic noise.

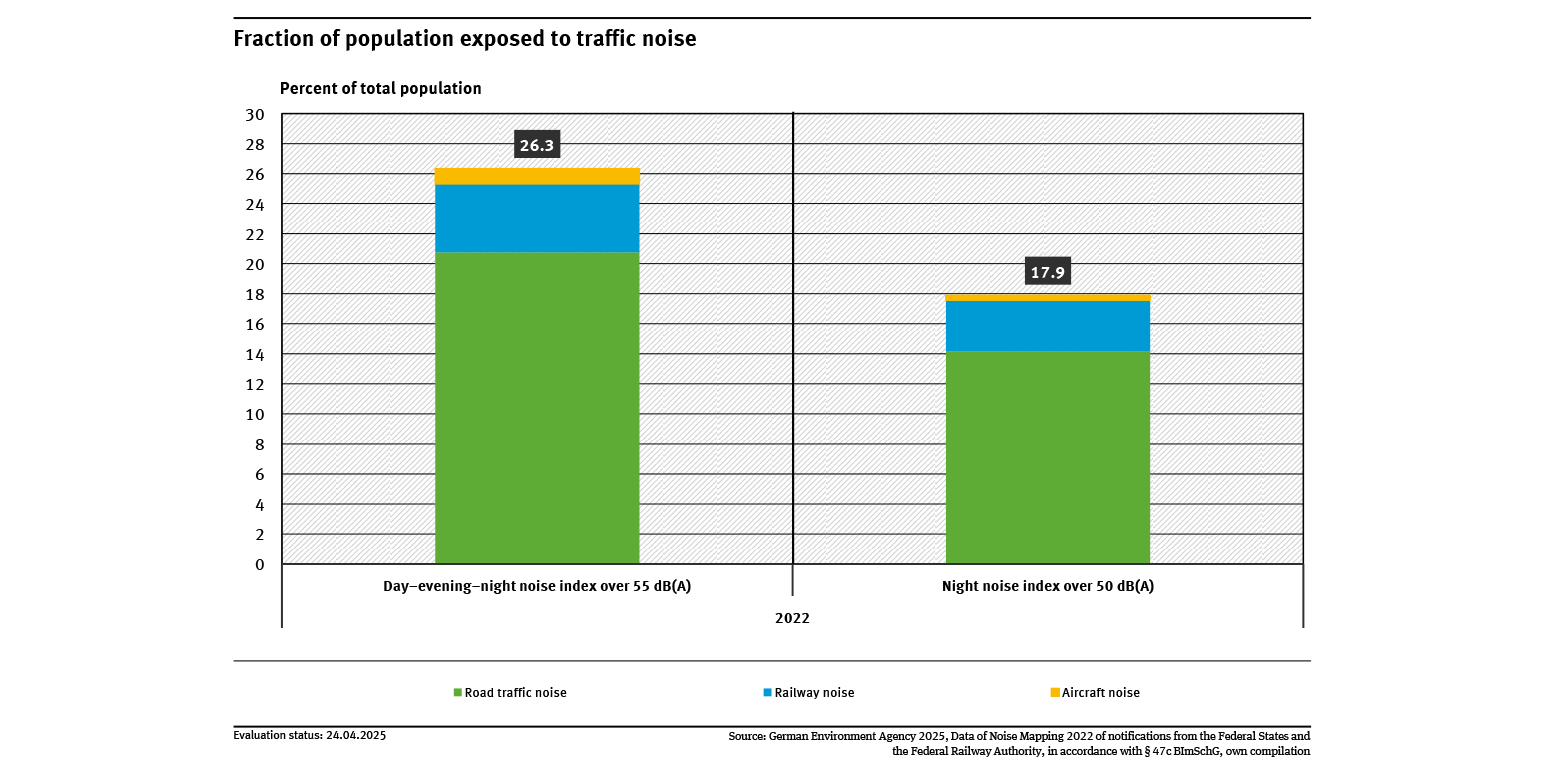
Fraction of population exposed to traffic noise

  • Umwelt und Gesundheit
  • Verkehr
  • Diagramme
  • Umwelt-Indikatoren
  • Daten und Tabellen
Export data
A graph shows the final energy consumption from 2008 to 2023. The trend is slightly downward, but fluctuates from year to year due to the influence of the weather. The EnEfG target for the years 2030 is also shown.

Final energy consumption

  • Energie
  • Diagramme
  • Umwelt-Indikatoren
  • Daten und Tabellen
Export data
A graph shows the share of renewable energies in gross final energy consumption. The share increased from 6.2 % to 22.4 % between 2004 and 2024.

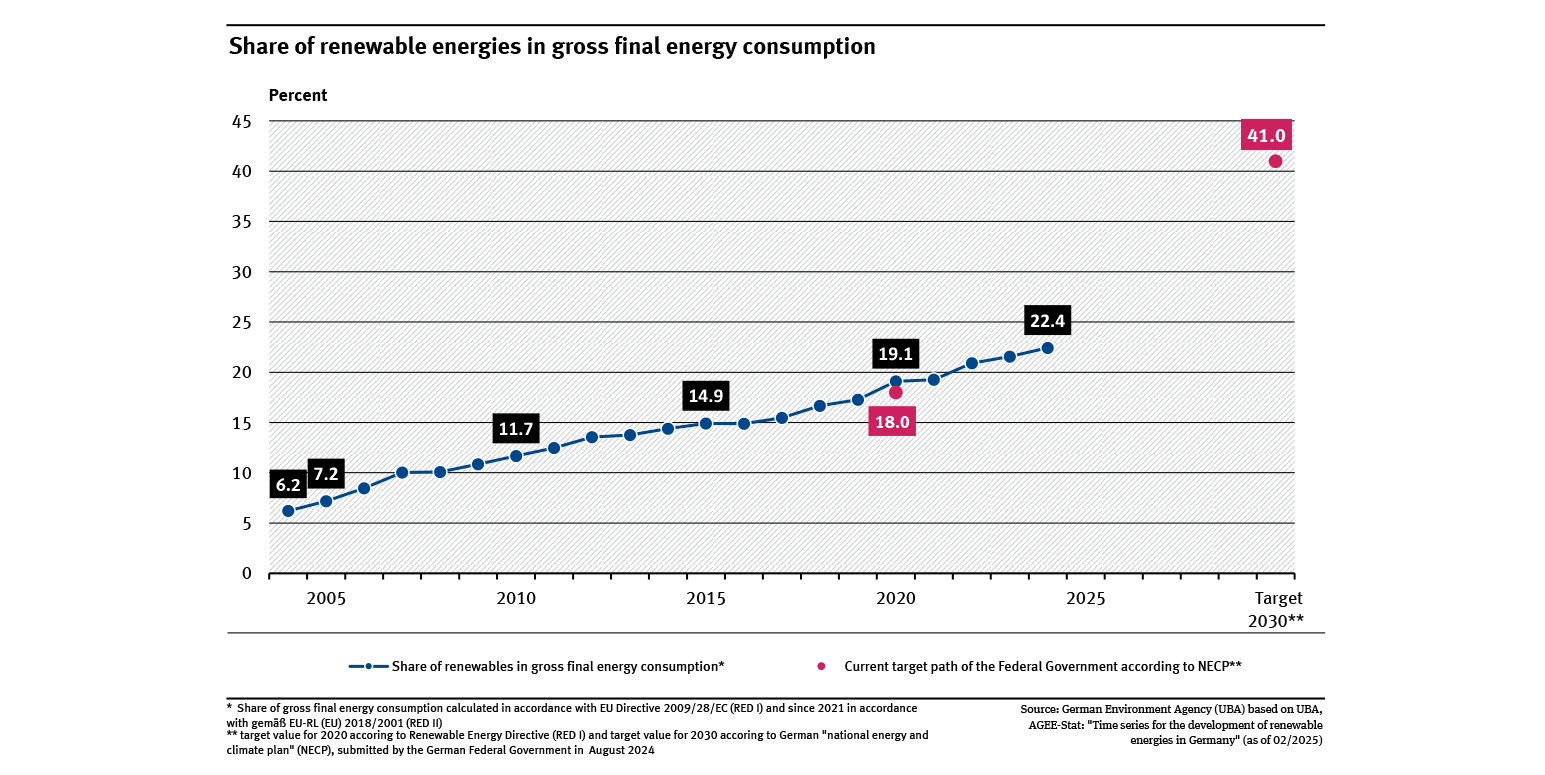
Share of renewable energies in gross final energy consumption

  • Energie
  • Diagramme
  • Umwelt-Indikatoren
  • Daten und Tabellen
Export data
A graph shows the measuring points that do not comply with the orientation values for phosphorus for the years 1982 to 2023. These are divided into quality classes depending on the level of exceedance. The proportion without exceedances has increased. The proportion of medium and severe exceedances (QC IV) has fallen sharply.

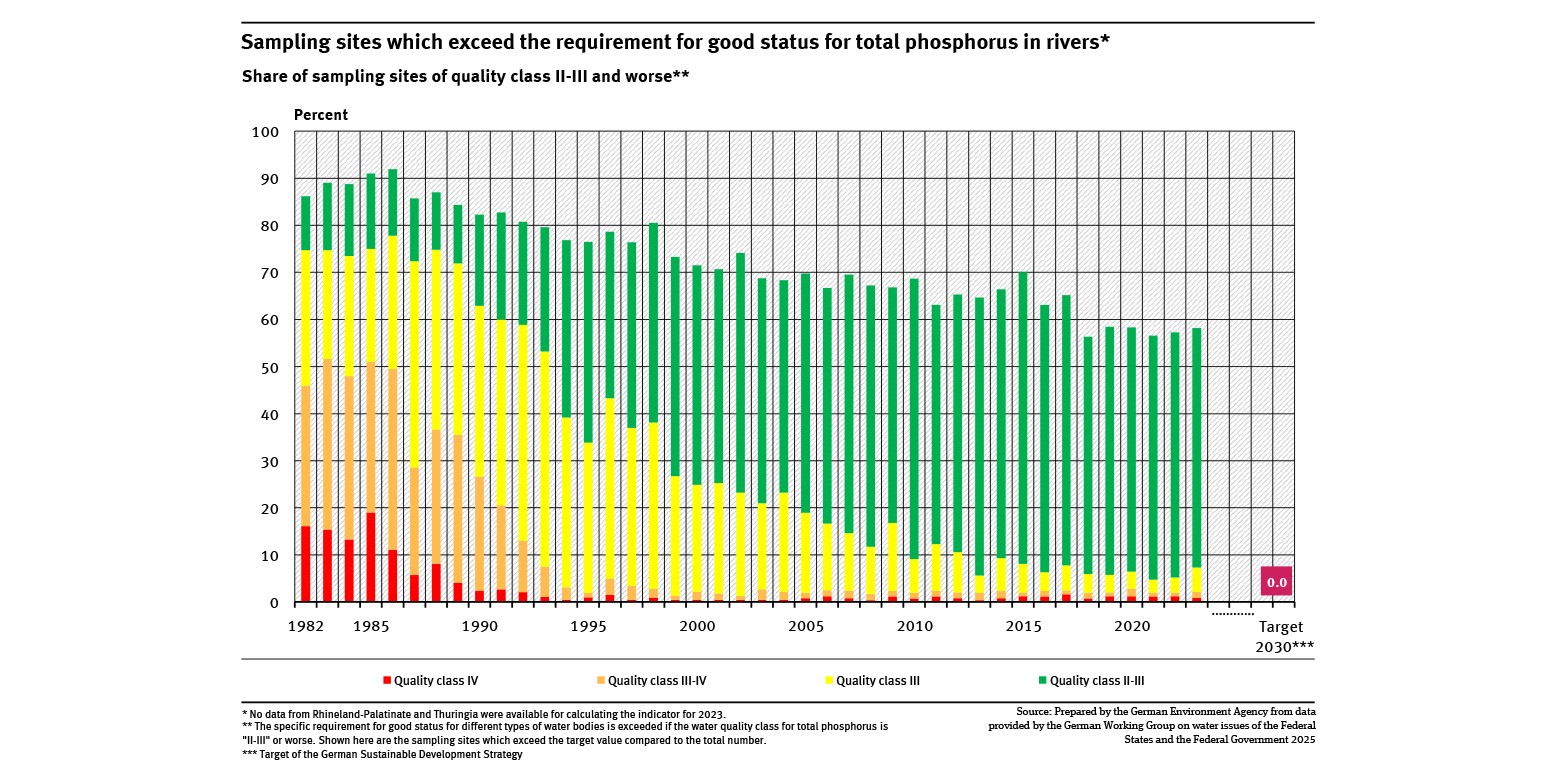
Sampling sites which exceed the requirement for good status for total phosphorus in rivers

  • Wasser
  • Diagramme
  • Umwelt-Indikatoren
  • Daten und Tabellen
Export data
A graph shows the share of pedestrian, utility cycling, railway and passenger transport services in the overall passenger transport volume. Shown here are the years between 2003 and 2022. There has been changes in method in this period in 2003 and 2007.

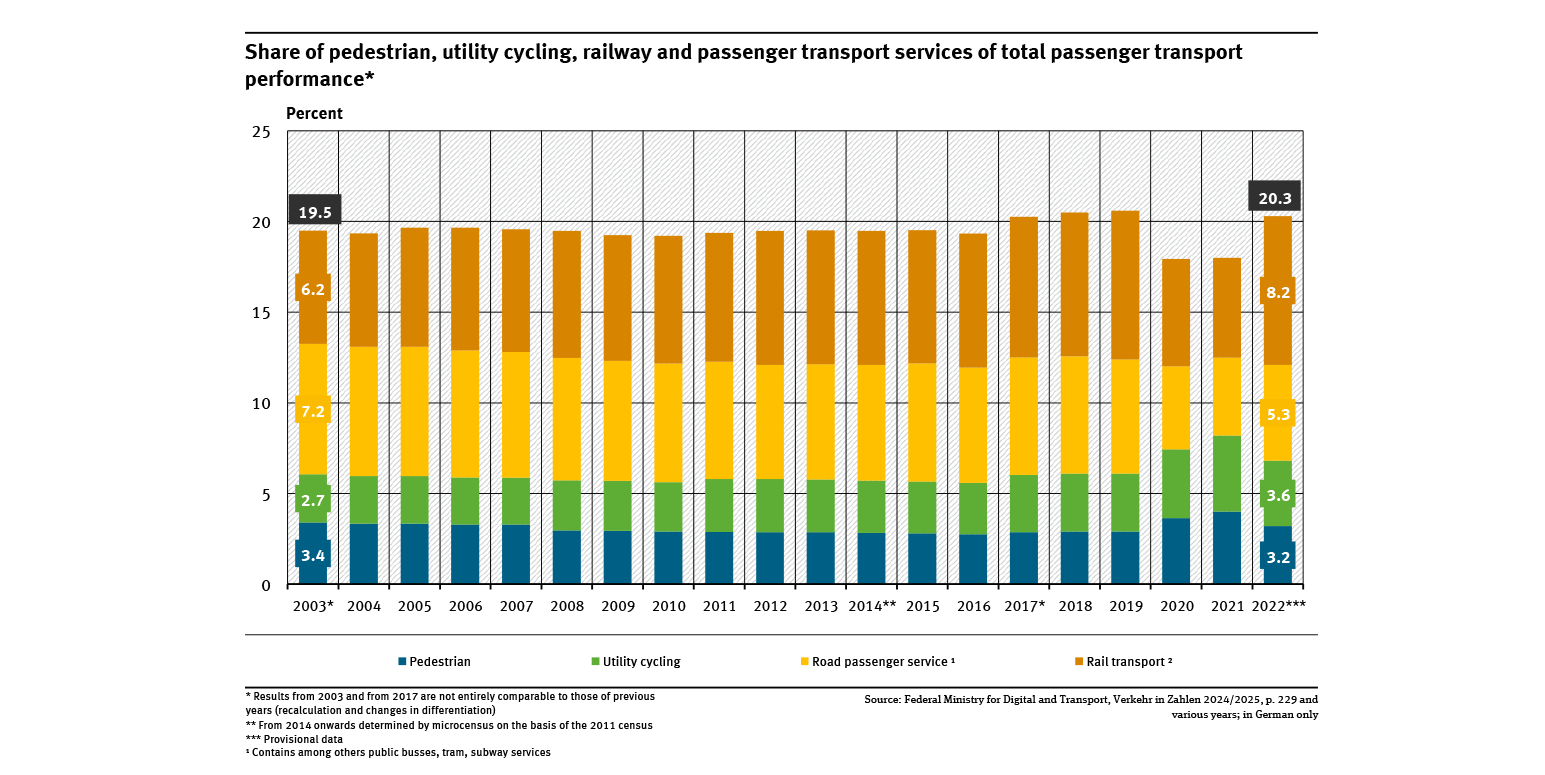
Share of pedestrian, utility cycling, railway and passenger transport services ...

  • Verkehr
  • Diagramme
  • Umwelt-Indikatoren
  • Daten und Tabellen
Export data
A graph shows the shares of rail and inland shipping in freight transport volume between 1999 and 2023. The share of rail transport first increased and then began to stagnate, while the share of inland shipping declined.

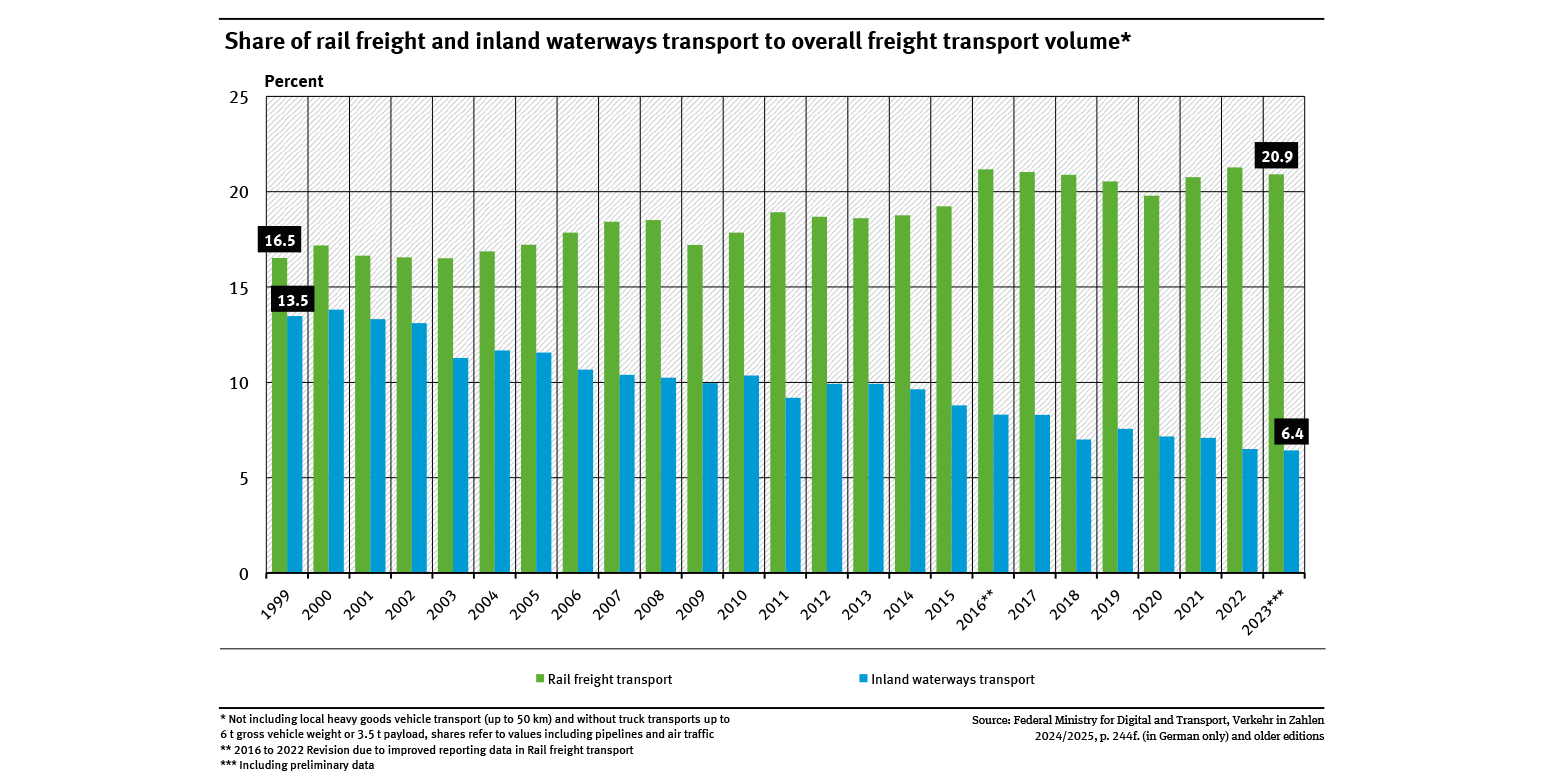
Share of rail freight and inland waterways transport to overall freight transport volume

  • Verkehr
  • Diagramme
  • Umwelt-Indikatoren
  • Daten und Tabellen
Export data

You can also search in other data portals of the German Environment Agency

Short link: www.umweltbundesamt.de/n300701en