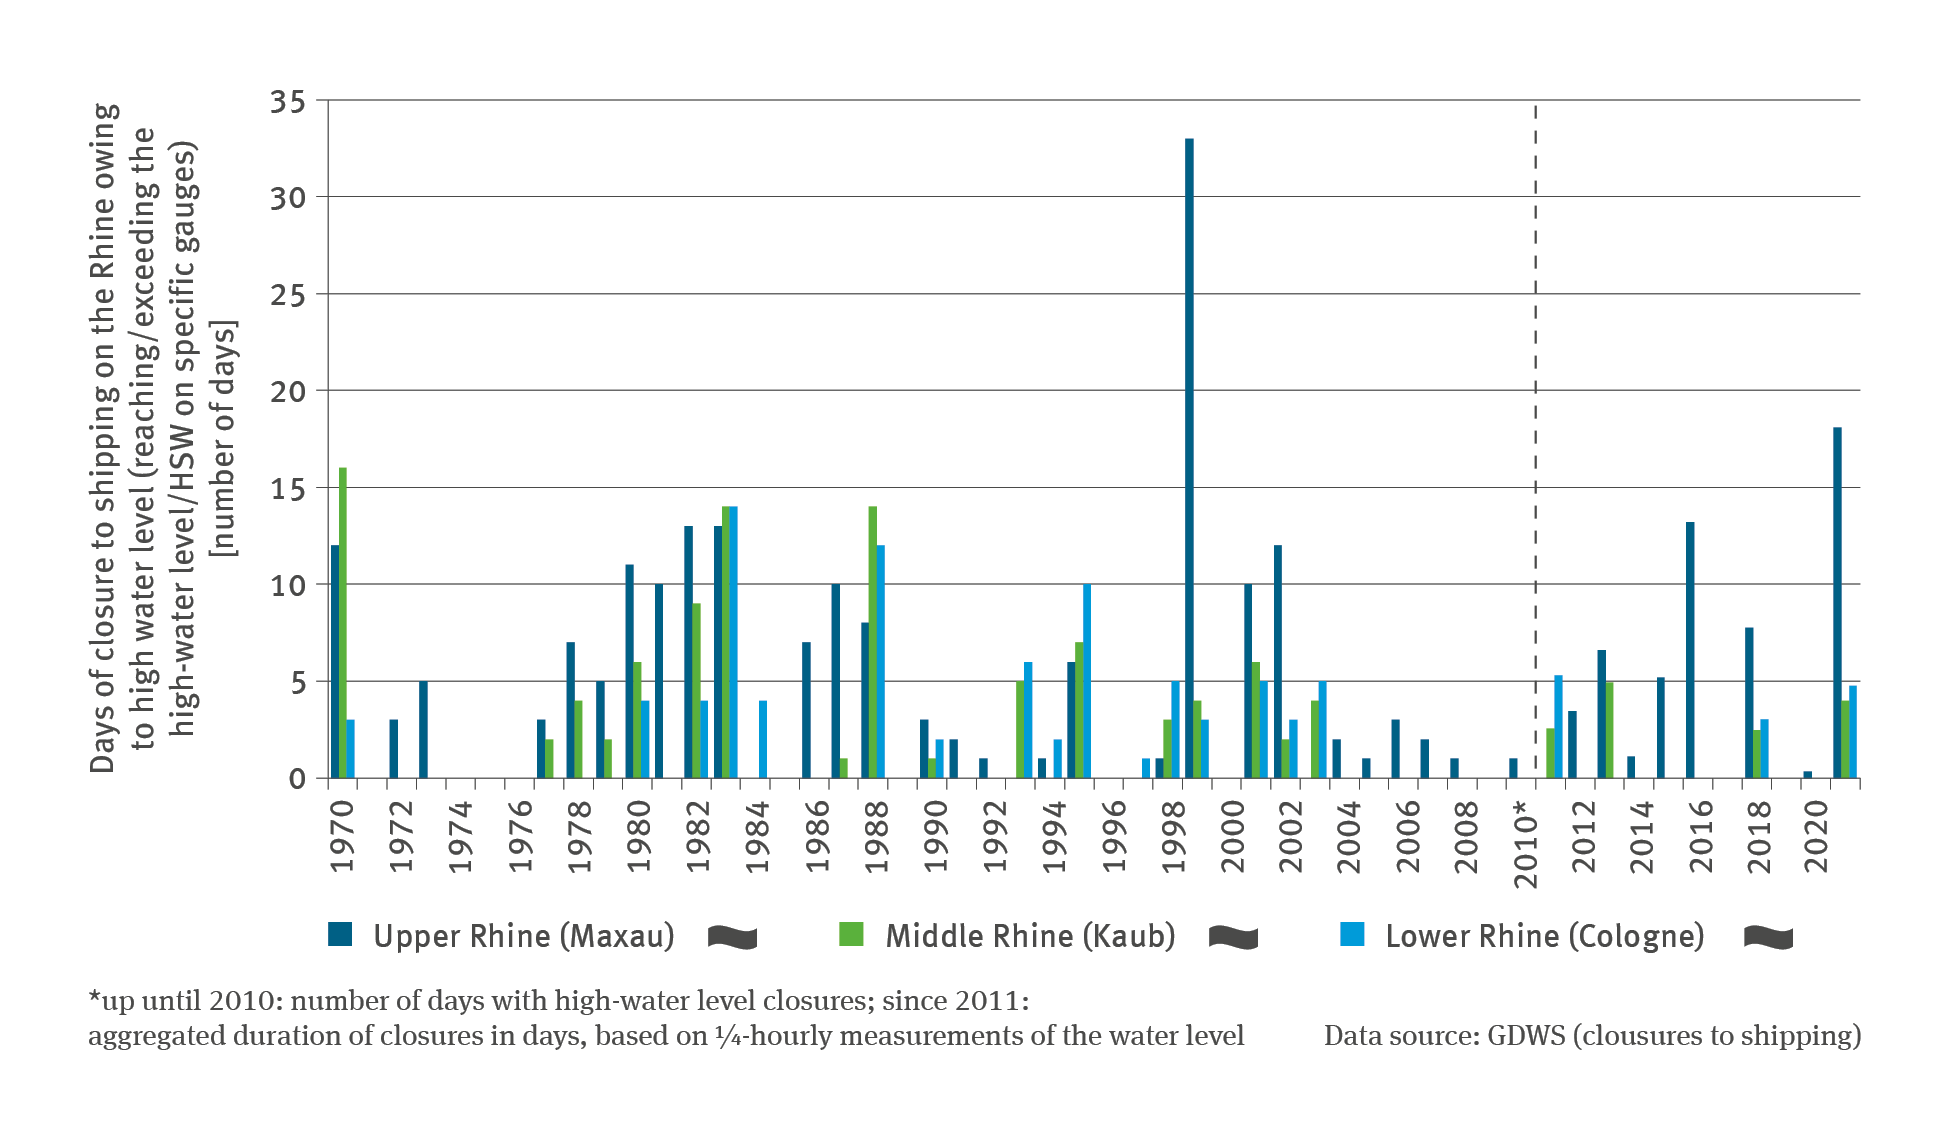
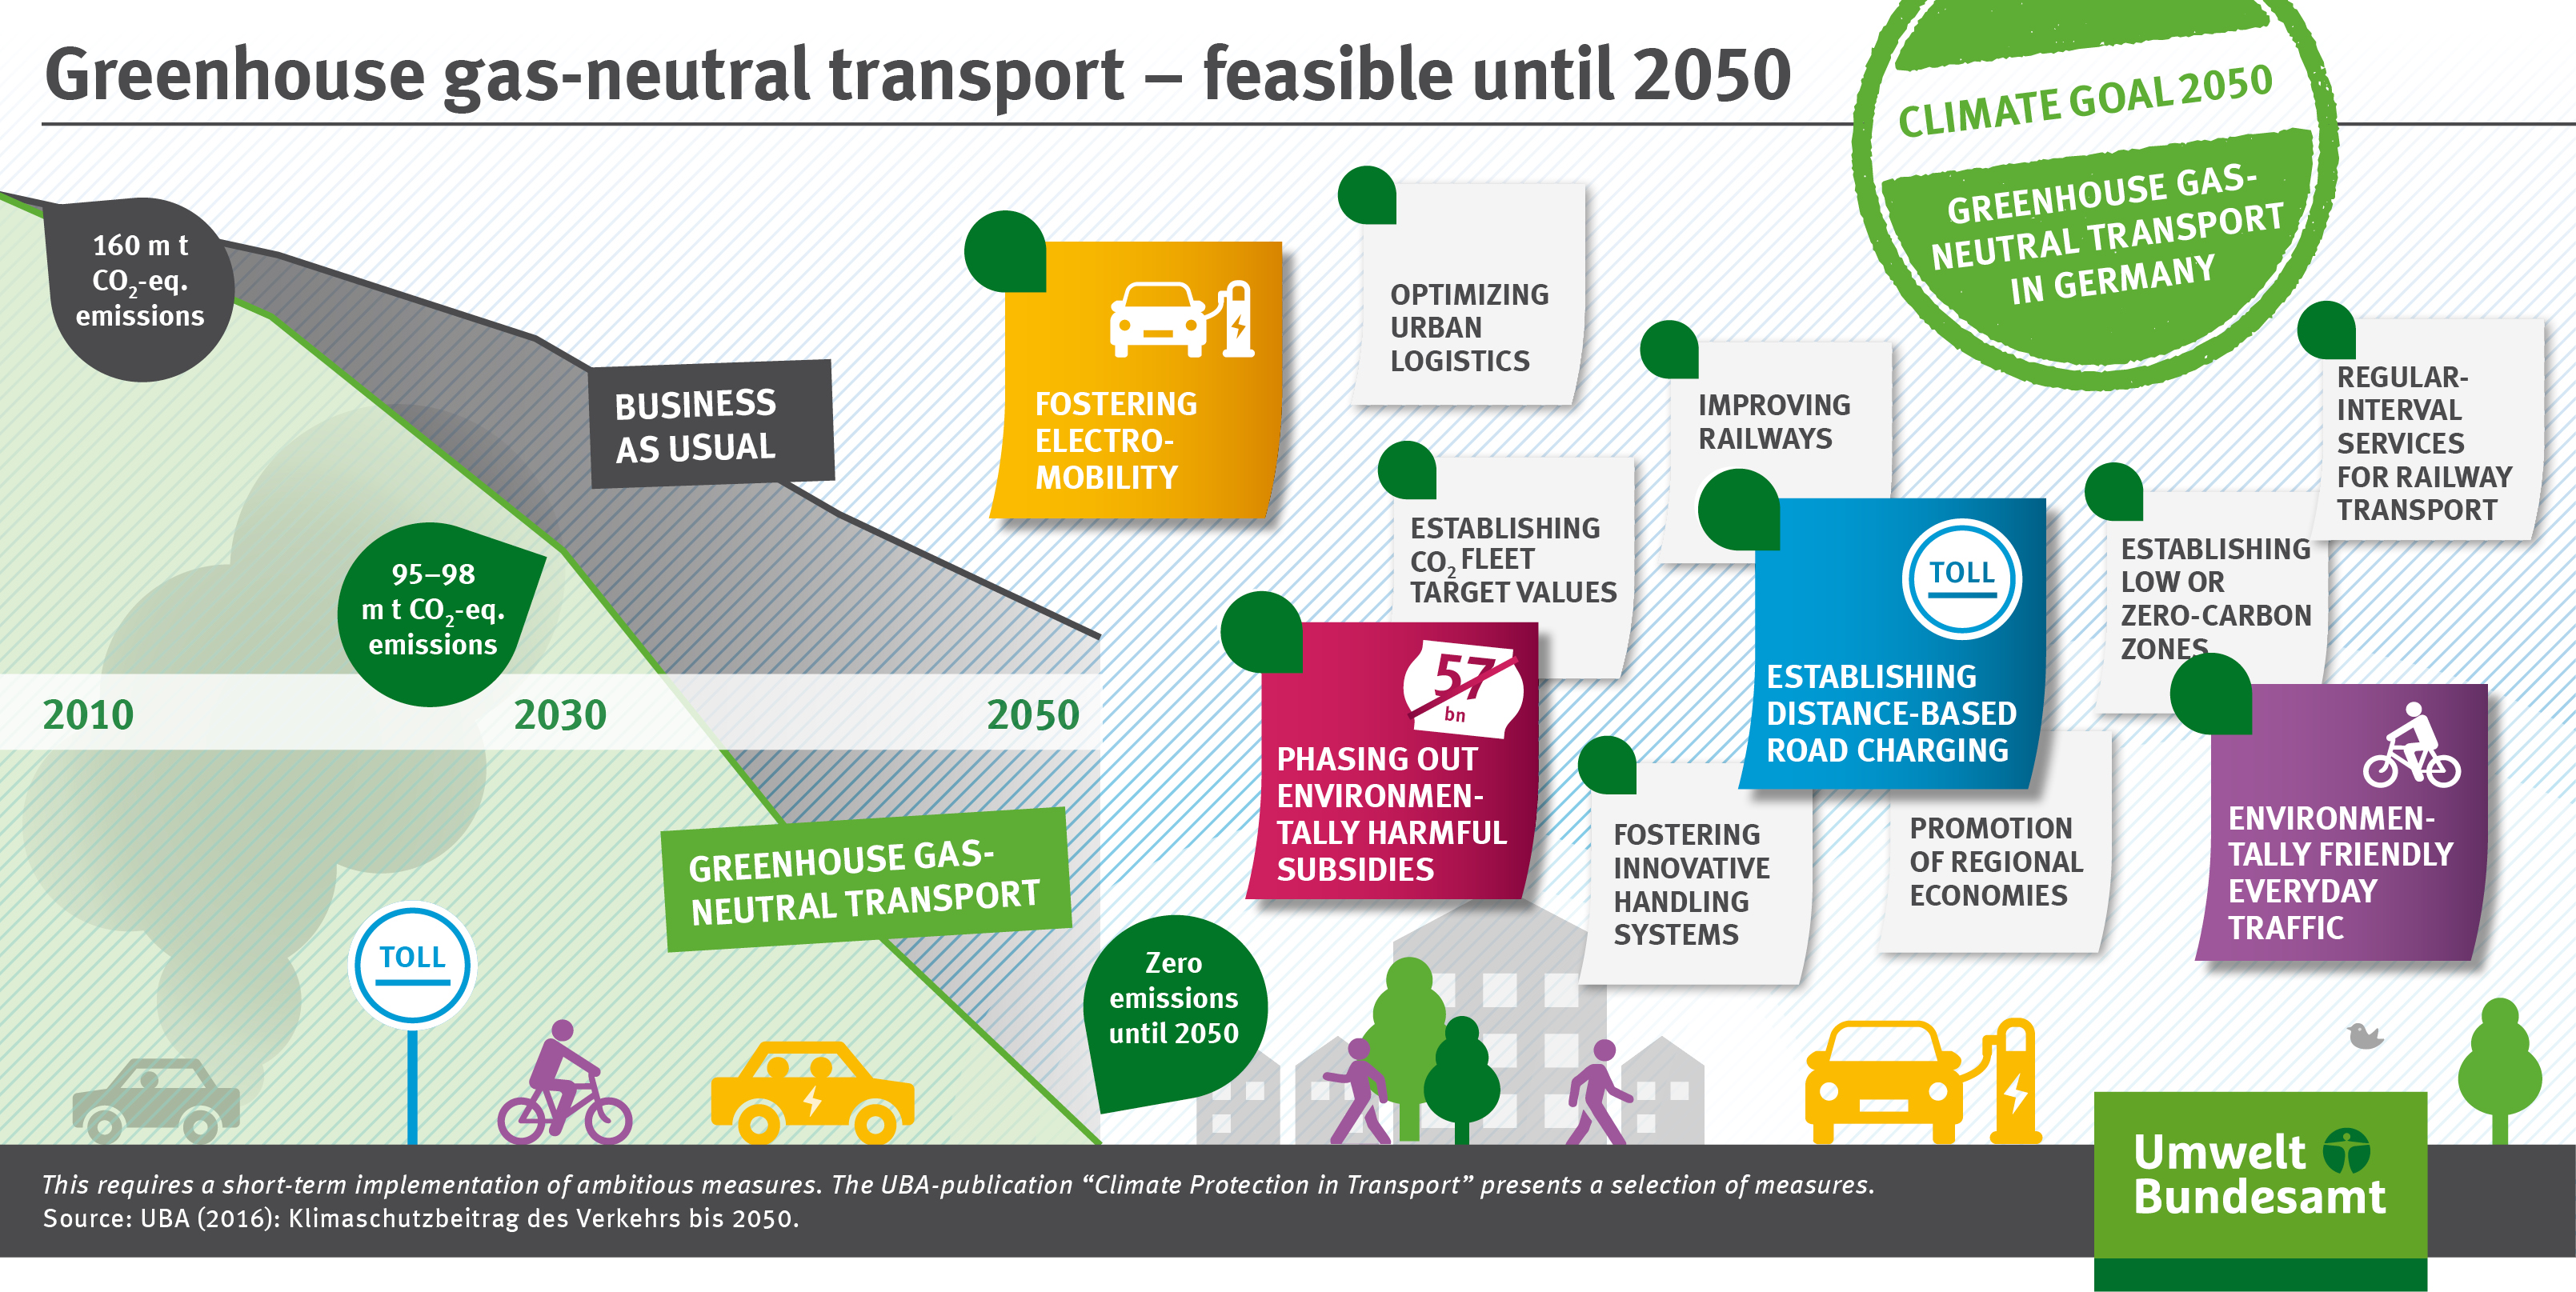
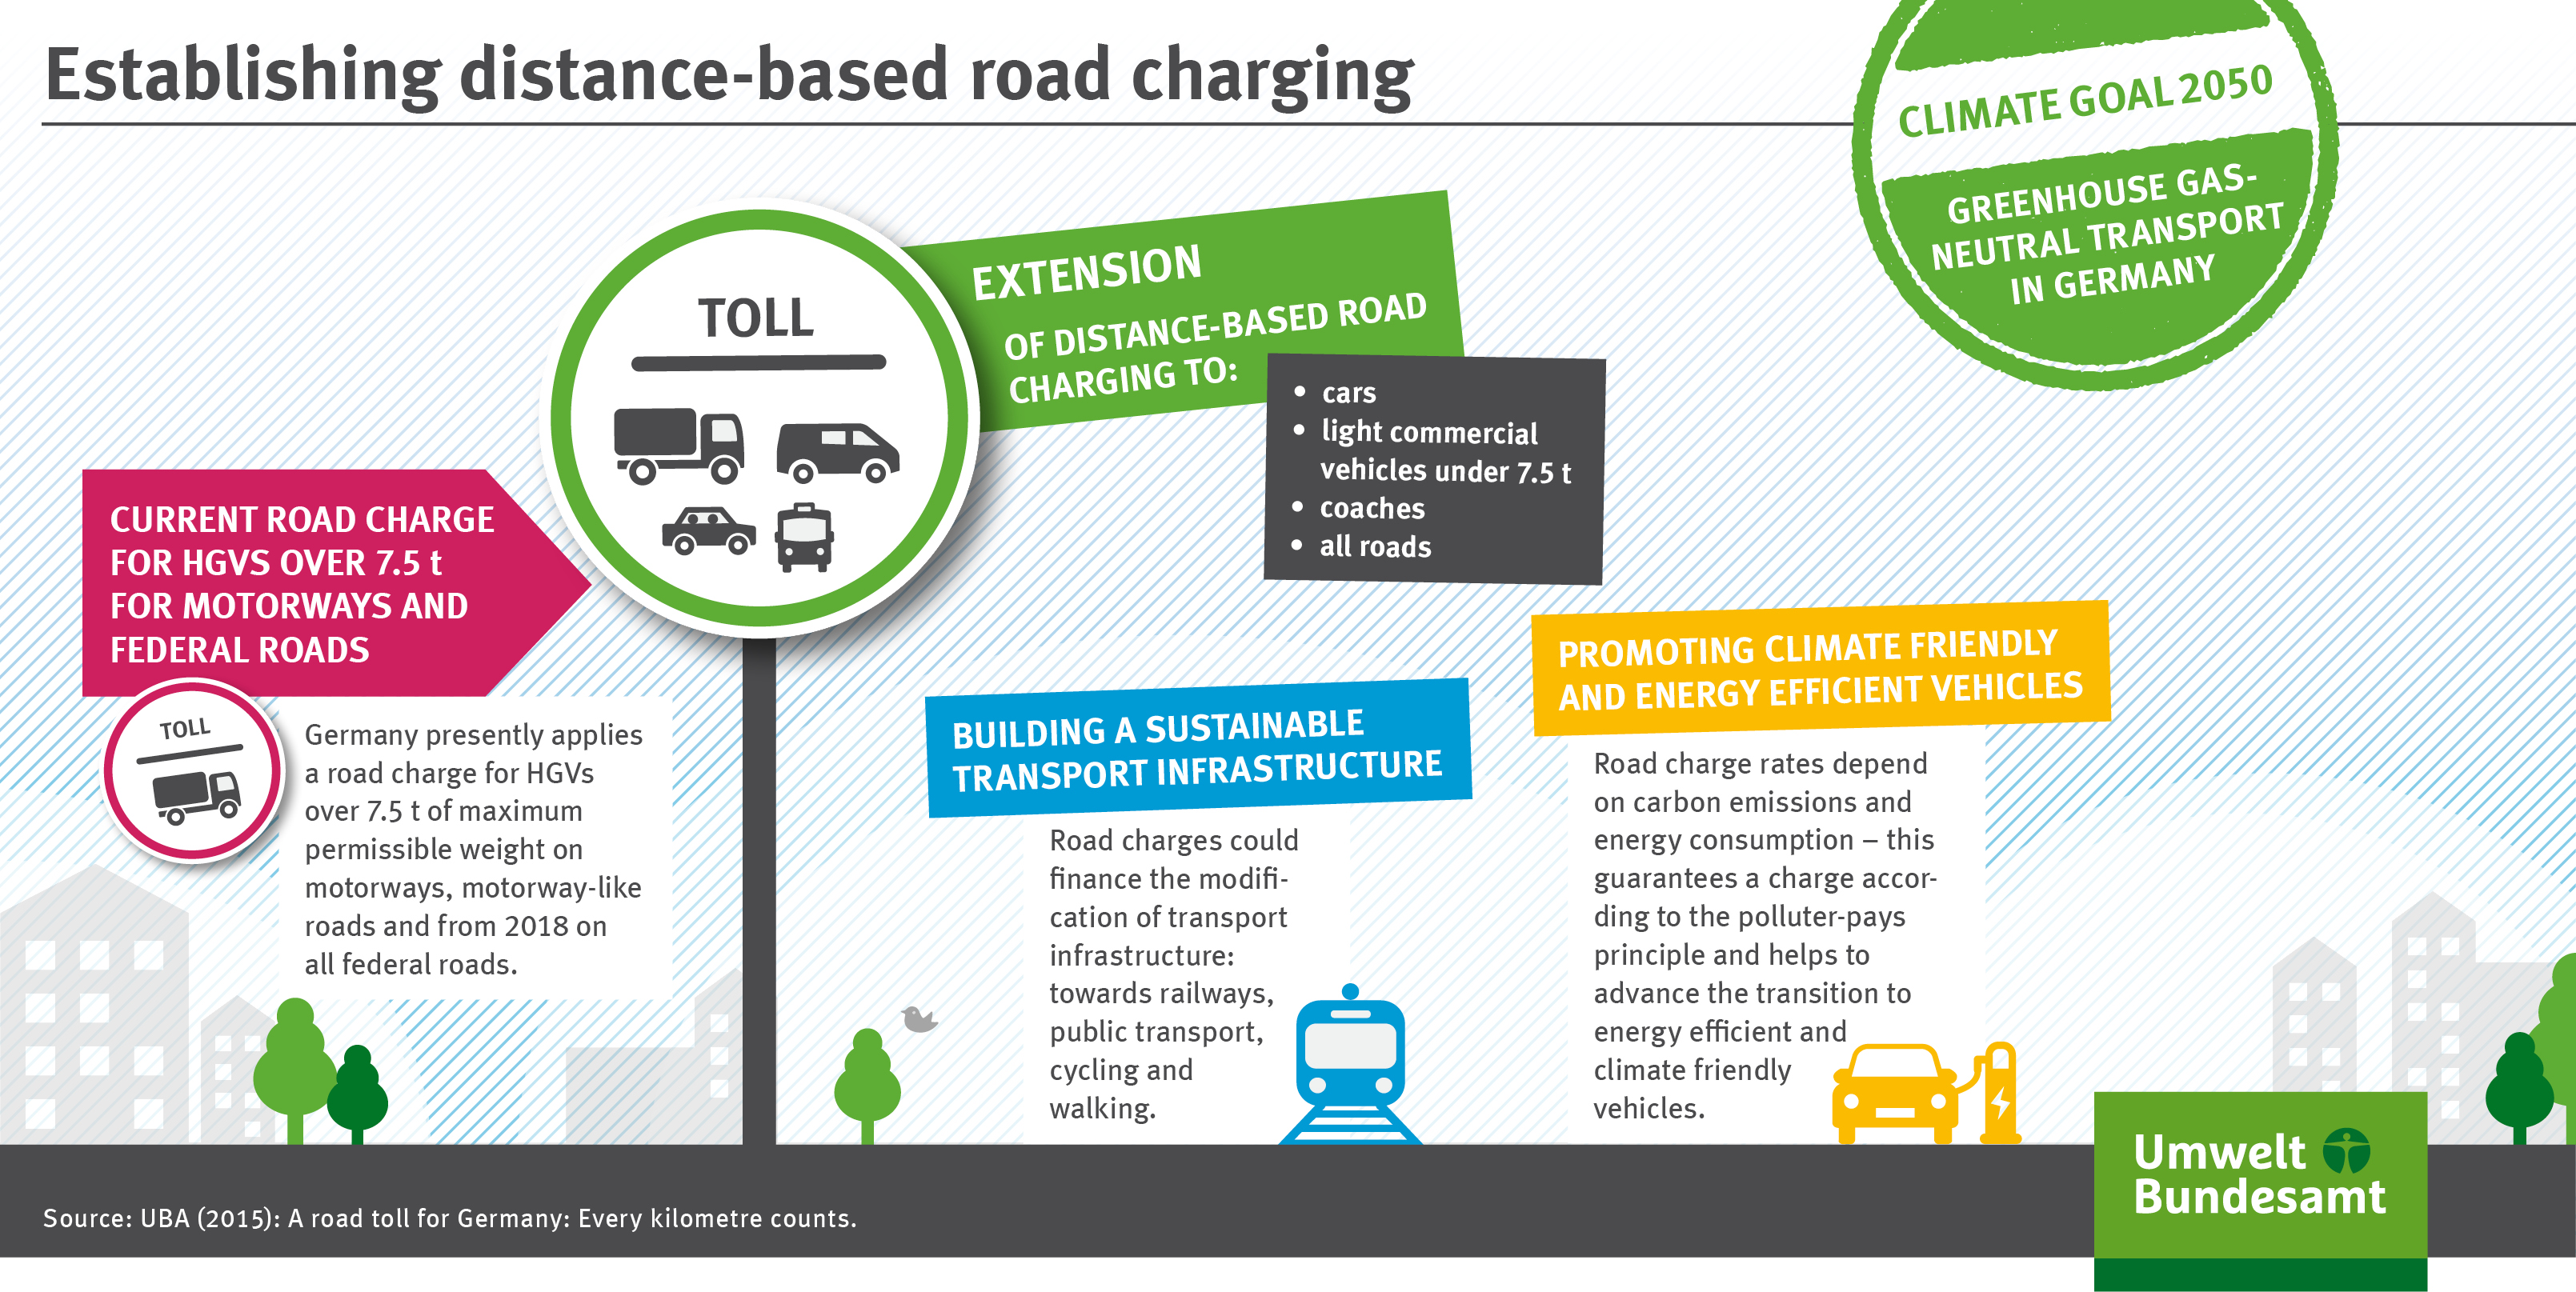
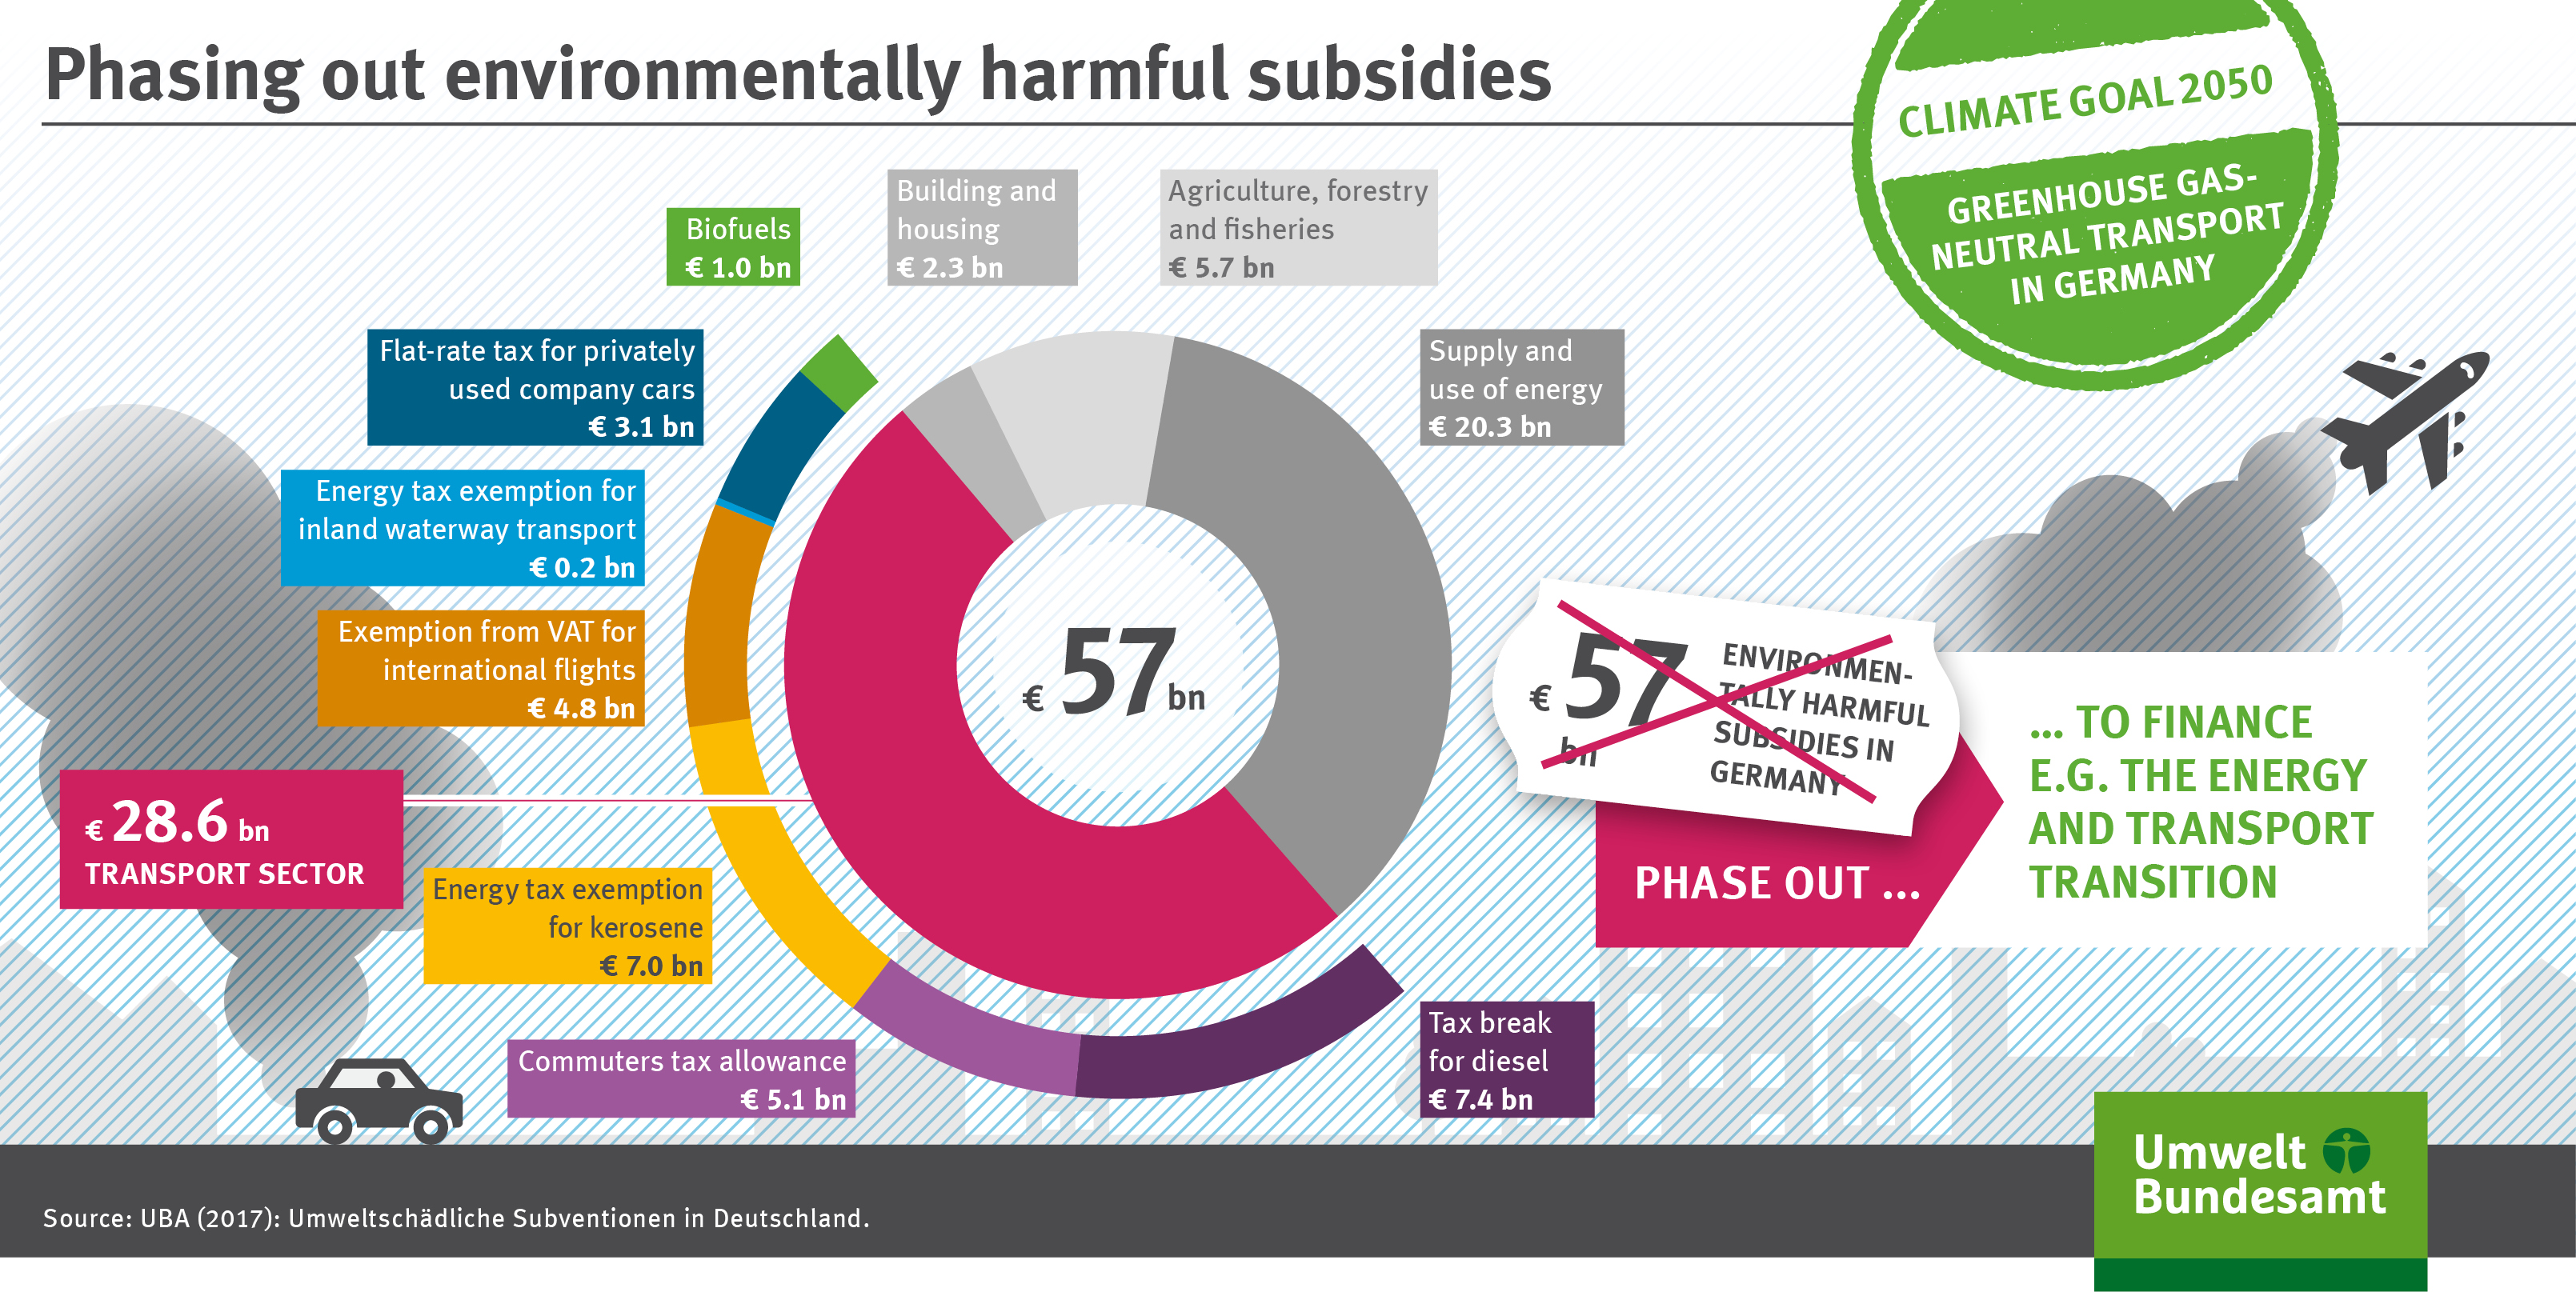
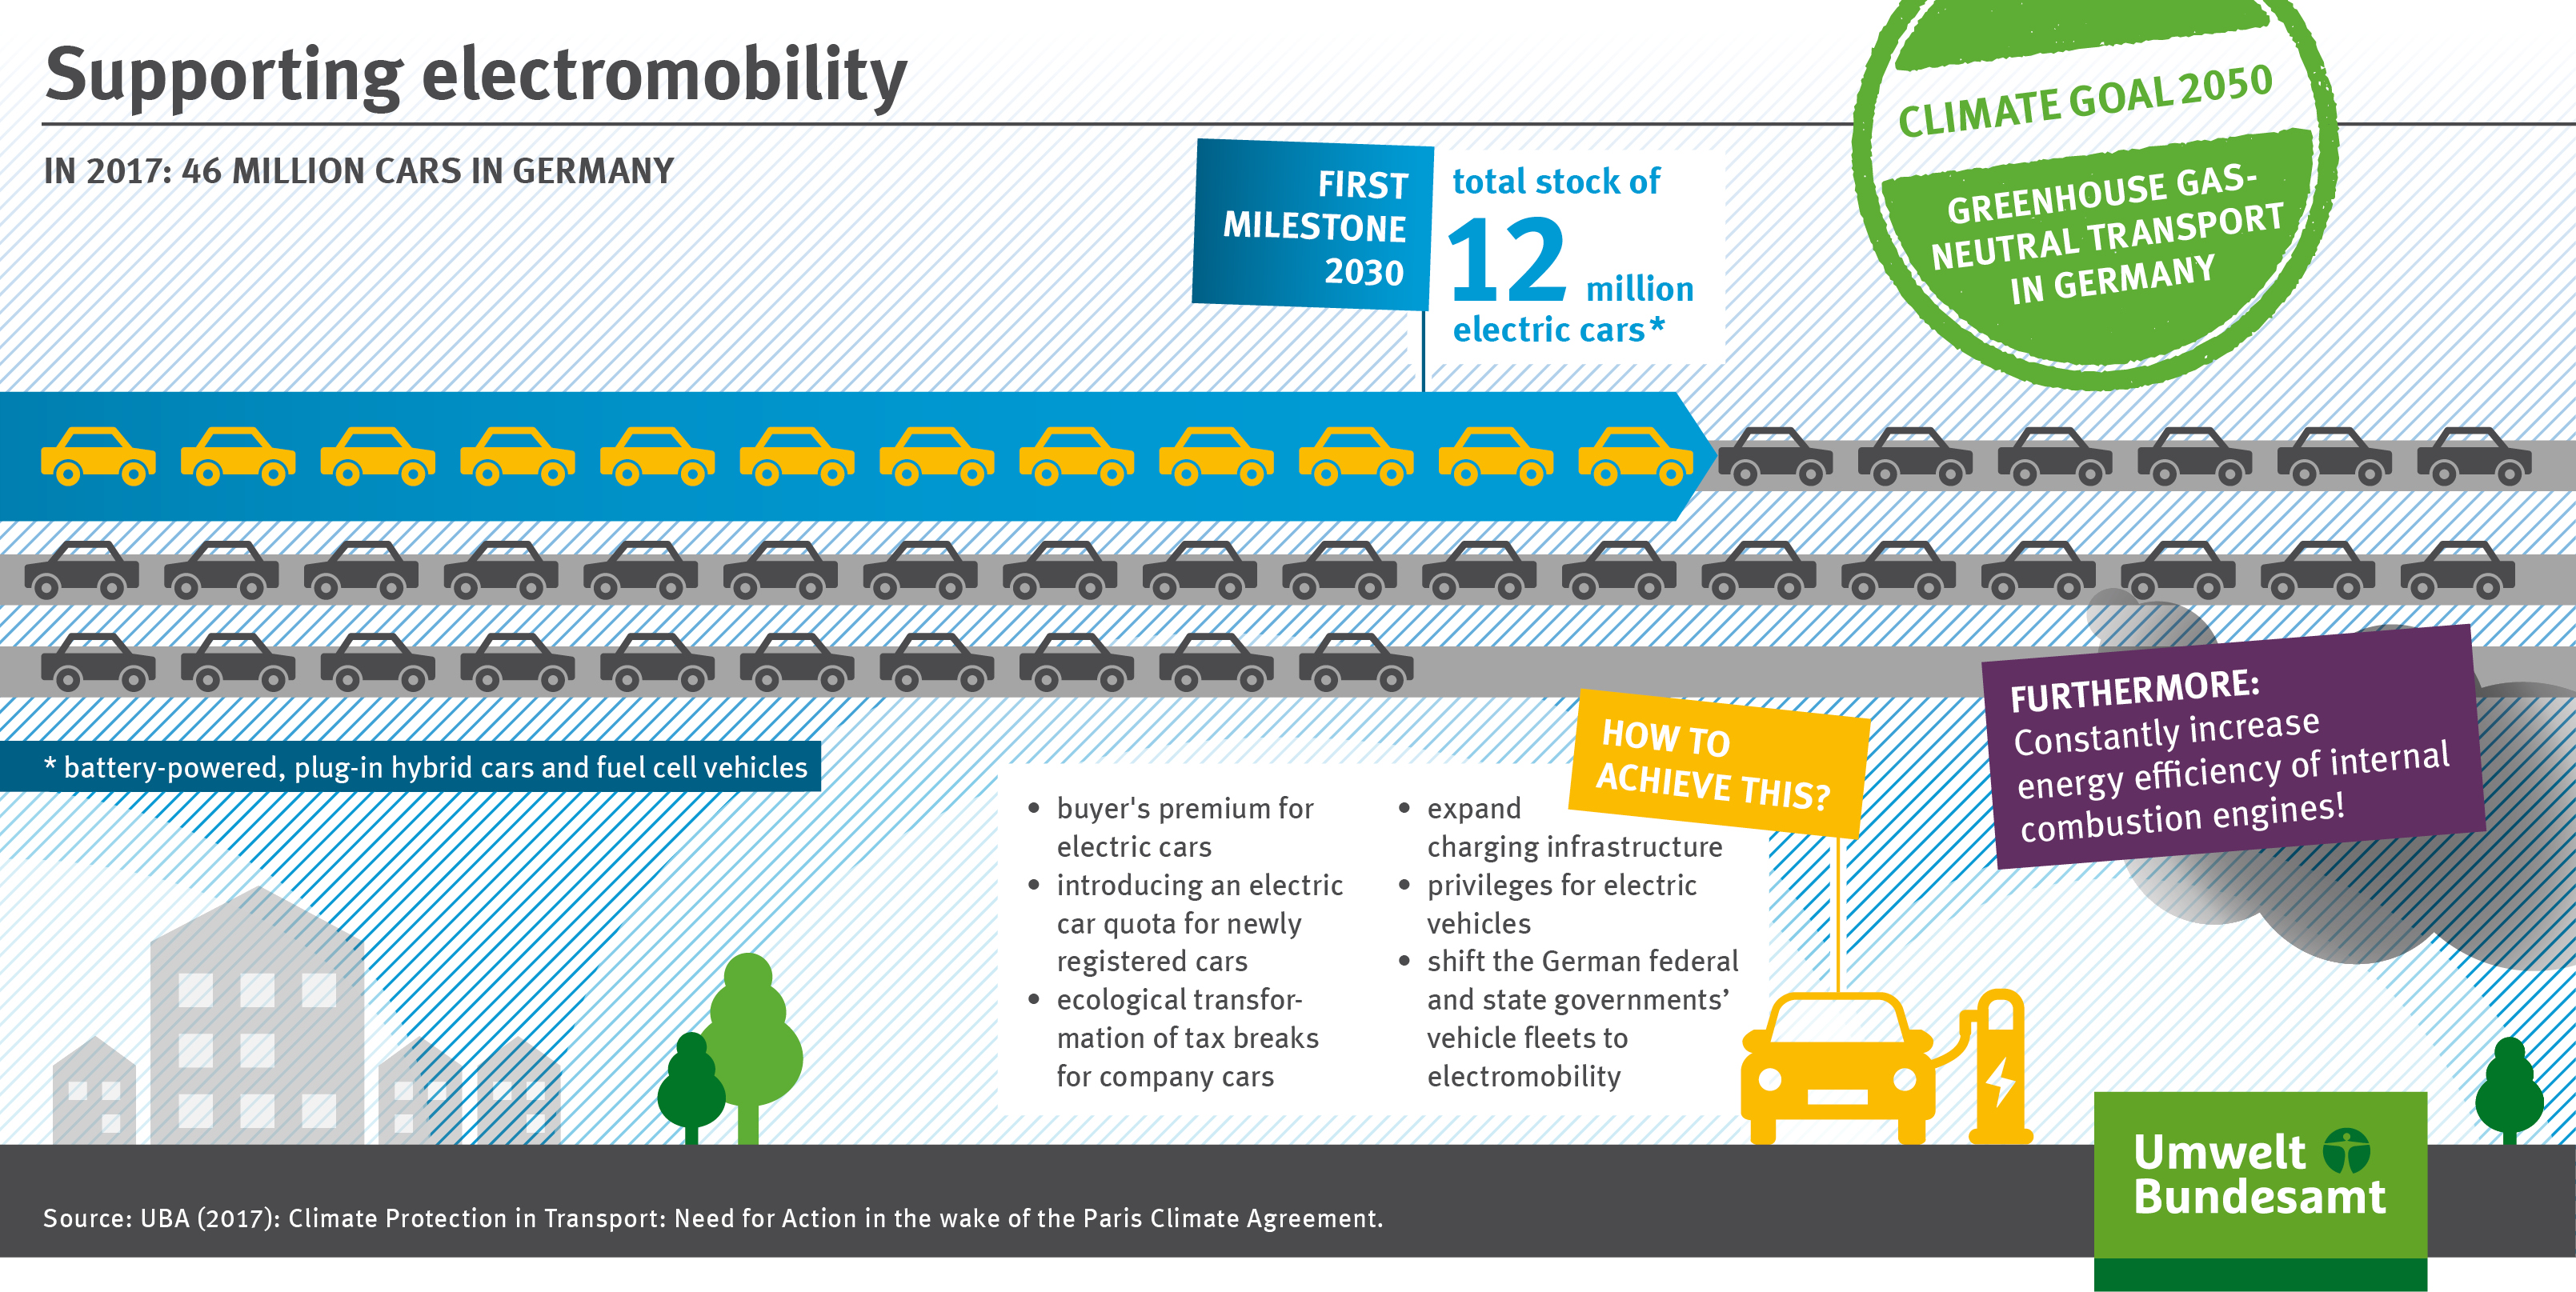
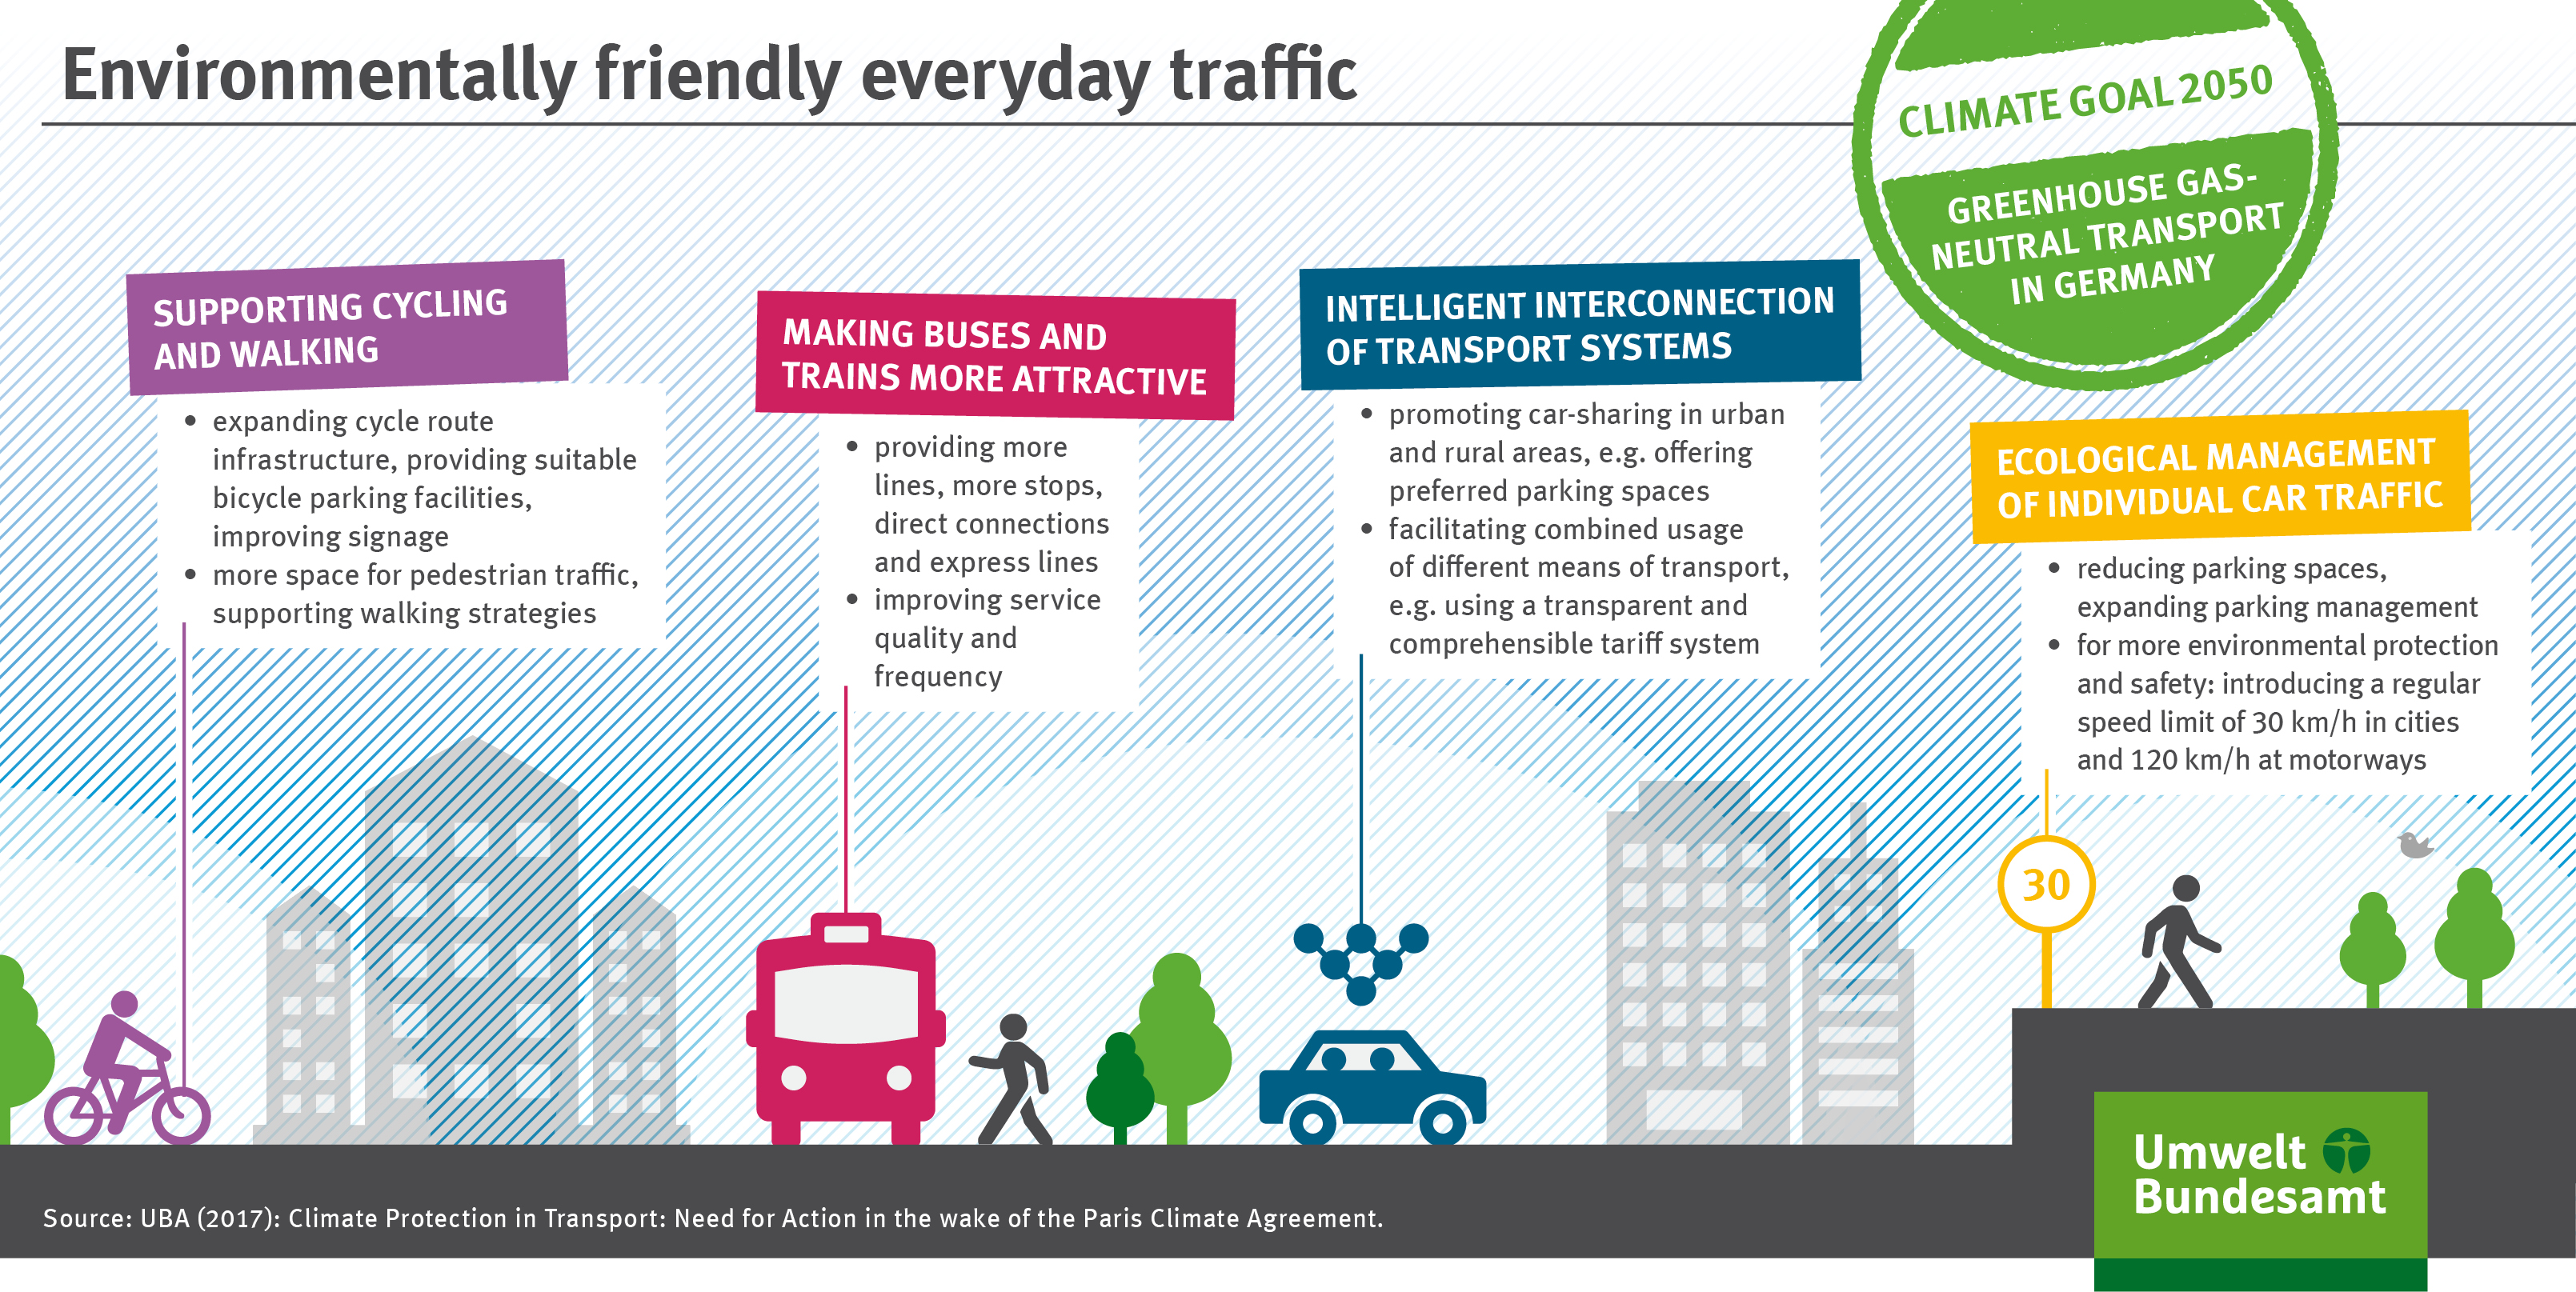
Data Search Data Search Here you will find diagrams, infographics, maps and tables for direct download. Data Search Data topics Show all Klima (132) Energie (23) Luft (19) Fläche, Boden, Land-Ökosysteme (23) Wasser (36) Chemikalien (4) Umwelt und Gesundheit (23) Ressourcen und Abfall (9) (-) Verkehr (16) Land- und Forstwirtschaft (32) Private Haushalte und Konsum (9) Umwelt und Wirtschaft (24) Data types (-) Show all Diagramme (10) Umwelt-Indikatoren (4) Infografiken (5) Karten (0) Daten und Tabellen (5) Refine your search Item language Show also German Reset The search resulted in 16 hits Sort by RelevanceChangedName Order AscDesc 17.12.2024 VE-I-1: High-water closures to shipping on the Rhine Klima Wasser Verkehr Diagramme Export data PNG 05.09.2019 Greenhouse gas-neutral transport - feasible until 2050 Verkehr Infografiken Export data JPG 05.09.2019 Establishing distance-based road charging Verkehr Infografiken Export data JPG 05.09.2019 Phasing out environmentally harmful subsidies Verkehr Infografiken Export data JPG 05.09.2019 Supporting electromobility Verkehr Infografiken Export data JPG 05.09.2019 Environmentally friendly everyday traffic Verkehr Infografiken Export data JPG First page « Previous page ‹ Page 1 Current page 2 of 2 Next page › Last page » You can also search in other data portals of the German Environment Agency


