Skip to main content Skip to main menu Skip to footer

Data Search

Data Search

Here you will find diagrams, infographics, maps and tables for direct download.

Data Search

The XY scatter chart FW-I-2 ’Incremental growth in timber’ shows dots representing the annual incremental growth on the area of ground (growth in thickwood with bark) in square metres per hectare and year, differentiated by the following tree species: spruce, beech, oak and pine, for the periods of 2002 to 2008, 2008 to 2012 and 2012 to 2017 respectively. As yet, there are no data available for the years of 2017 to 2022. The incremental growth rates for beech, oak and pine trees have declined since 2002.

FW-I-2: Incremental growth in timber

  • Klima
  • Land- und Forstwirtschaft
  • Diagramme
Export data
PNG
The bar chart shows the annual change in tree species composition in natural forest reserves including the major climate change increase in percent expected for the periods 1971 to 2014, 2014 to 2018 and 2019 to 2023.

FW-I-1: Tree species composition in forest nature reserves – case study

  • Klima
  • Land- und Forstwirtschaft
  • Diagramme
Export data
PNG
The line chart shows the observed mean onset of flowering of winter rapeseed and early-ripening apples in terms of calendar days from the beginning of the year onwards.

LW-I-1: Agrophenological phase shifts

  • Klima
  • Land- und Forstwirtschaft
  • Diagramme
Export data
PNG
The illustration contains a biaxial chart. The terrain of permanent grassland is illustrated by means of bars, in units of 1,000 hectares. In addition, a line illustrates the proportion of permanent grassland compared to terrain in agricultural use. Both time series contain data for the years of 1991 to 2021 indicating a trend reversal towards a rising trend.

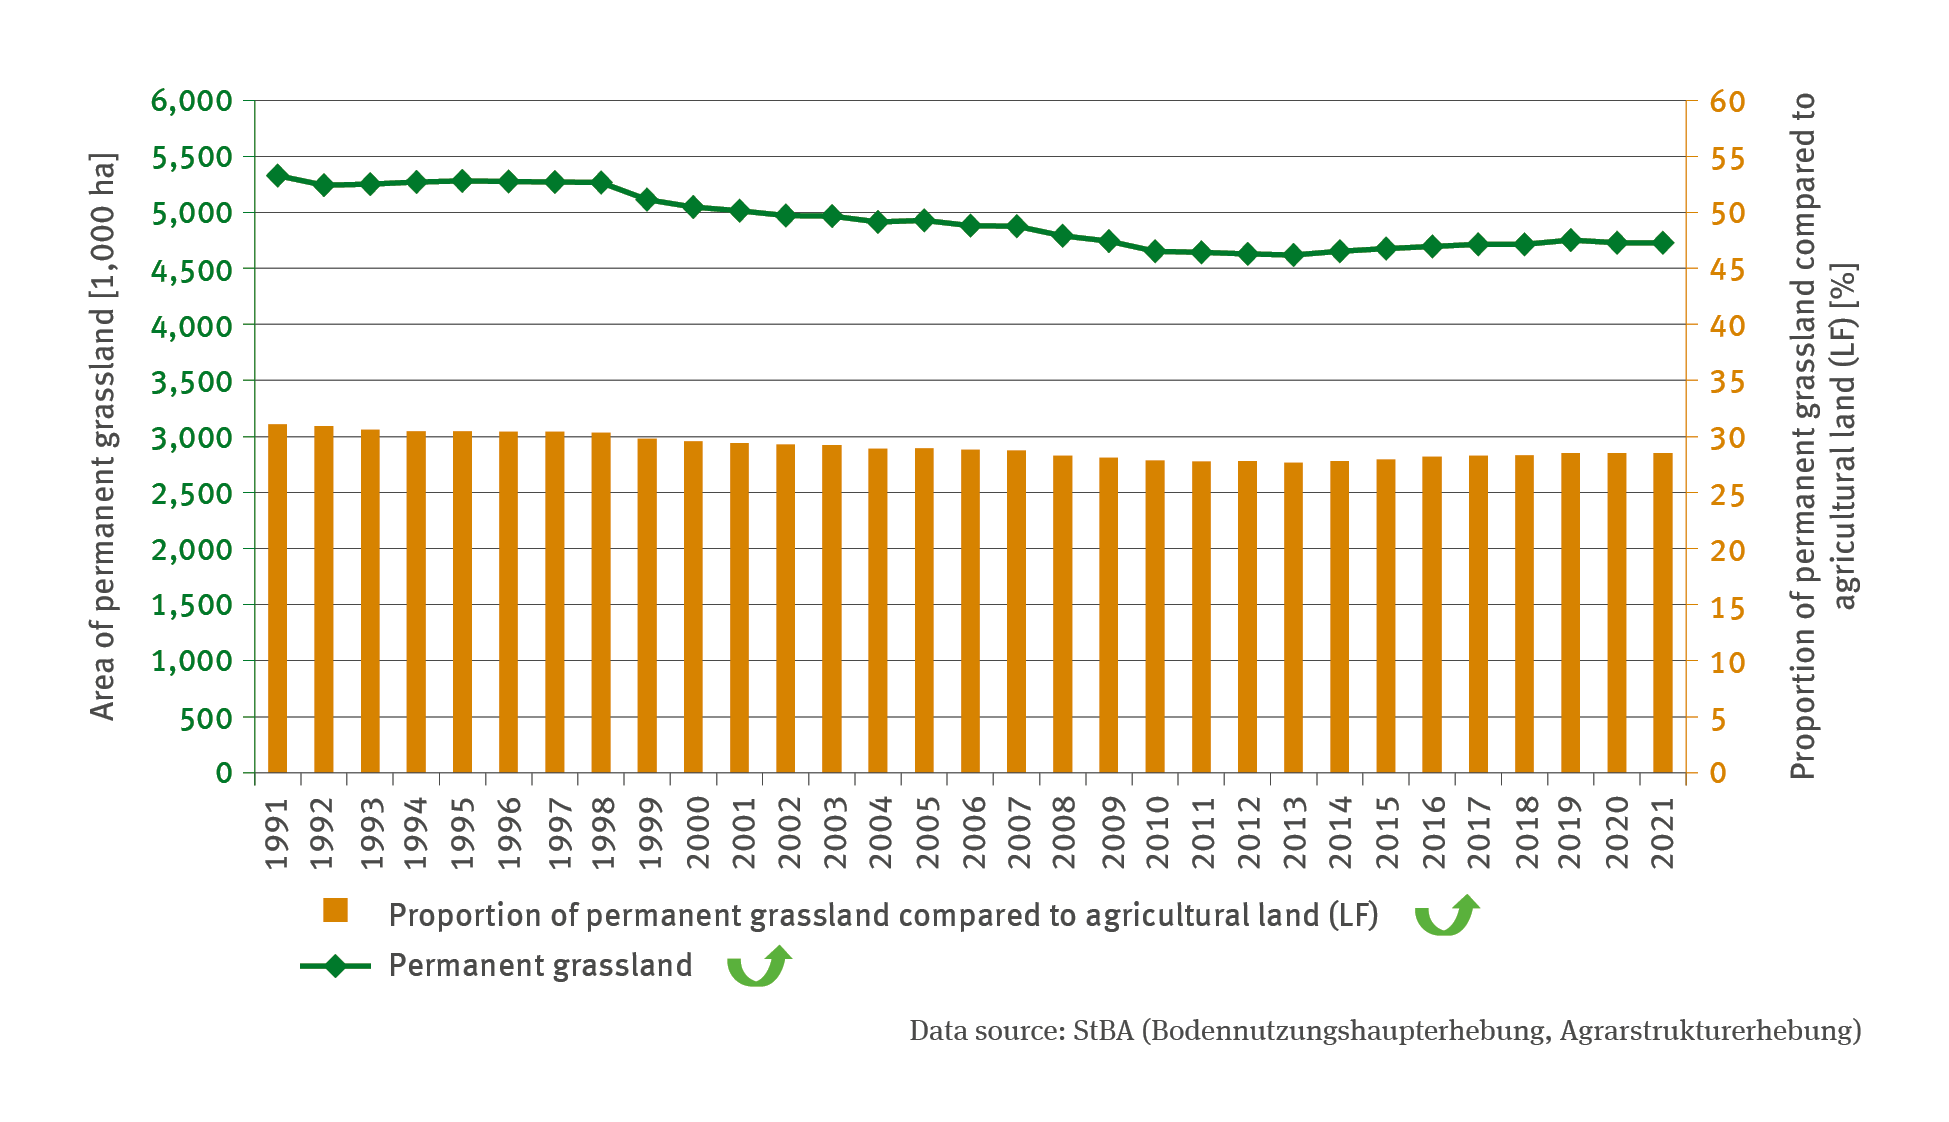
BO-R-2: Permanent grassland terrain

  • Klima
  • Fläche, Boden, Land-Ökosysteme
  • Land- und Forstwirtschaft
  • Diagramme
Export data
PNG
The illustration contains a line chart which indicates the development of soil water reserves in agriculturally used soils as a percentage of usable field capacity. The time series extends from 1961 to 2021.

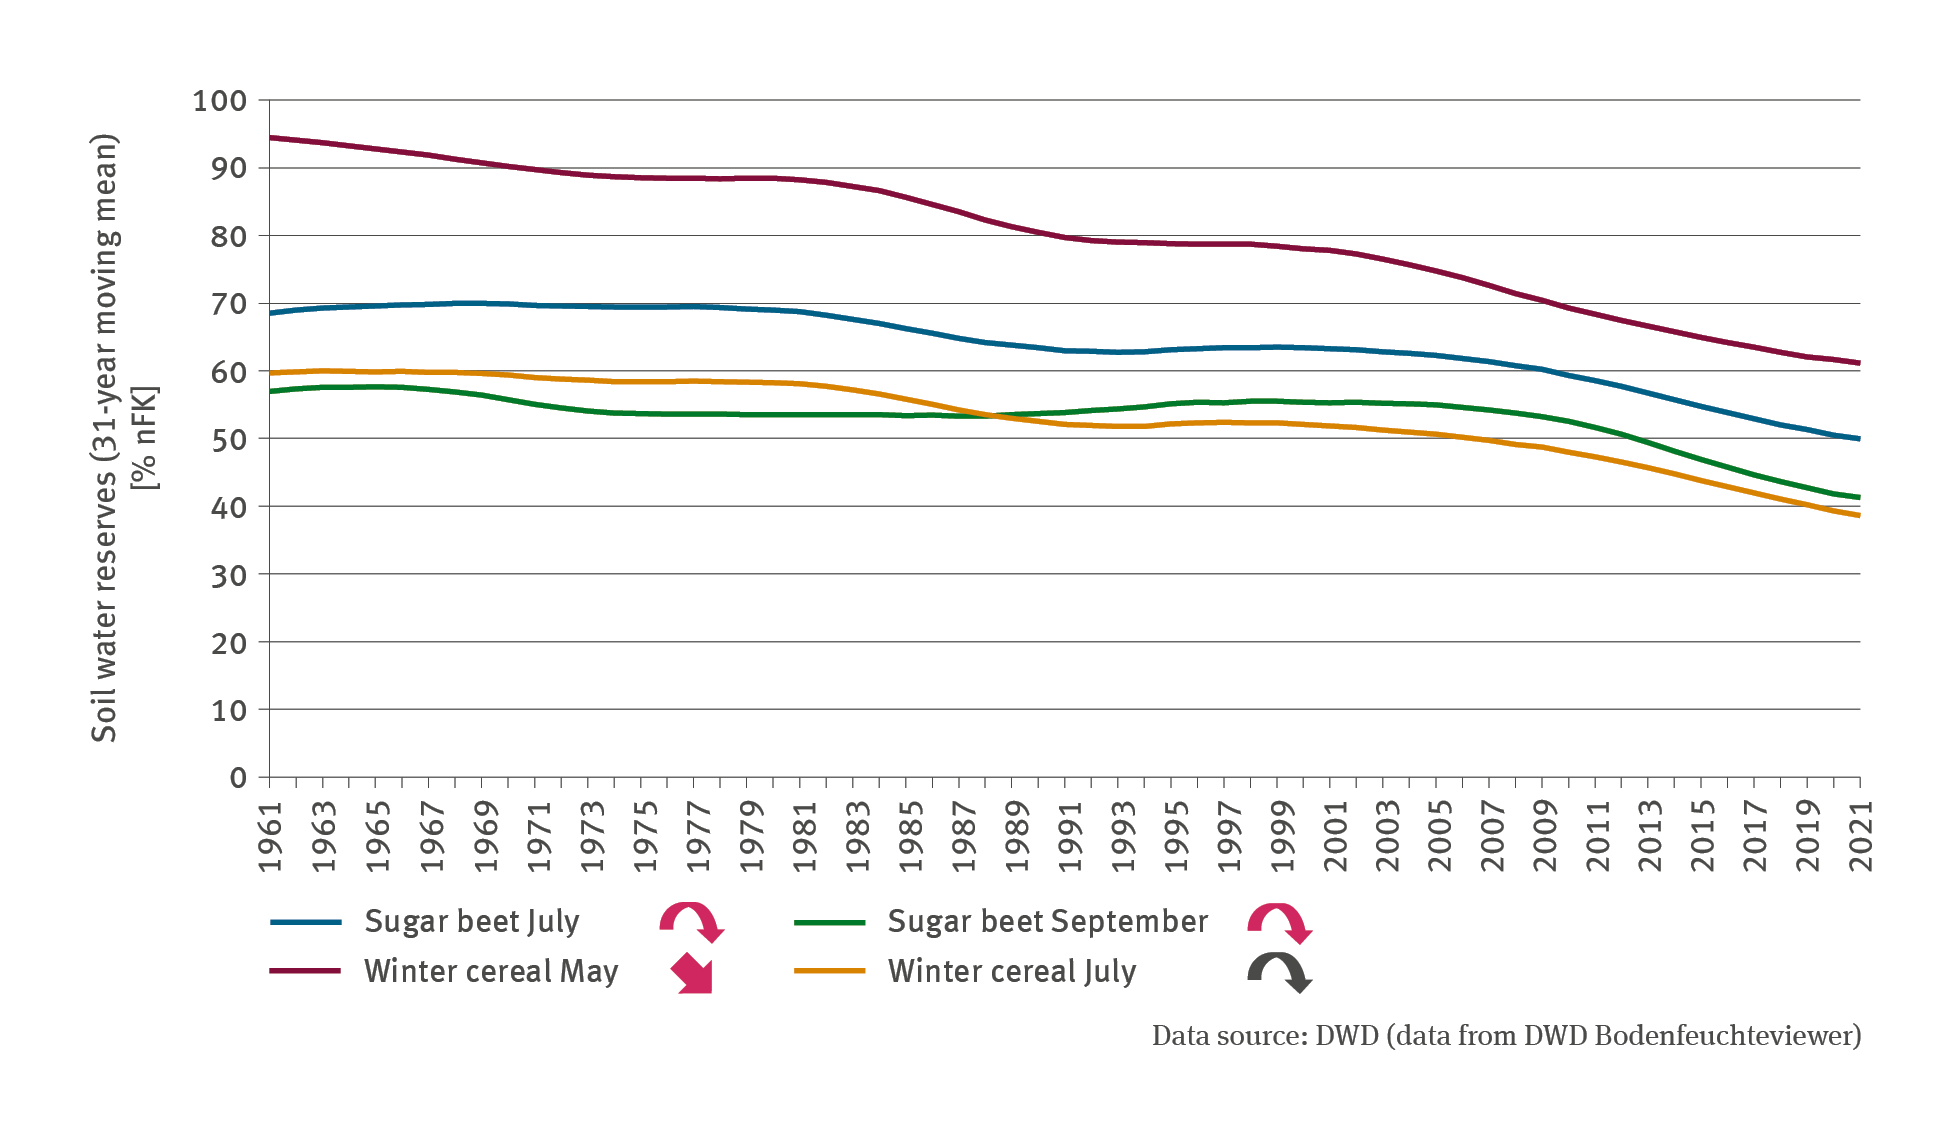
BO-I-1: Soil water in agriculturally used soils

  • Klima
  • Fläche, Boden, Land-Ökosysteme
  • Wasser
  • Land- und Forstwirtschaft
  • Diagramme
Export data
PNG
A graph shows the agricultural nitrogen surpluses for individual years and as rolling 5-year means between 1990 and 2022. The 5-year-mean nitrogen surpluses in kilogrammes per hectare dropped from 117 to 77. The target for 2028-32 is 70 kilogrammes per hectare and year.

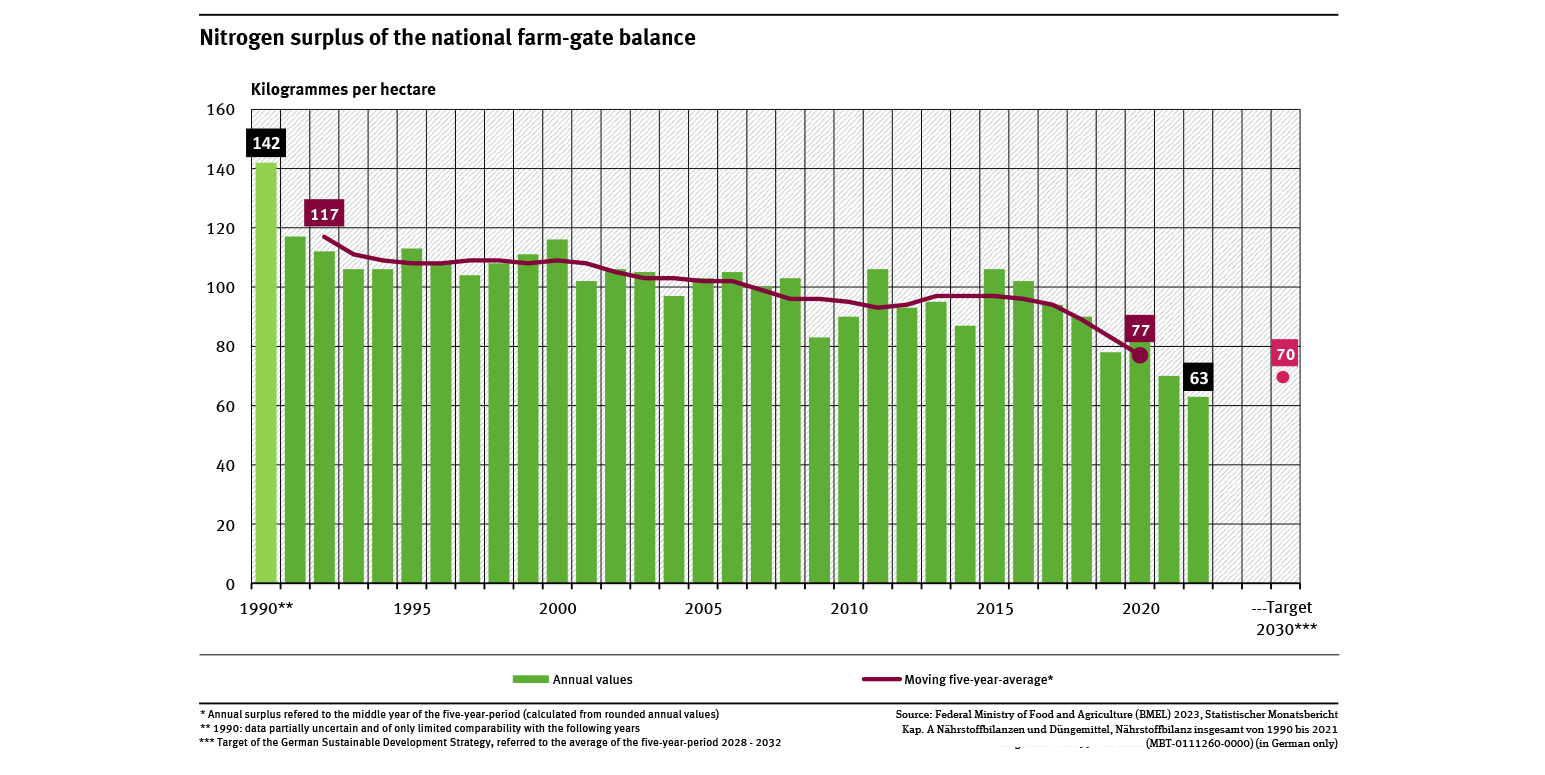
Nitrogen surplus of the national farm-gate balance

  • Fläche, Boden, Land-Ökosysteme
  • Land- und Forstwirtschaft
  • Diagramme
  • Umwelt-Indikatoren
  • Daten und Tabellen
Export data
Export data
PDF
Grafische Darstellung der EU Absatzzahlen

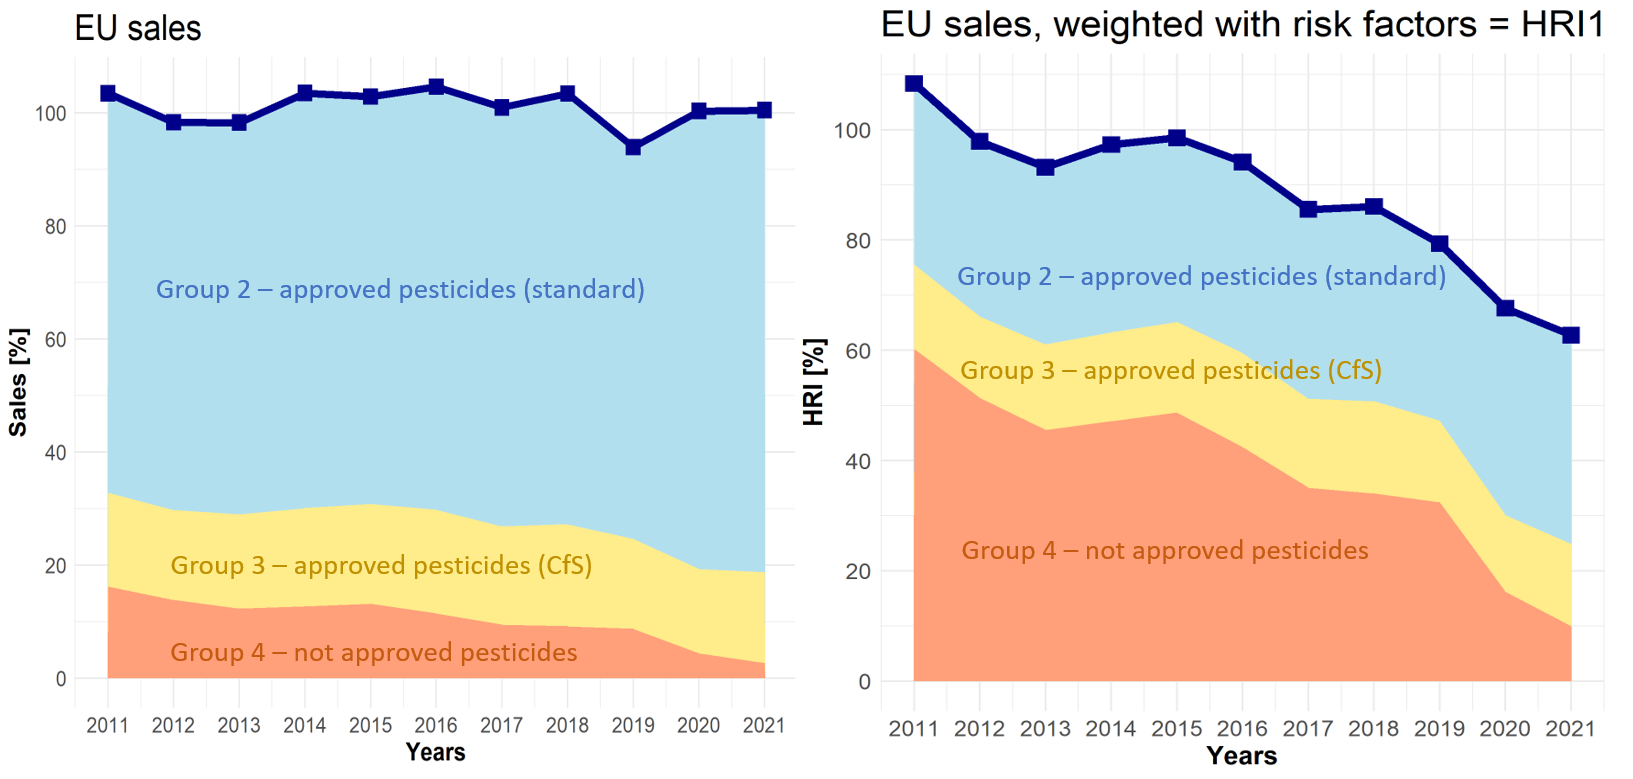
How the EU calculates the pesticide risk down to a minimum.

  • Chemikalien
  • Land- und Forstwirtschaft
  • Diagramme
Export data
A line graph shows the mean crown defoliation in percent for the total forest and the tree species spruce, pine, beech and oak for the period 1991 to 2017. For beech there is a significant increasing trend, for oak it is quadratically decreasing. There is no trend for the other tree species and the total forest.

FW-I-7: Forest condition

  • Klima
  • Land- und Forstwirtschaft
  • Diagramme
Export data
PNG
In a stack column diagram, the share of all incidental uses in the total felling is shown in percent from 1991 to 2012.

FW-I-4: Damaged timber – extent of random use

  • Klima
  • Land- und Forstwirtschaft
  • Diagramme
Export data
PNG

You can also search in other data portals of the German Environment Agency

Short link: www.umweltbundesamt.de/n300701en