Skip to main content Skip to main menu Skip to footer

LW-I-2: Yield fluctuations

The bar chart shows the deviation in percent of winter wheat yields and silage maize yields from the mean of 6 preceding years for the period of 1986 to 2021.
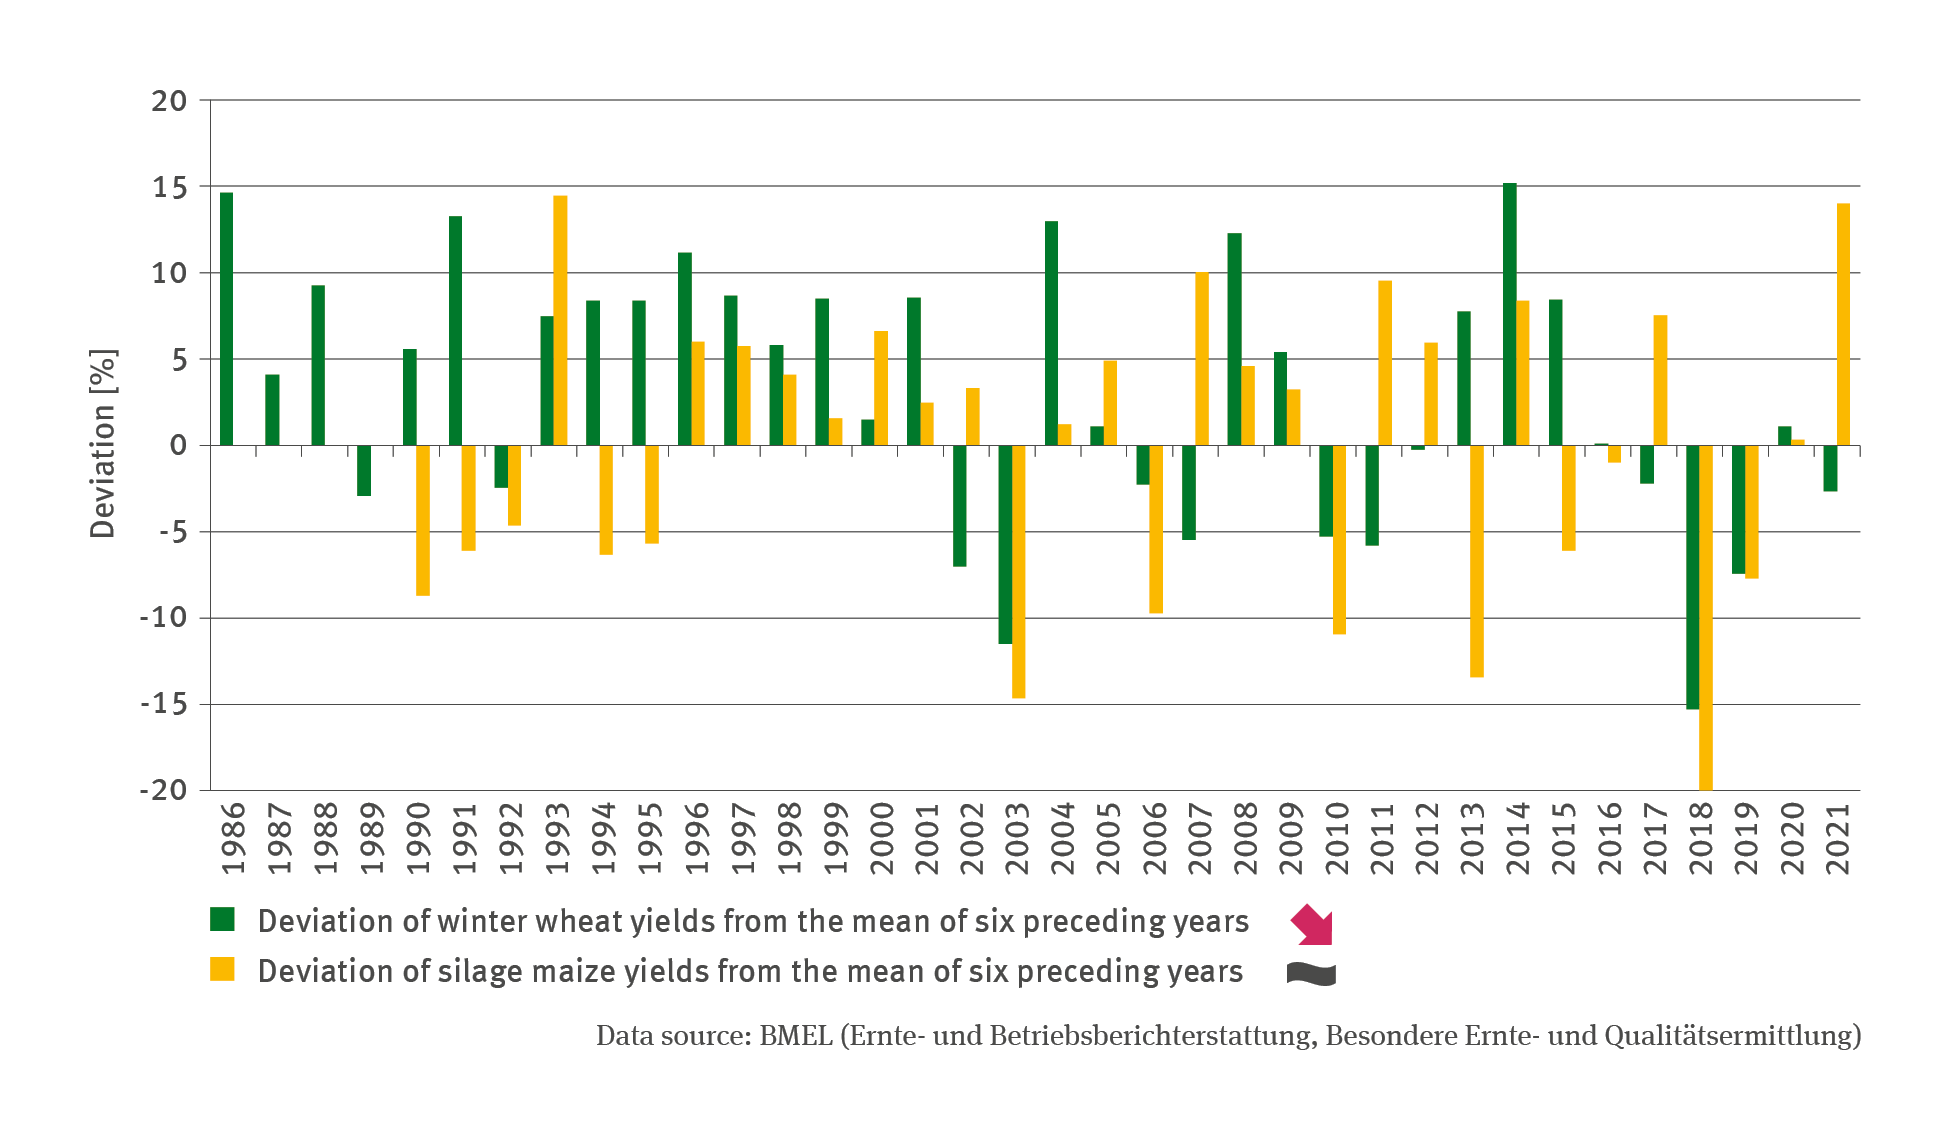
Source: BMEL (harvest and farm reporting: special harvest and quality assessment)
Download image (76.49 kB)

The following contents contain this medium:

Tags

Short link: www.uba.de/m42799en