Document from
Search
289 - 300 of 563
-
-
Project of the Consulting Assistance Program from 21.10.2016
Model concept for a decentralised wastewater management for Croatian islands
… EnviaTec GmbH, Rudower Chaussee 29, 12489 Berlin Deutschland Runtime 23.02.2004 to 27.08.2004 The aim of the project was the complete planning of a wastewater management … -
Image from | last change:
Figure 13: Spectrum of the change signal in extant climate projections for the annual precipitation
 … and 2071 to 2100 in relation to the multi-annual mean of the years from 1971 to 2000 in per cent. In this context, consideration is given to the climate protection … annual precipitation total – compared to the mean value of the period from 1971 to 2000 – ranges from –0.5 to 7 per cent in the period of 2031 to 2060, and from –2.5 … annual precipitation total – compared to the mean value for the period of 1971 to 2000 – ranges from -1 to just under 10 per cent in the period of 2031 to 2060 and …
 -
Press release 4/2017 from 31.01.2017 | Last changed: 27.03.2017
Air quality 2016: Nitrogen dioxide still the top pollutant
 … made in particulate pollution: 2016 is the year with the lowest levels since 2000. Ozone concentrations were also rather low compared to the last 20 years. … the year with the lowest measured levels of particulate matter pollution since 2000. The only case of exceedance of the EU limit value (PM10 daily mean value over … made in particulate pollution: 2016 is the year with the lowest levels since 2000. Ozone concentrations were also rather low compared to the last 20 years. …
 -
DzU article from 04.11.2025 | Last changed: 05.11.2025
Indicator: Landscape dissection
 … The level of fragmentation in 2005 has been chosen as the target (25.4 %). In 2000 this figure was at 26,5 %. However, the basis for calculation (traffic density counts) was incomplete in 2000 and 2005. Models were therefore used to calculate traffic loads across the … The level of fragmentation in 2005 has been chosen as the target (25.4 %). In 2000 this figure was at 26,5 %. However, the basis for calculation (traffic density …
 -
DzU article from 04.06.2025 | Last changed: 08.08.2025
Indicator: Sustainable forestry
 … Indicators last update on 04.06.2025 At a glance After a sharp rise between 2000 and 2003, the proportion of PEFC certified areas has stagnated until 2019. In … Overall, the proportion of areas certified under FSC has developed very well since 2000, with a dip in 2024. In 2024, 79.3 % of forests were managed under PEFC but … forestry indicator sustainable forestry PEFC-Siegel … After a sharp rise between 2000 and 2003, the proportion of PEFC certified areas has stagnated until 2019. In …
 -
Press release 43/2019 from 18.11.2019 | Last changed: 27.11.2019
Consumption of packaging in Germany increased further in 2017
 … supervised by UBA. Associated content Entwicklung des Verpackungsverbrauchs seit 2000 Source: Umweltbundesamt Download image (128.41 kB) Verpackungsverbrauch 2000 bis 2017 (10.75 kB) Entwicklung des gesamten Verpackungsverbrauchs in Deutschland seit 2000 Source: Umweltbundesamt Download image (175.03 kB) 18,7 Mio. t …
 -
KomPass: Article from 28.11.2023 | Last changed: 18.11.2025
KM-R-1: Investments in coastal protection
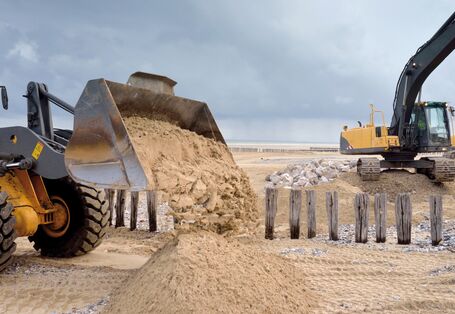 … by Federal government for the purpose of coastal protection decreased between 2000 and 2006. From 2012 onwards the investment increased again to more than 200 … and landscape maintenance necessitated by coastal protection measures. Between 2000 and 2006 the investments in coastal protection decreased by about half. … is due to the fluctuating development of investments in coastal protection since 2000. However, it has to be borne in mind that coastal protection measures can …
 -
Project of the Consulting Assistance Program from 27.04.2015
Workshop on rational energy use and use of renewable energy sources
… Czurda und Partner, Karlsruhe Deutschland Runtime 01.12.2003 to 29.02.2004 Documents Project information (German) (181.44 kB) … Workshop on rational … -
Image from | last change:
WW-I-2a: Groundwater level and spring flow – Northern Region
 … months in which the highest mean groundwater level was exceeded in the period 1971-2000 and the highest mean spring flow, as well as the number of months in which the … lowest mean groundwater level and/or the lowest mean spring flow in the period 1971–2000 were not attained. The indicator refers to the Northern Region which comprises … months in which the highest mean groundwater level was exceeded in the period 1971-2000 and the highest mean spring flow, as well as the number of months in which the …
 -
Project of the Consulting Assistance Program from 28.04.2015
Support for the Slovak nature conservation authority in implementing the FFH Directive
… Conservancy of the Slovak Republic, Banska Bystrica Deutschland Runtime 15.11.2004 to 30.09.2005 Documents Projektinformation (German) (134.86 kB) … Support for … -
Project of the Consulting Assistance Program from 28.04.2015
Further development of the Russian greenhouse gas emissions monitoring system in Krasnodar
… Gesellschaft für Anlagen- und Reaktorsicherheit mbH, Köln Deutschland Runtime 01.06.2004 to 30.09.2006 Documents Projektinformation (German) (204.11 kB) … Further …


