Skip to main content Skip to main menu Skip to footer

Abbildung 3 - Dürrewahrscheinlichkeit

Grafik zeigt das Dürrerisiko in Abhängigkeit des globalen Temperaturanstieges

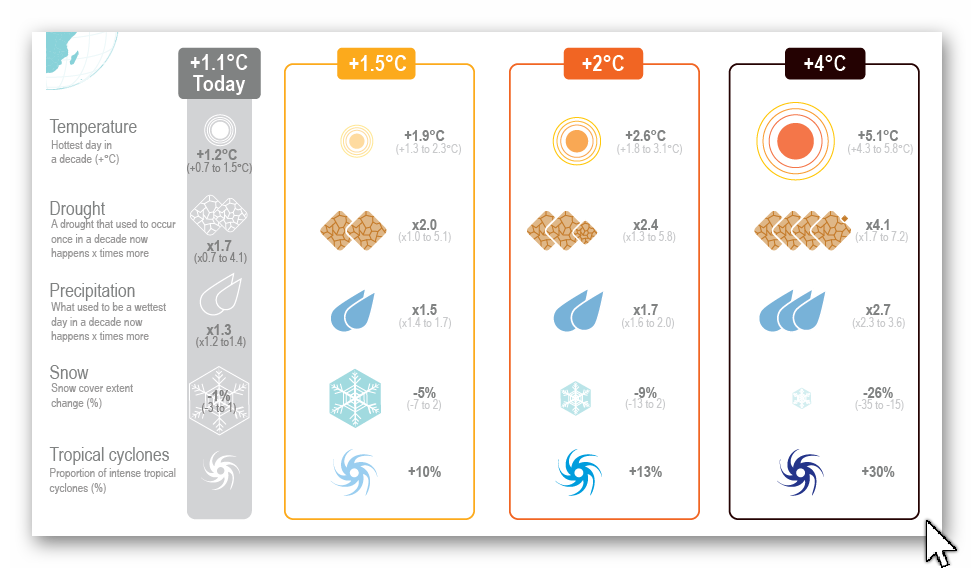
Dürrerisiko in Abhängigkeit des globalen Temperaturanstieges

Source: IPCC 2022
Download image (107.25 kB)

The following contents contain this medium:

Tags

Short link: www.uba.de/m99060en