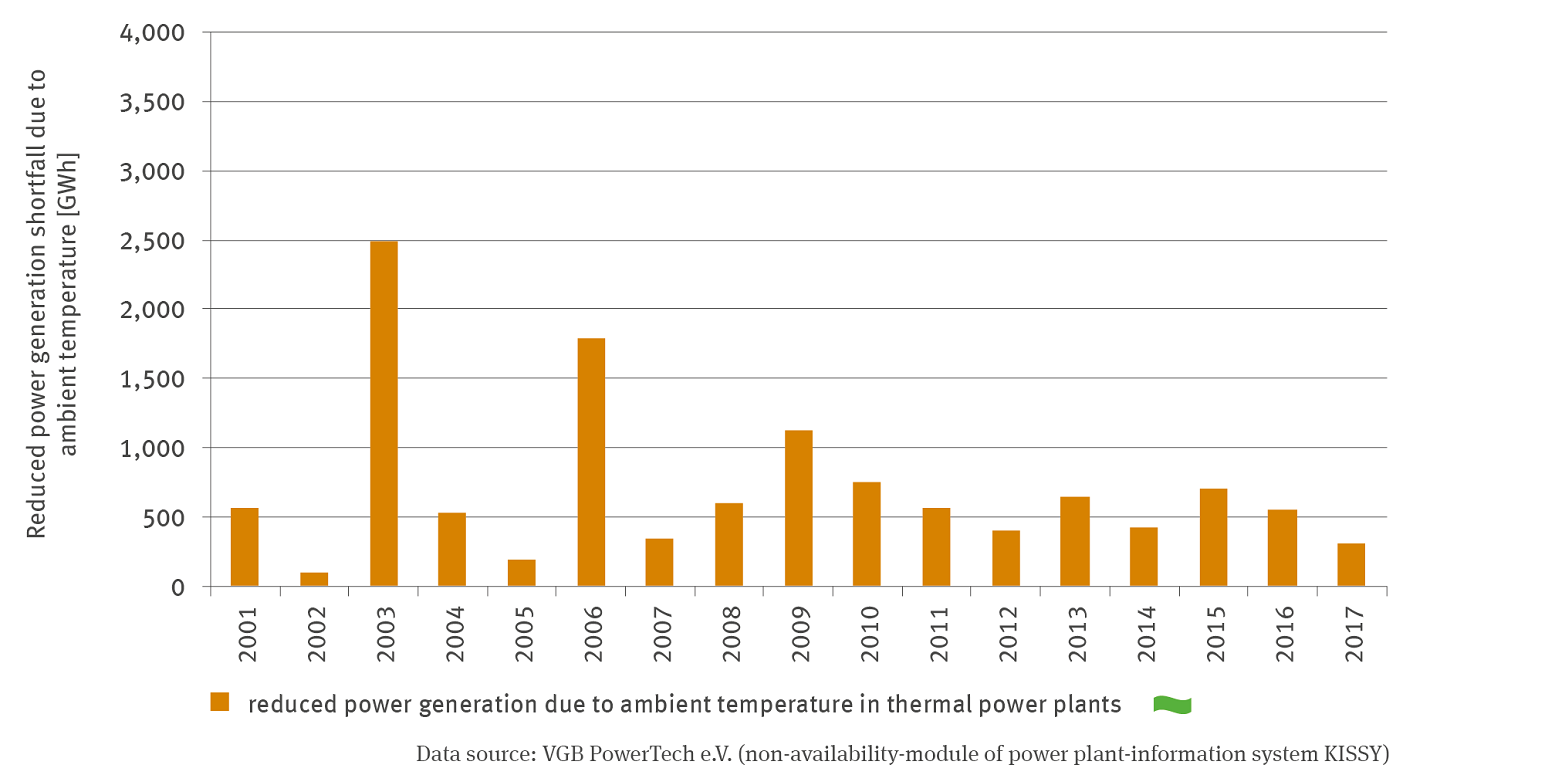
A bar chart shows the ambient temperature-related electricity production of thermal power plants in gigawatt hours in a time series from 2001 to 2017. The values fluctuate between less than 100 gigawatt hours for 2002 and 2,500 gigawatt hours for 2003. From 2007 onwards, the values become comparable and range between 300 and 1,000 gigawatt hours. There is no trend so far.
Source: VGB PowerTech e.V. (non-availability-module of power plant-information system KISSY)
Download image (107.97 kB)