Skip to main content Skip to main menu Skip to footer

Data Search

Data Search

Here you will find diagrams, infographics, maps and tables for direct download.

Data Search

The bar chart WW-I-5 ‘Peak discharge values in watercourses’ contains a biaxial diagram. The bar chart shows for the years 1961 to 2021 – separately for the hydrological winter half-year (1st November of the previous year to 30th April) and the hydrological summer half-year (1st May to 31st October) – on one hand the highest peak discharge at selected watercourse gauges as a multiple of MHQ.

WW-I-5: Peak discharge values in watercourses

  • Klima
  • Wasser
  • Diagramme
Export data
PNG
The bar chart WW-I-4 ’Floodwater’ shows – for the years of 1961 to 2021 – the number of floodwater days in the hydrological winter half-year (1st November of the previous year to 30th April) and in the hydrological summer half-year (1st May to 31st October) respectively, prevailing in the river basins of the Danube, Elbe, Rhine, Eider and Weser. The structure of the indicator is characterised by individual flood events which typically influence several river basins.

WW-I-4: Floodwater

  • Klima
  • Wasser
  • Diagramme
Export data
PNG
A graph shows the proportions of processed and recycled municipal waste in the total quantity of municipal waste from 2002 to 2023. During this period the proportion of recycled municipal waste rose from 56.1 to 67.2 percent.

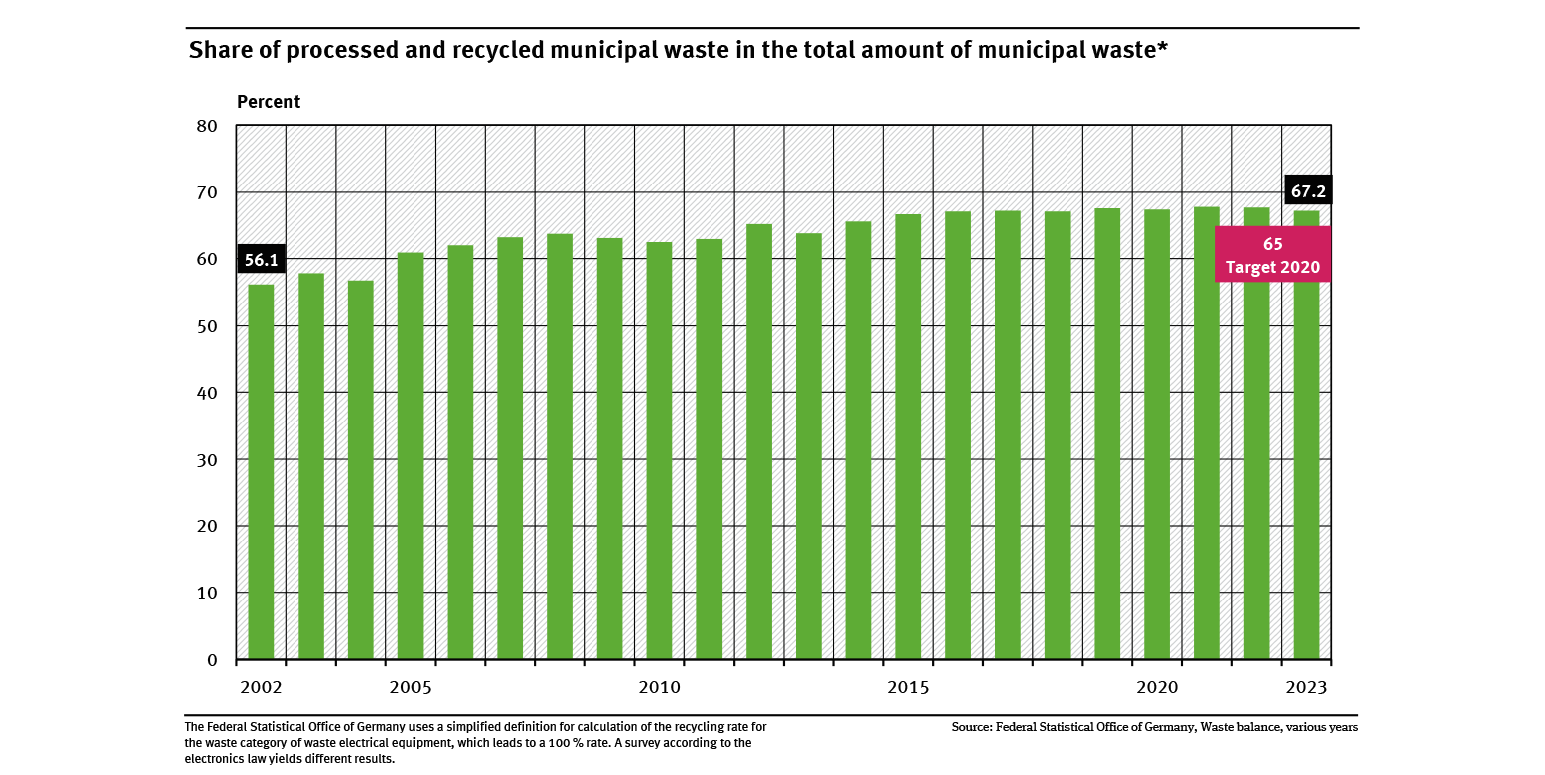
Share of processed and recycled municipal waste in the total amount of municipal waste

  • Ressourcen und Abfall
  • Diagramme
  • Umwelt-Indikatoren
  • Daten und Tabellen
Export data
The bar chart WW-I-6 ‘Low water* shows – for the years of 1961 to 2021 – the number of low-water days in the water-balance related winter half-year (1st October of the previous year to 31st March) and in the water-balance related summer half-year (1st April to 30th September) respectively, prevailing in Germany’s river basins. The structure of the indicator is characterised by individual pronounced low-water events which occurred latterly in the period from 2018 to 2020.

WW-I-6: Low water

  • Klima
  • Wasser
  • Diagramme
Export data
PNG
The bar chart WW-I-3 ’Mean discharge’ shows the mean runoff depth for all river basins in Germany in the hydrological winter half-year (1st November of the previous year till 30th April) and in the hydrological summer half-year (1st May till 31st October) in the years of 1961 to 2021 in millimetres. The runoff depth in the hydrological summer half-year of 2021 decreased significantly during the period of observation, in the amount of slightly more than 100 millimetres.

WW-I-3: Mean discharge

  • Klima
  • Wasser
  • Diagramme
Export data
PNG
The chart consists of two illustrations – one showing the number of days with soil humidity of less than 30 per cent usable field capacity (nFK) for winter wheat on sandy clay while the other shows – for the same number of days – the comparable value for winter wheat on clay-rich sand, each for the period of 1961 to 2022. The multi-annual mean for the period of 1991 to 2020 for sandy clay amounts to 5.3 days. The linear trend for Germany regarding the period examined amounts to an increase by 8.6 days.
Export data
JPG
The bar chart shows the annual change in tree species composition in natural forest reserves including the major climate change increase in percent expected for the periods 1971 to 2014, 2014 to 2018 and 2019 to 2023.

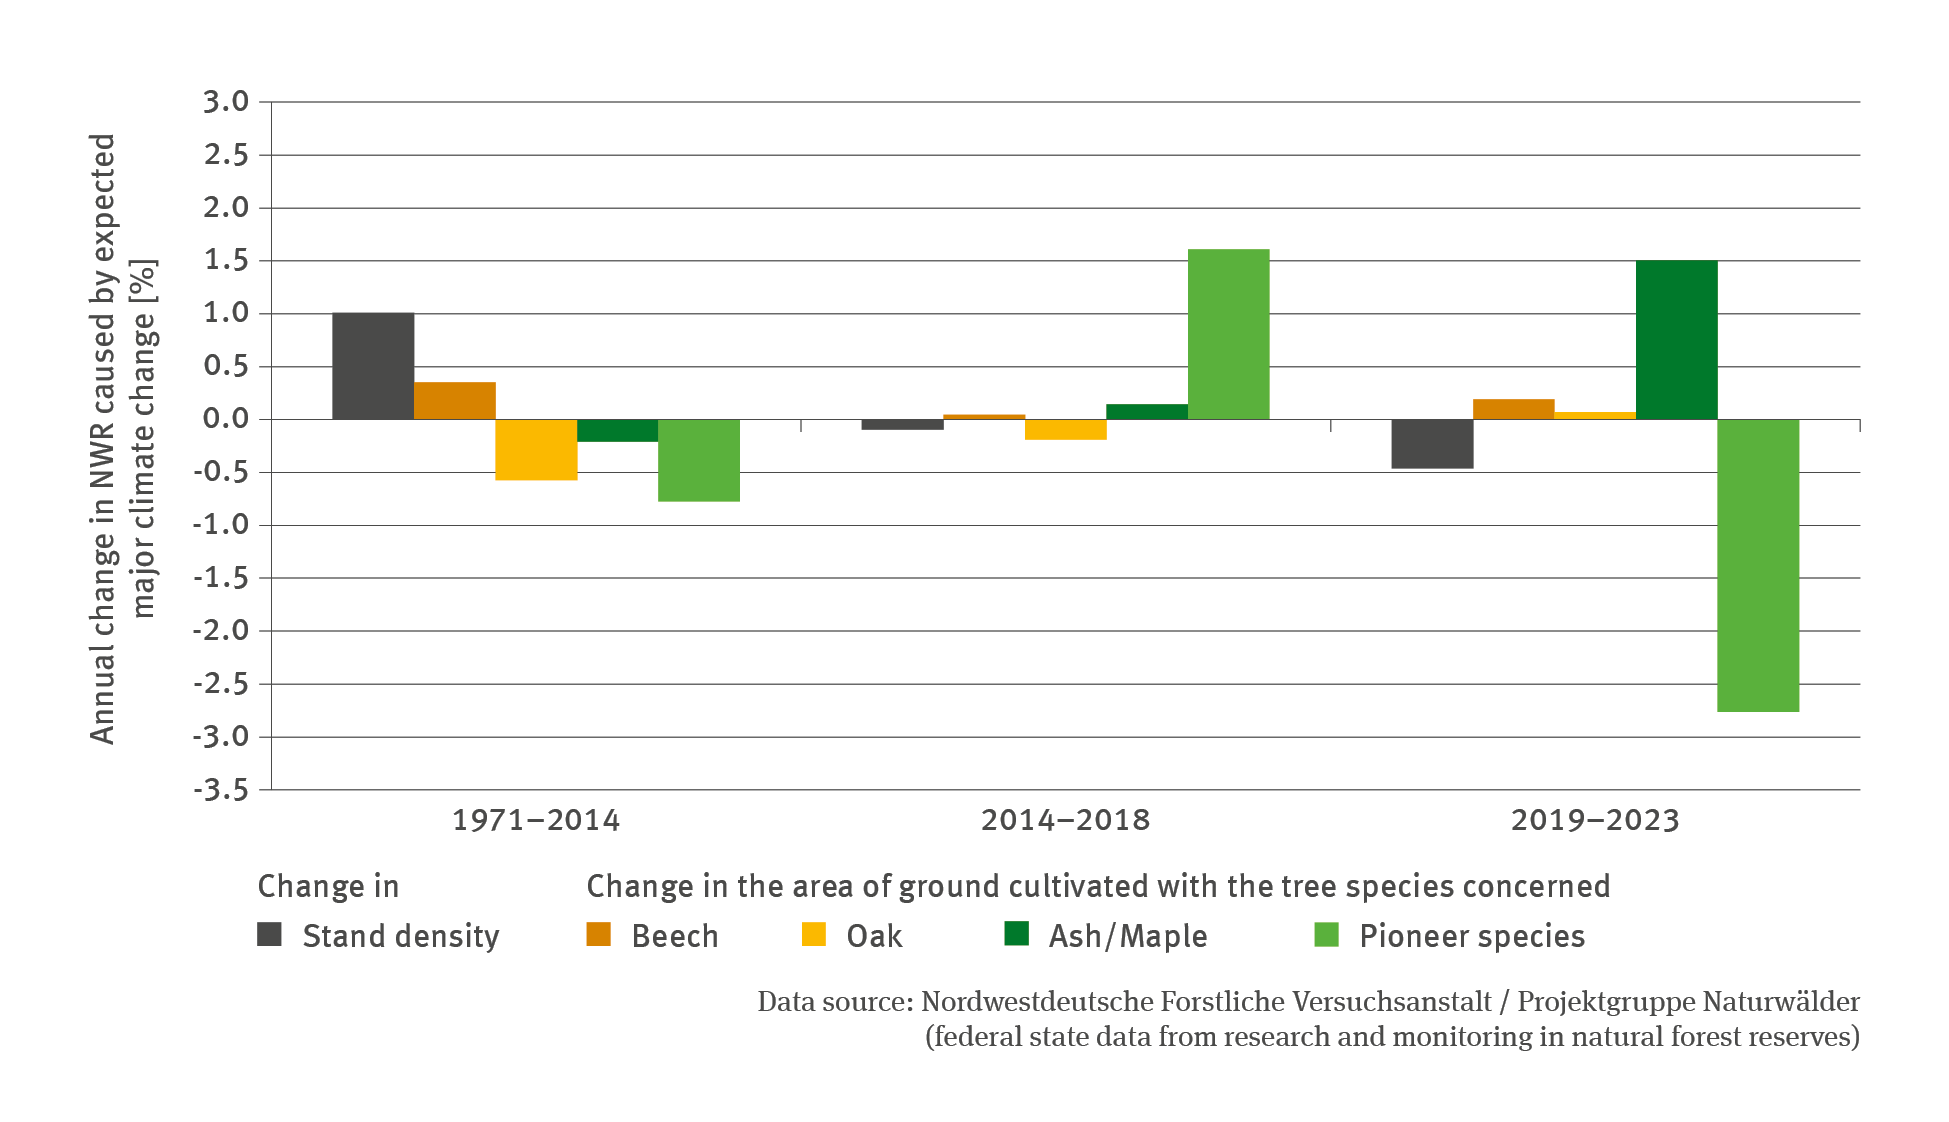
FW-I-1: Tree species composition in forest nature reserves – case study

  • Klima
  • Land- und Forstwirtschaft
  • Diagramme
Export data
PNG
A graph shows the final energy consumption in freight and passenger transport between 2005 and 2023 and the targets for the year 2030 of the Federal Government (2005 = 100) presented as an index.

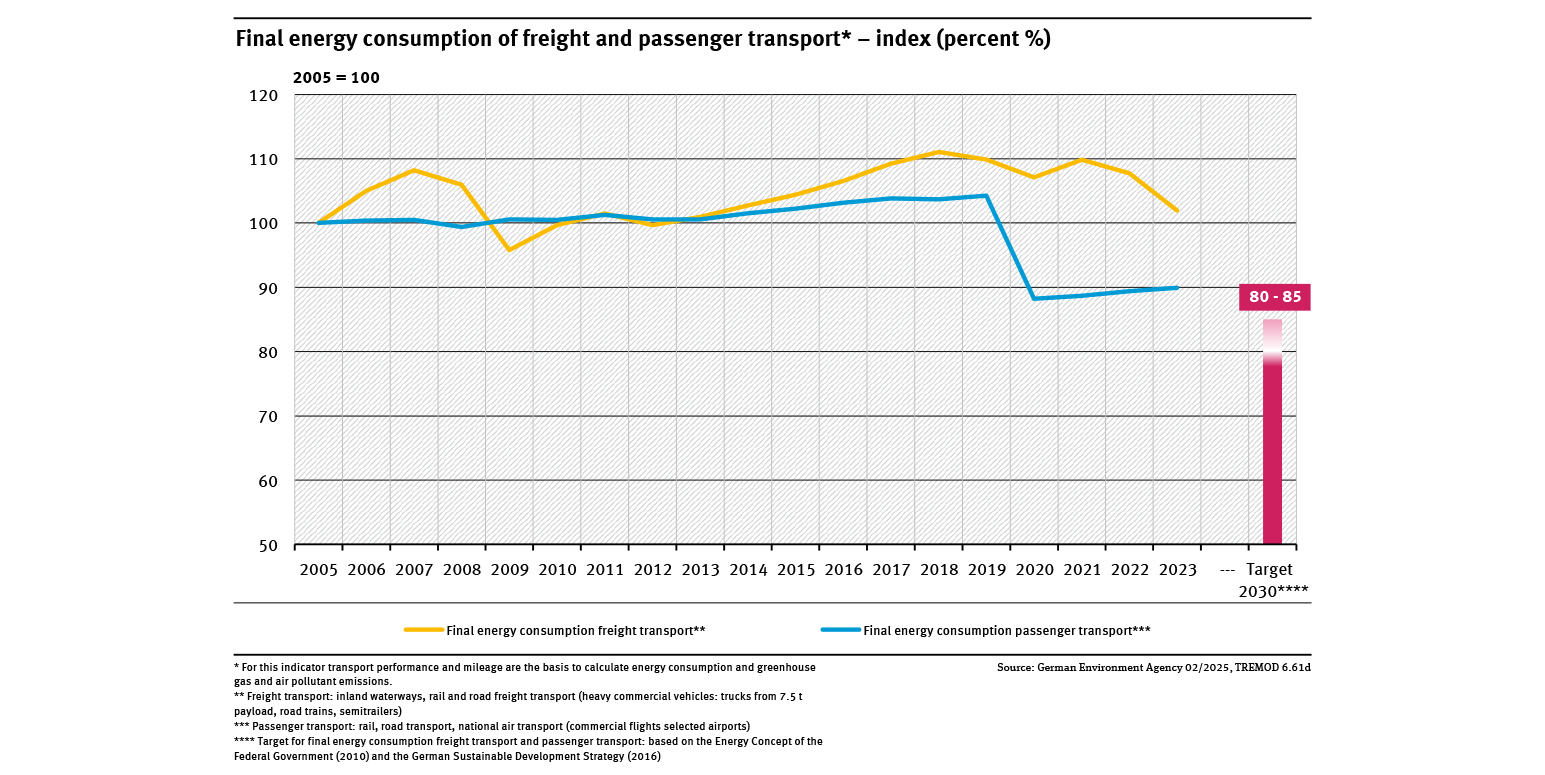
Final energy consumption of freight and passenger transport

  • Energie
  • Verkehr
  • Diagramme
  • Umwelt-Indikatoren
  • Daten und Tabellen
Export data
The chart consists of two illustrations – one showing the number of days with soil humidity of less than 30 per cent usable field capacity (nFK) for winter wheat on sandy clay while the other shows – for the same number of days – the comparable value for winter wheat on clay-rich sand, each for the period of 1961 to 2022. The multi-annual mean for the period of 1991 to 2020 for sandy clay amounts to 5.3 days. The linear trend for Germany regarding the period examined amounts to an increase by 8.6 days.
Export data
JPG
A graph shows the development of the population of representative bird species for different landscapes and the development of an aggregate indicator for 1970, 1975 and from 1990 to 2023 in percent. The aggregate indicator decreases significantly from 214 in 1970 to 80 in 2013.

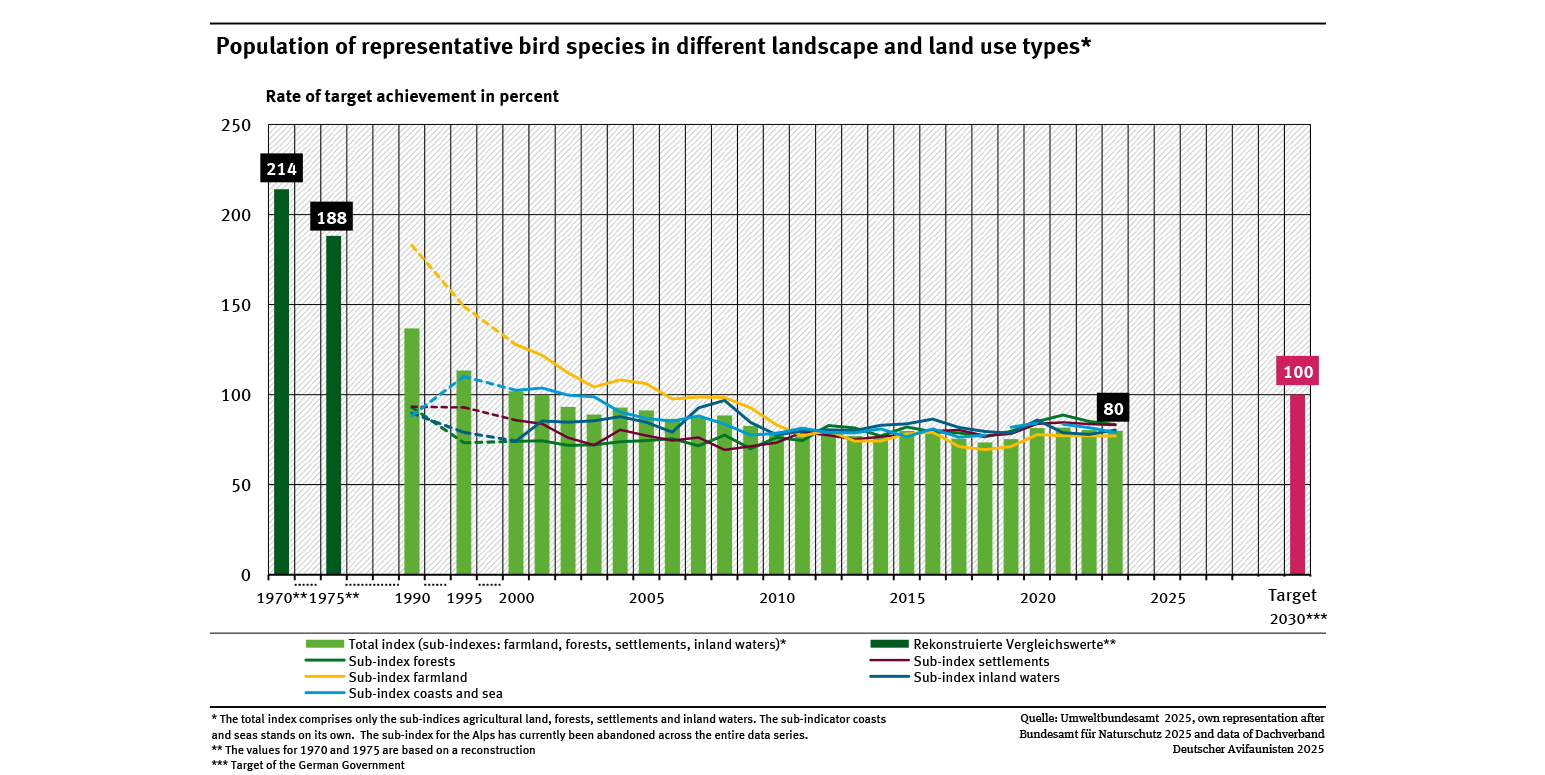
Population of representative bird species in different landscape and land use types

  • Fläche, Boden, Land-Ökosysteme
  • Diagramme
  • Umwelt-Indikatoren
  • Daten und Tabellen
Export data

You can also search in other data portals of the German Environment Agency

Short link: https://www.uba.de/n300701en