Data Search

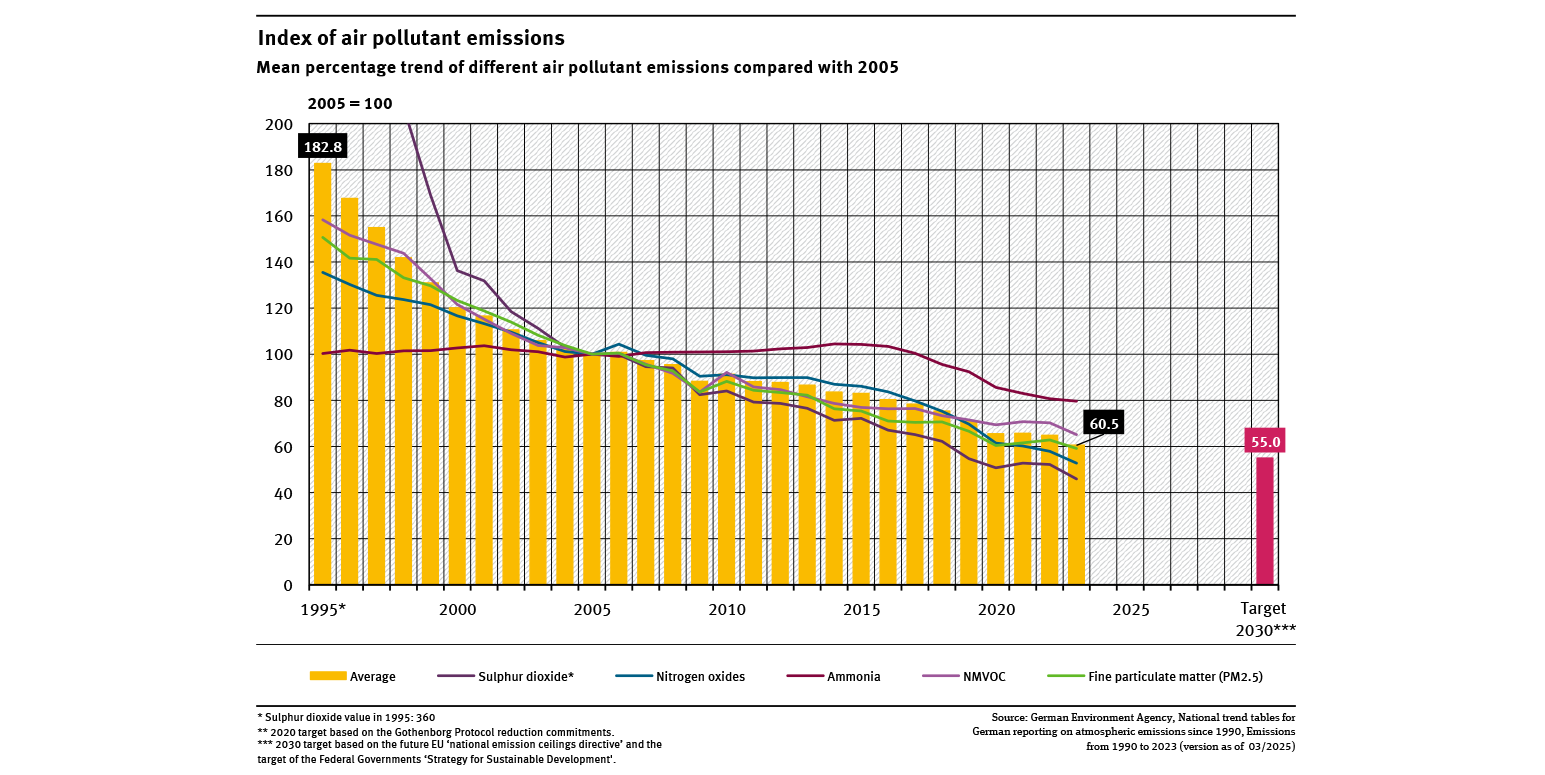
Index of air pollutant emissions
- Luft
- Diagramme
- Umwelt-Indikatoren
- Daten und Tabellen

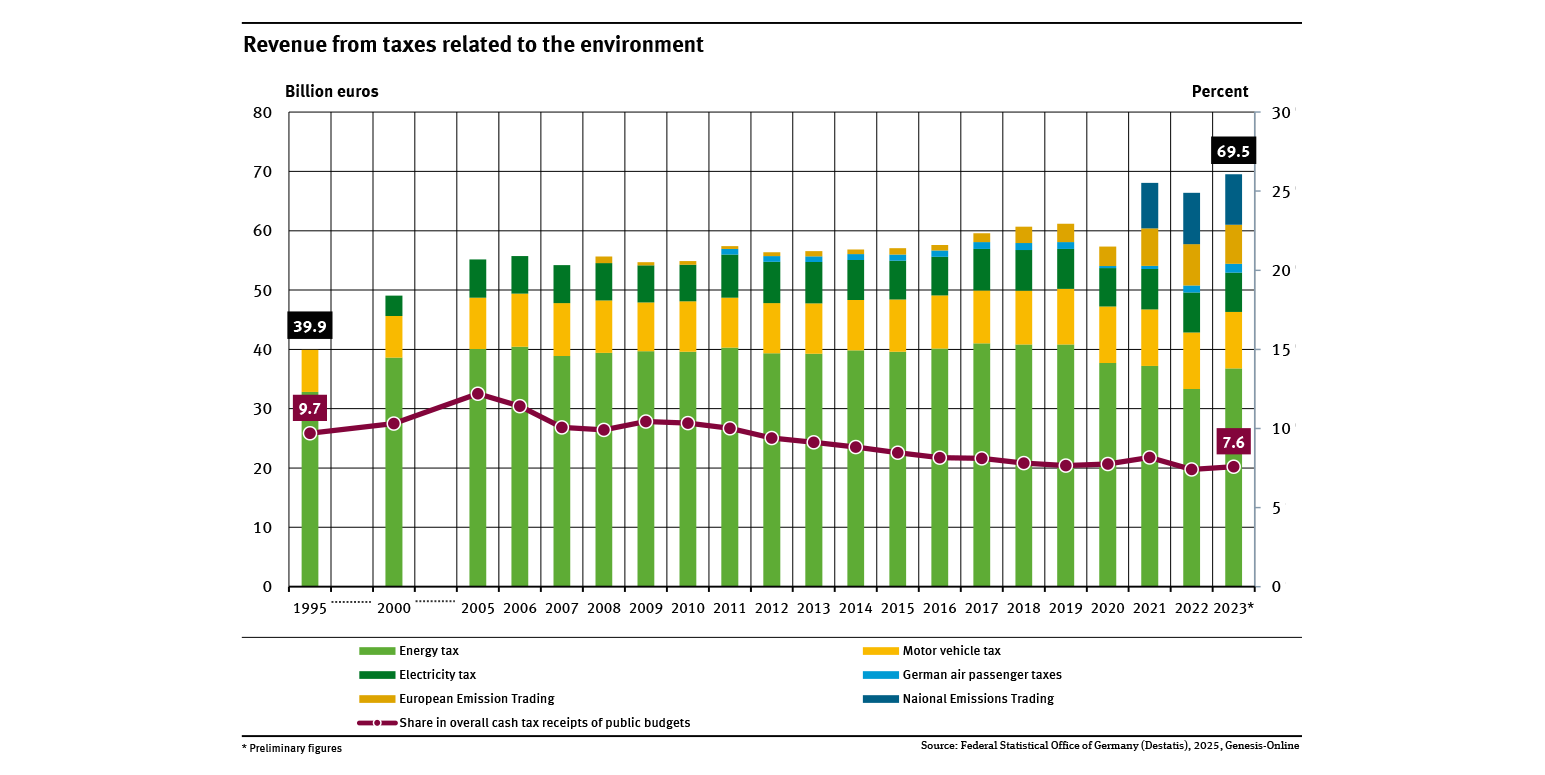
Revenue from taxes to the environment
- Umwelt und Wirtschaft
- Diagramme
- Umwelt-Indikatoren
- Daten und Tabellen

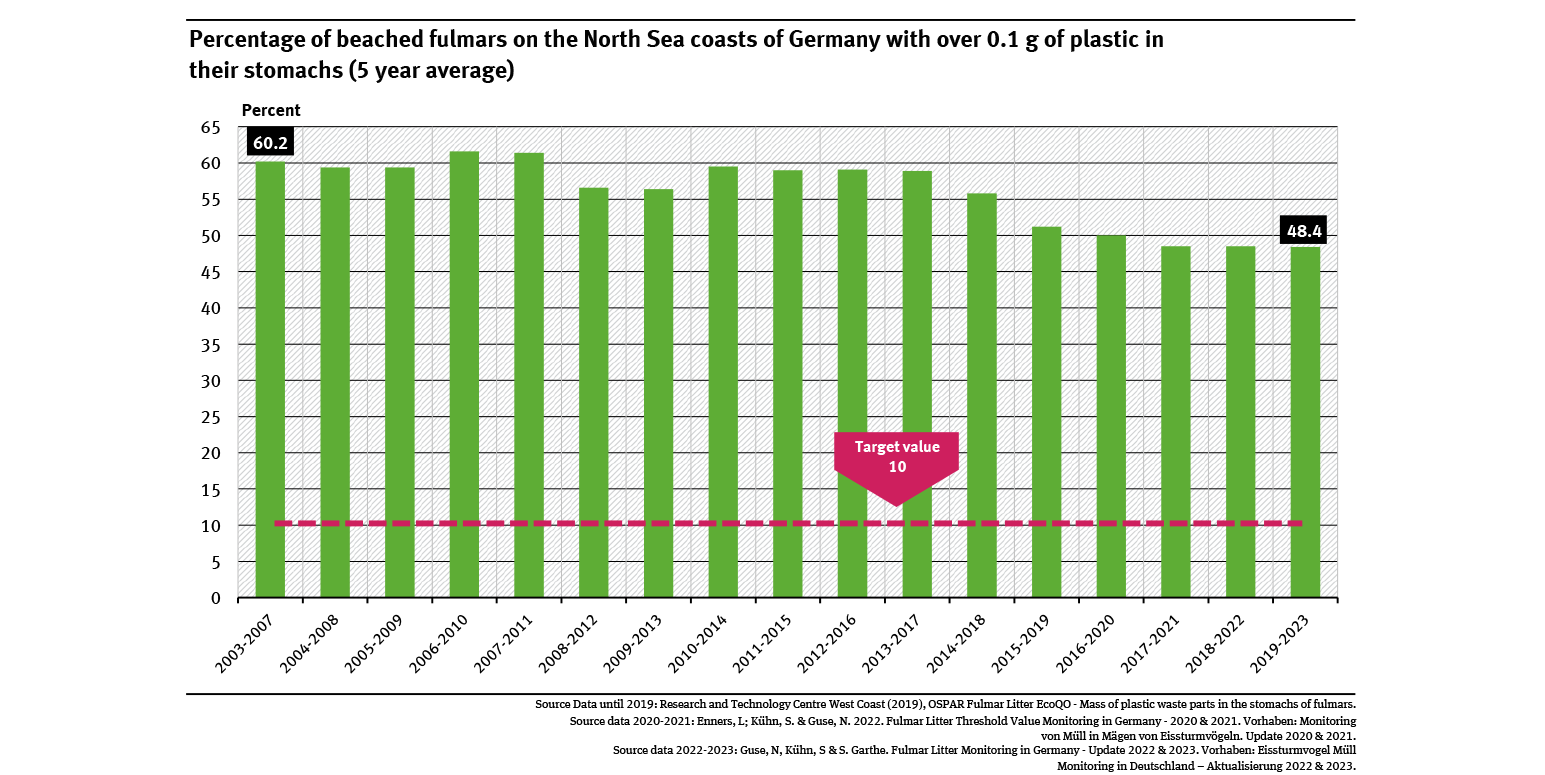
Percentage of beached fulmars on the North Sea coasts of Germany with over 0.1 g of plastic ...
- Wasser
- Diagramme
- Umwelt-Indikatoren
- Daten und Tabellen

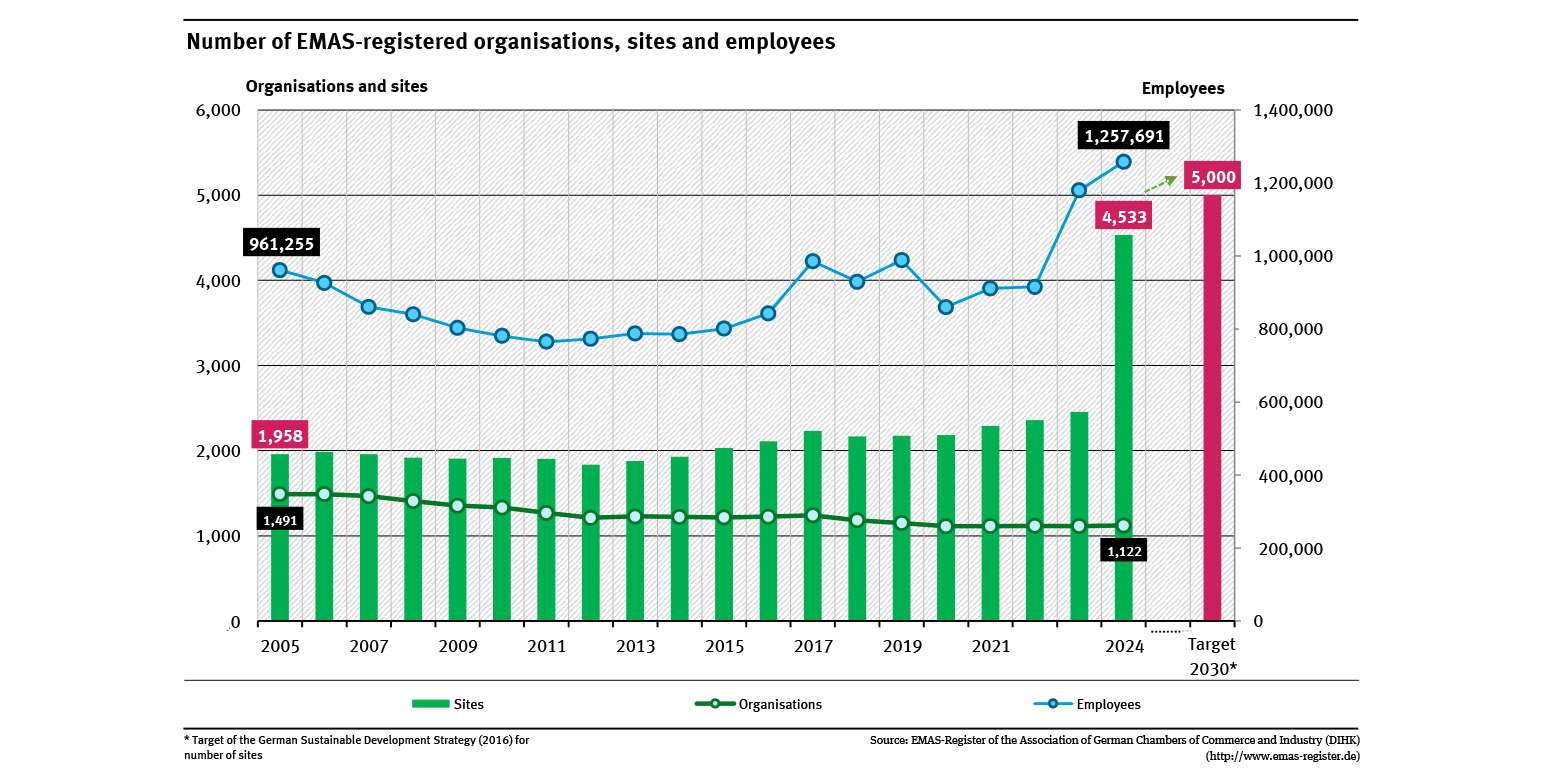
Number of EMAS-registered organisations, sites and employees
- Umwelt und Wirtschaft
- Diagramme
- Umwelt-Indikatoren
- Daten und Tabellen

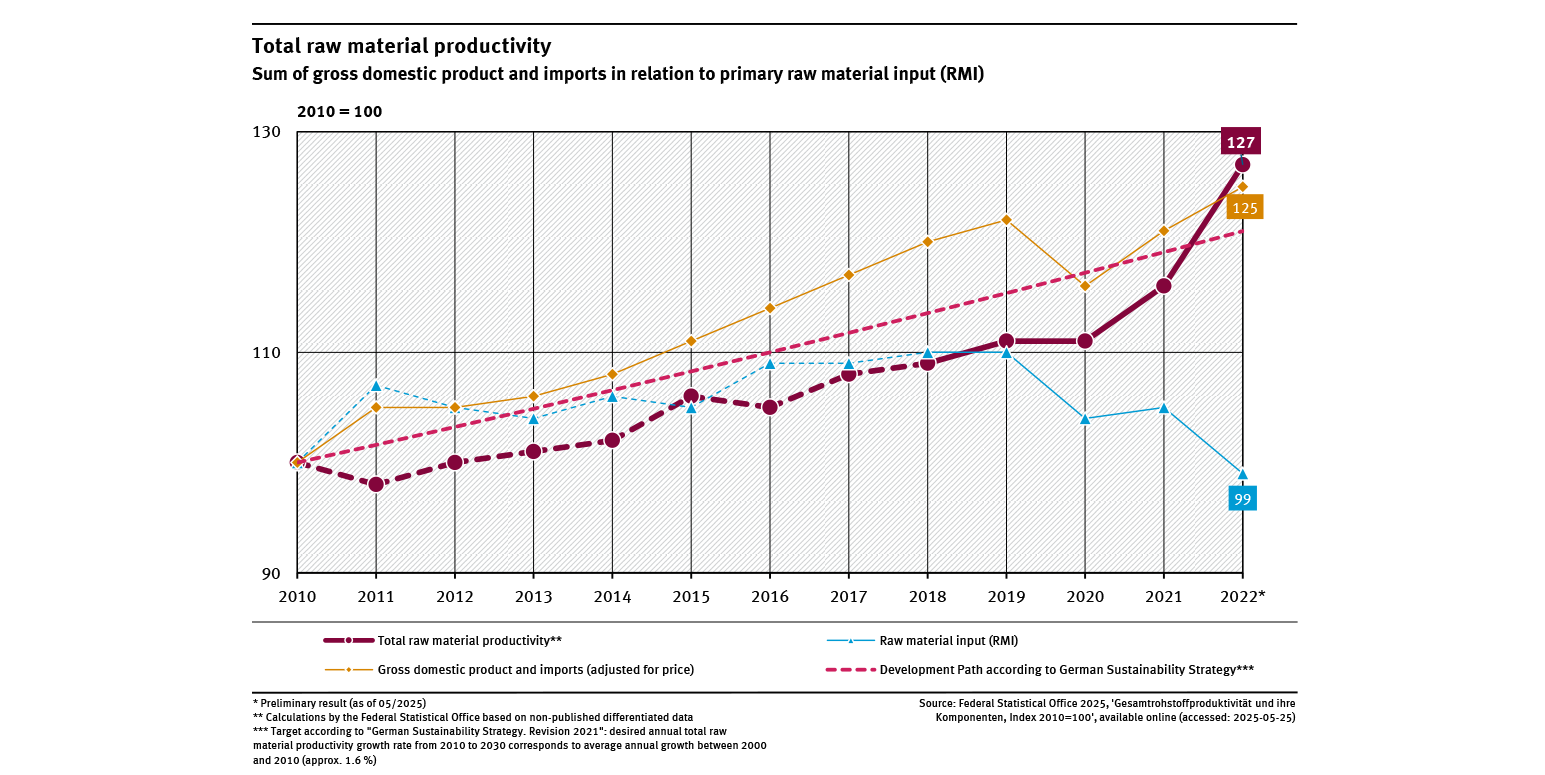
Total raw material productivity
- Ressourcen und Abfall
- Diagramme
- Umwelt-Indikatoren
- Daten und Tabellen

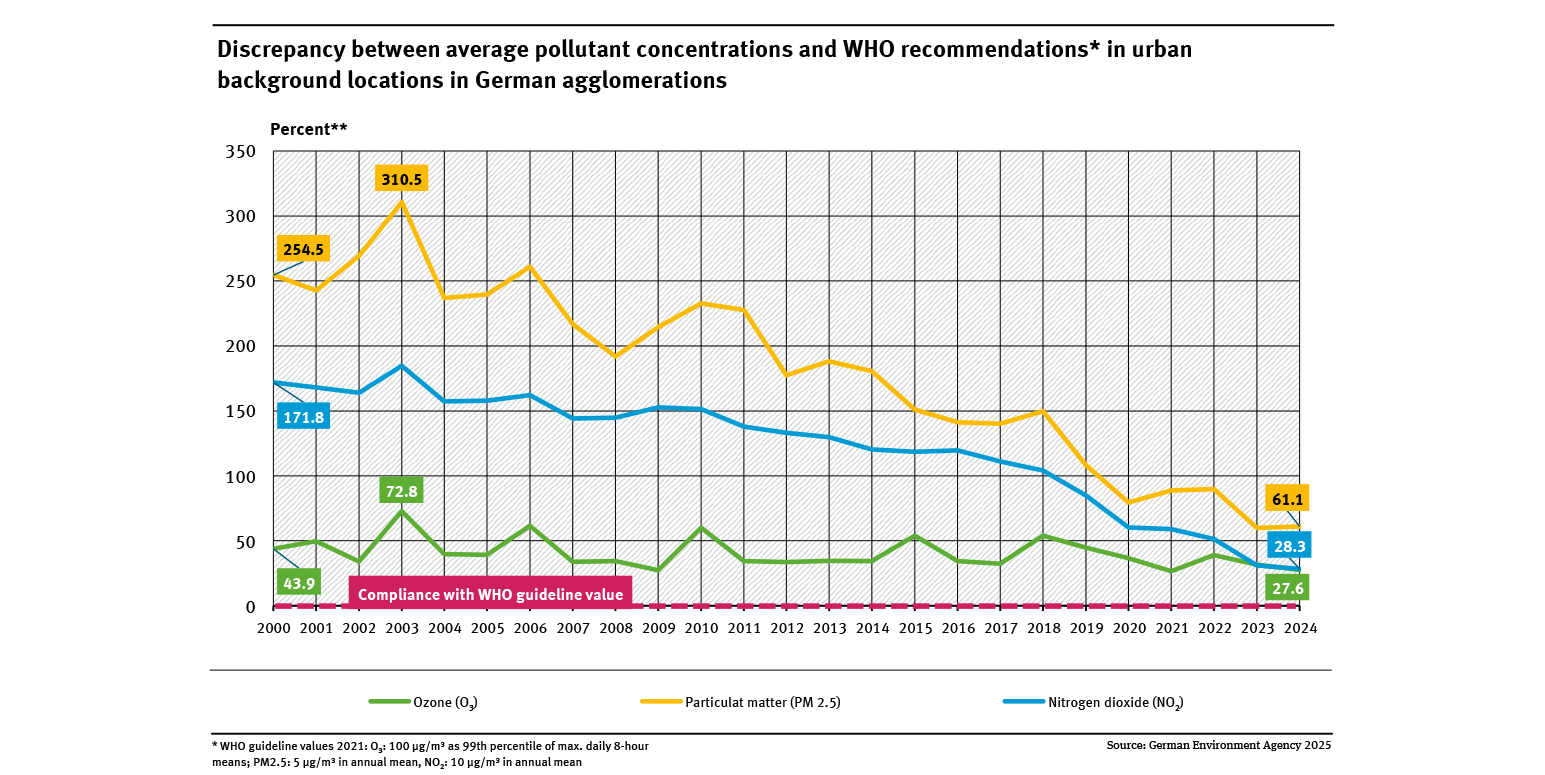
Discrepancy between average pollutant concentrations and WHO recommendations ...
- Luft
- Umwelt und Gesundheit
- Diagramme
- Umwelt-Indikatoren
- Daten und Tabellen

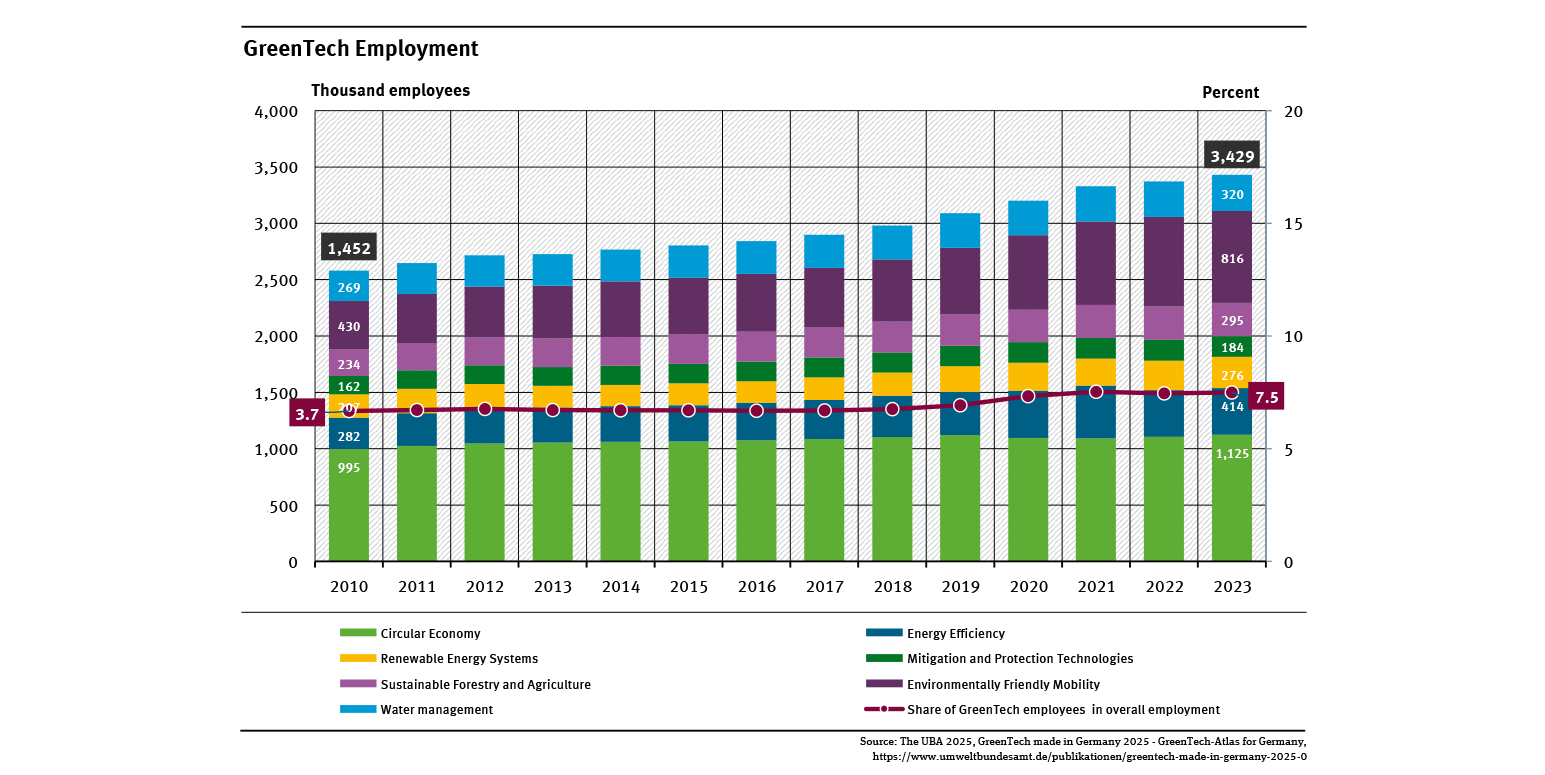
Employment in environmental protection
- Umwelt und Wirtschaft
- Diagramme
- Umwelt-Indikatoren
- Daten und Tabellen

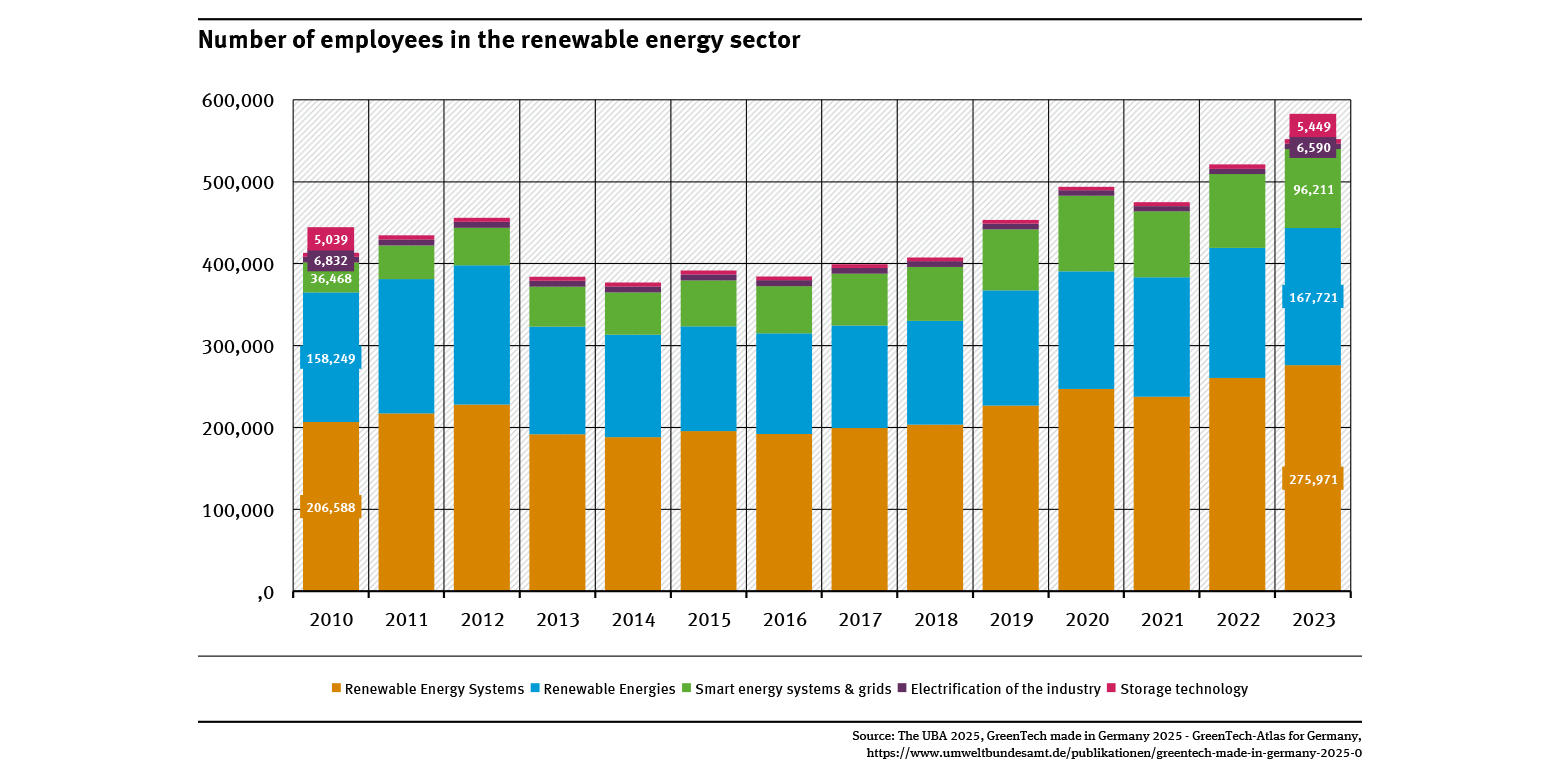
Number of employees in the renewable energy sector
- Umwelt und Wirtschaft
- Diagramme
- Umwelt-Indikatoren
- Daten und Tabellen

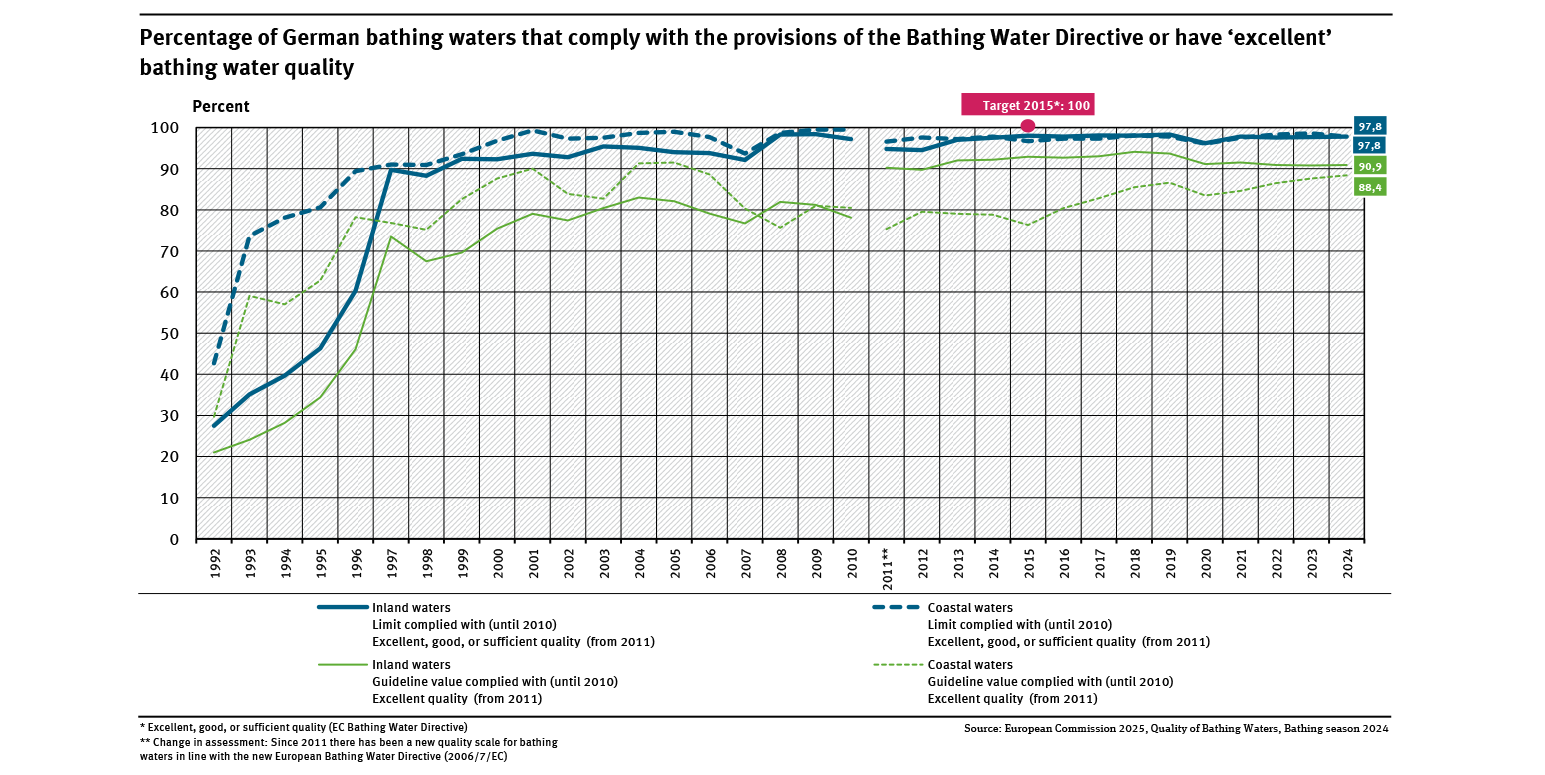
Percentage of German bathing waters that comply with the provisions of the Bathing Water Directive..
- Wasser
- Umwelt und Gesundheit
- Diagramme
- Umwelt-Indikatoren
- Daten und Tabellen

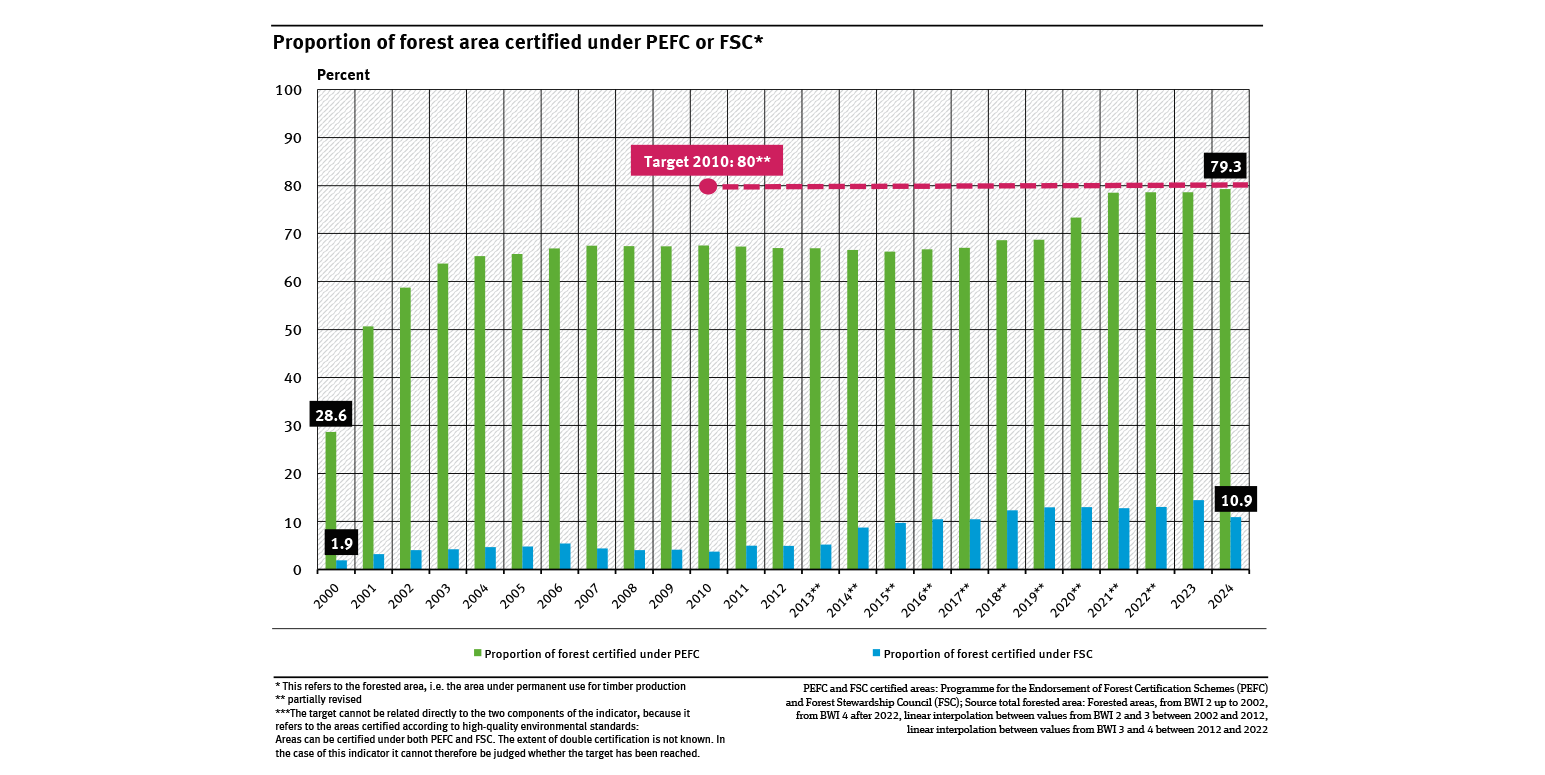
Proportion of forest area certified under PEFC or FSC
- Land- und Forstwirtschaft
- Diagramme
- Umwelt-Indikatoren
- Daten und Tabellen