Skip to main content Skip to main menu Skip to footer

Data Search

Data Search

Here you will find diagrams, infographics, maps and tables for direct download.

Data Search

The line chart illustrated in BAU-I-3 ‘Cooling degree days’ shows the mean of cooling degree days for 1951 to 2017 in summer climate regions according to DIN-4108-2:2013-2 in Kelvin per day. The illustration differentiates between the summer climate regions A, B and C. All three lines show a significantly rising trend over the years with distinct high points in 2003 and 2018, albeit with distinct fluctuations from year to year.

BAU-I-3: Cooling degree days

  • Klima
  • Umwelt und Gesundheit
  • Diagramme
Export data
PNG
The illustration BAU-I-1 ’Heat stress in urban areas – case study’ (Wärmebelastung in Städten – Fallstudie) shows three lines representing the number of hot days in the cities of Berlin, Frankfurt am Main and Munich during the period of 1986 until 2021. Apart from Munich, there are a few data gaps in these time series. In addition, a dotted line shows the areal mean for Germany as a whole. All lines show an increase, with fluctuations from year to year.

BAU-I-1: Heat stress in urban areas – case study

  • Klima
  • Umwelt und Gesundheit
  • Diagramme
Export data
PNG
The illustration BD-R-2 ’Restoration of natural flood plains’ contains a bar chart demonstrating the restoration of natural flood plains by means of dyke realignment in the period of 1983/2000 to 2020. For 2020 a cumulative areal gain of slightly more than 7,000 hectares is shown. The time series shows a significantly rising trend.

BD-R-2: Restoration of natural flood plains

  • Klima
  • Fläche, Boden, Land-Ökosysteme
  • Diagramme
Export data
PNG
The illustration BD-R-1 ’Consideration of climate change in landscape programmes and landscape framework plans’ contains a grouped bar chart which indicates the consideration of climate change in landscape programmes and landscape framework plans. The chart shows the percentage proportion of evaluated plans in which climate change is taken into account. The evaluation of landscape framework plans and landscape programmes took place at the end of each of the following years: 2000, 2005, 2010, 2015, 2020 and

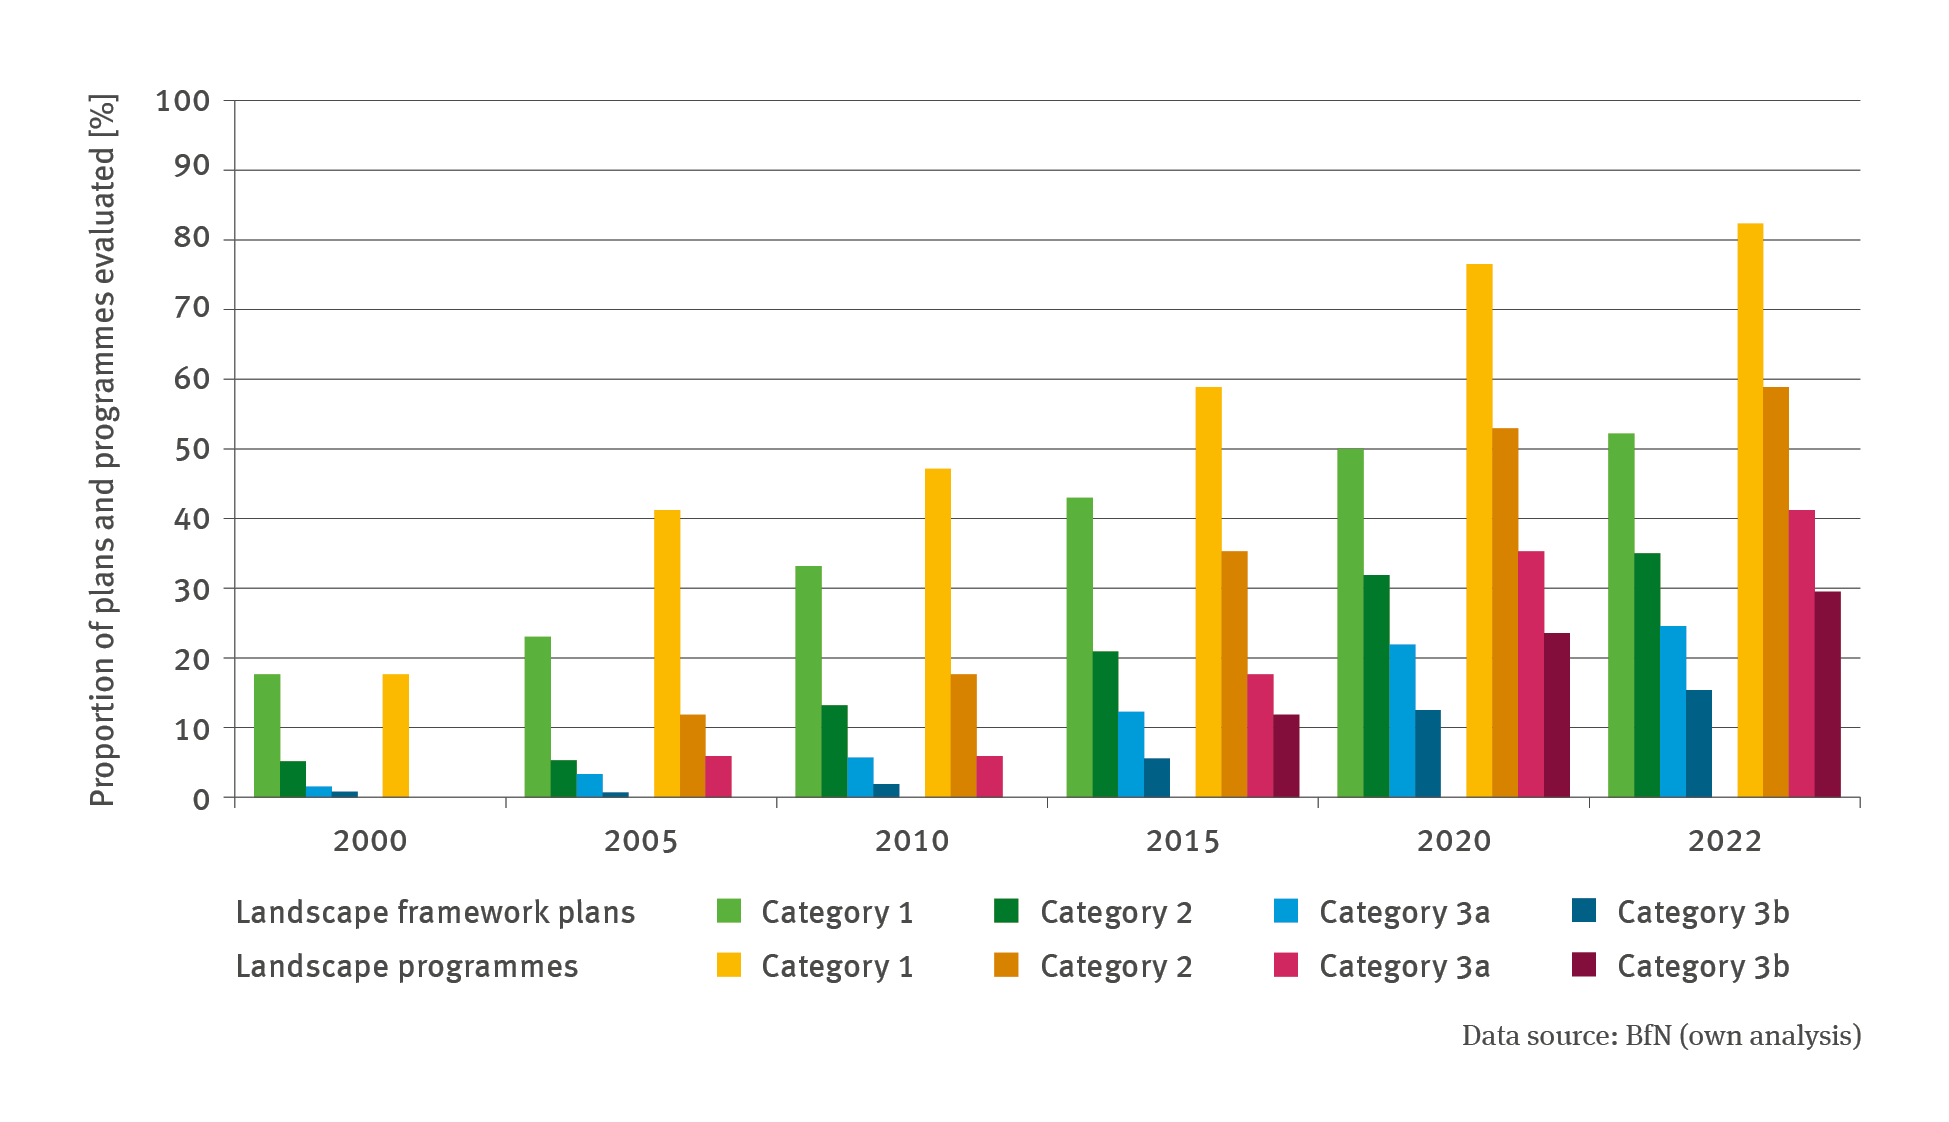
BD-R-1: Consideration of climate change in landscape programmes

  • Klima
  • Fläche, Boden, Land-Ökosysteme
  • Diagramme
Export data
PNG
The illustration BD-I-3 ’Temperature index of butterfly species communities’ contains a line chart indicating the temperature index of butterfly species communities in degrees Celsius. In the illustrated period of 2006 to 2021 the line rises significantly. While the index for 2006 amounted to approximately 8.9 degrees Celsius, in 2021 the value amounted to approximately 9.1 degrees Celsius. However, the increase did not proceed continuously. In 2010 and 2011, the index value dropped, and also in 2017, the v

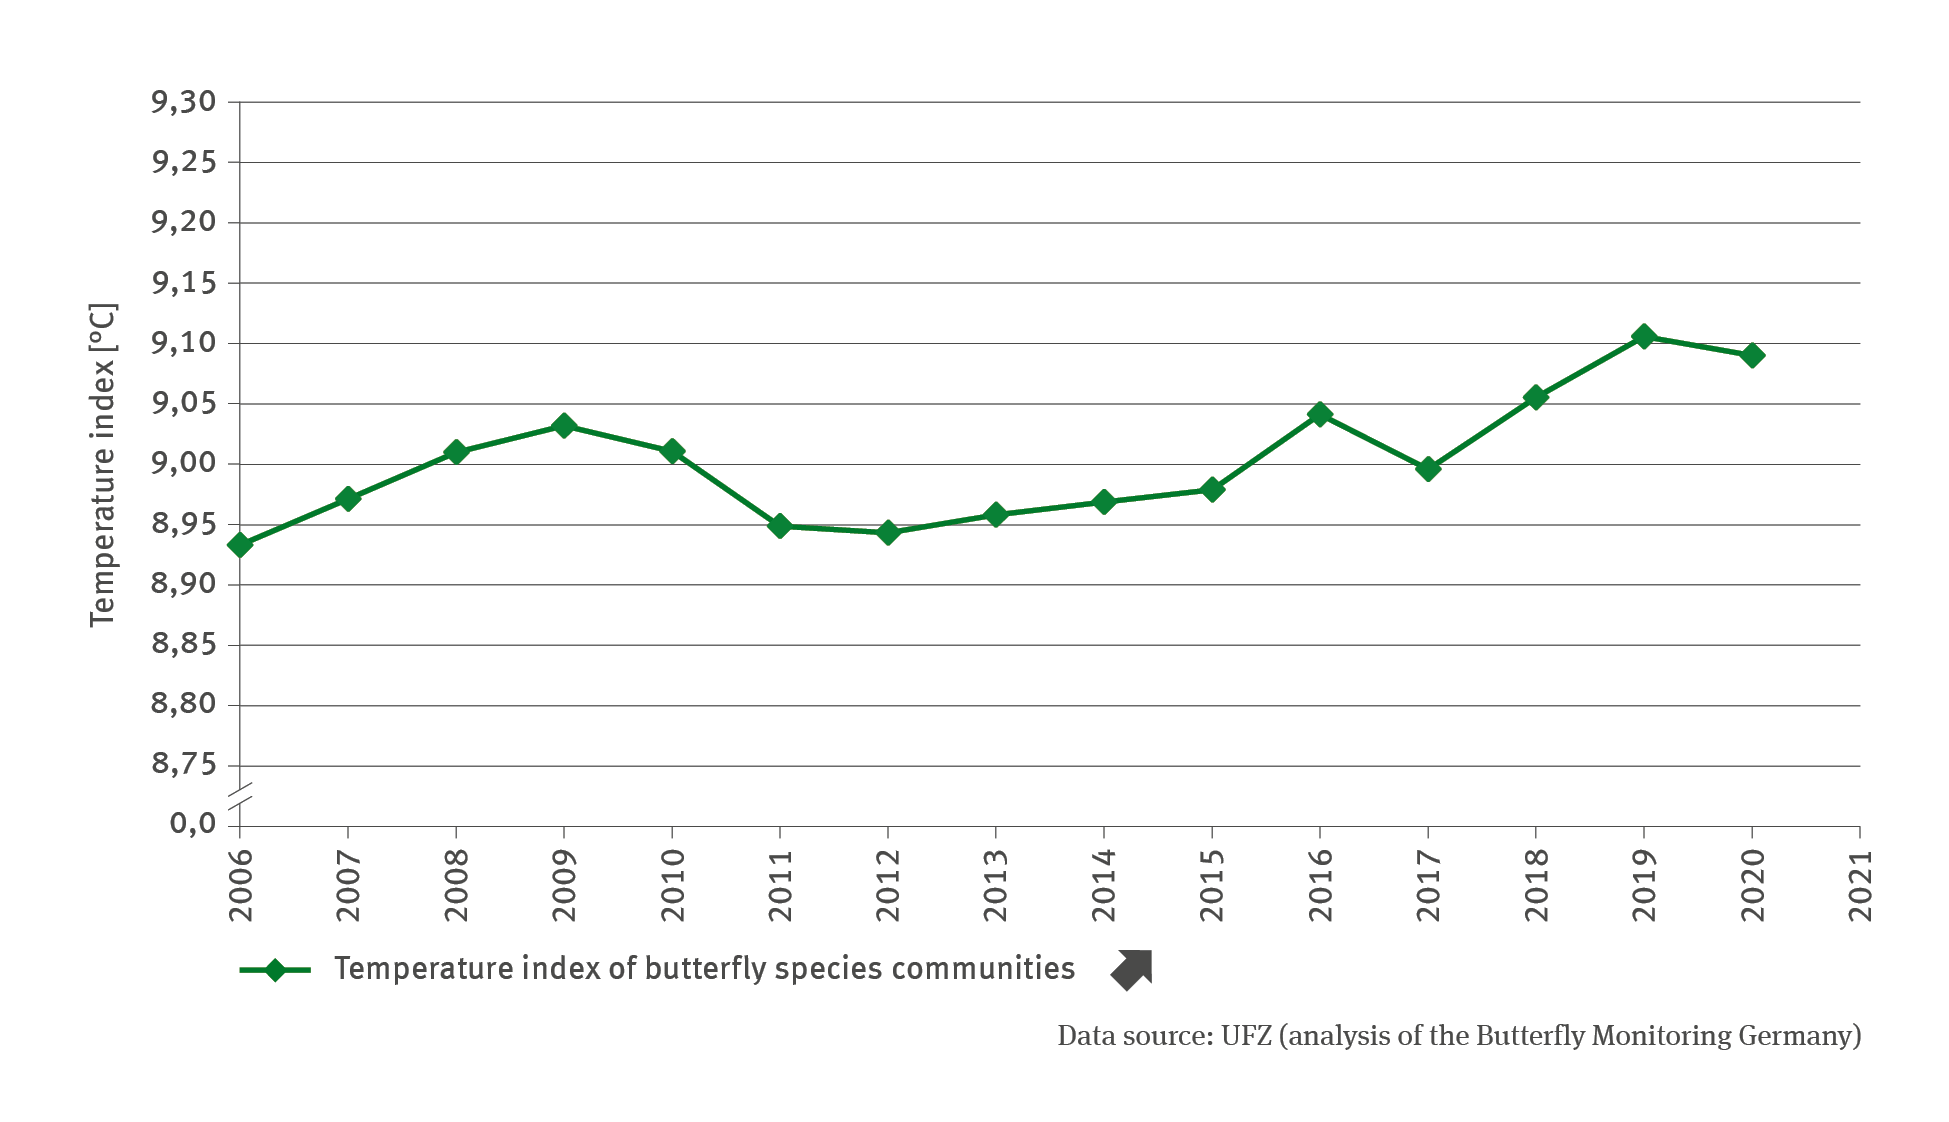
BD-I-3: Temperature index of butterfly species communities

  • Klima
  • Fläche, Boden, Land-Ökosysteme
  • Diagramme
Export data
PNG
The illustration BD-I-2 ’Temperature index for bird species communities’ is a line chart with two lines. The first line shows the annual temperature index of frequently occurring breeding bird species for the period 1990 to 2021. The index value shows a significantly rising trend and has increased from 12.14 degrees Celsius in 1990 to 12.40 degrees Celsius in 2021. The second line illustrates the moving 5-year average. Here too the trend is rising significantly.

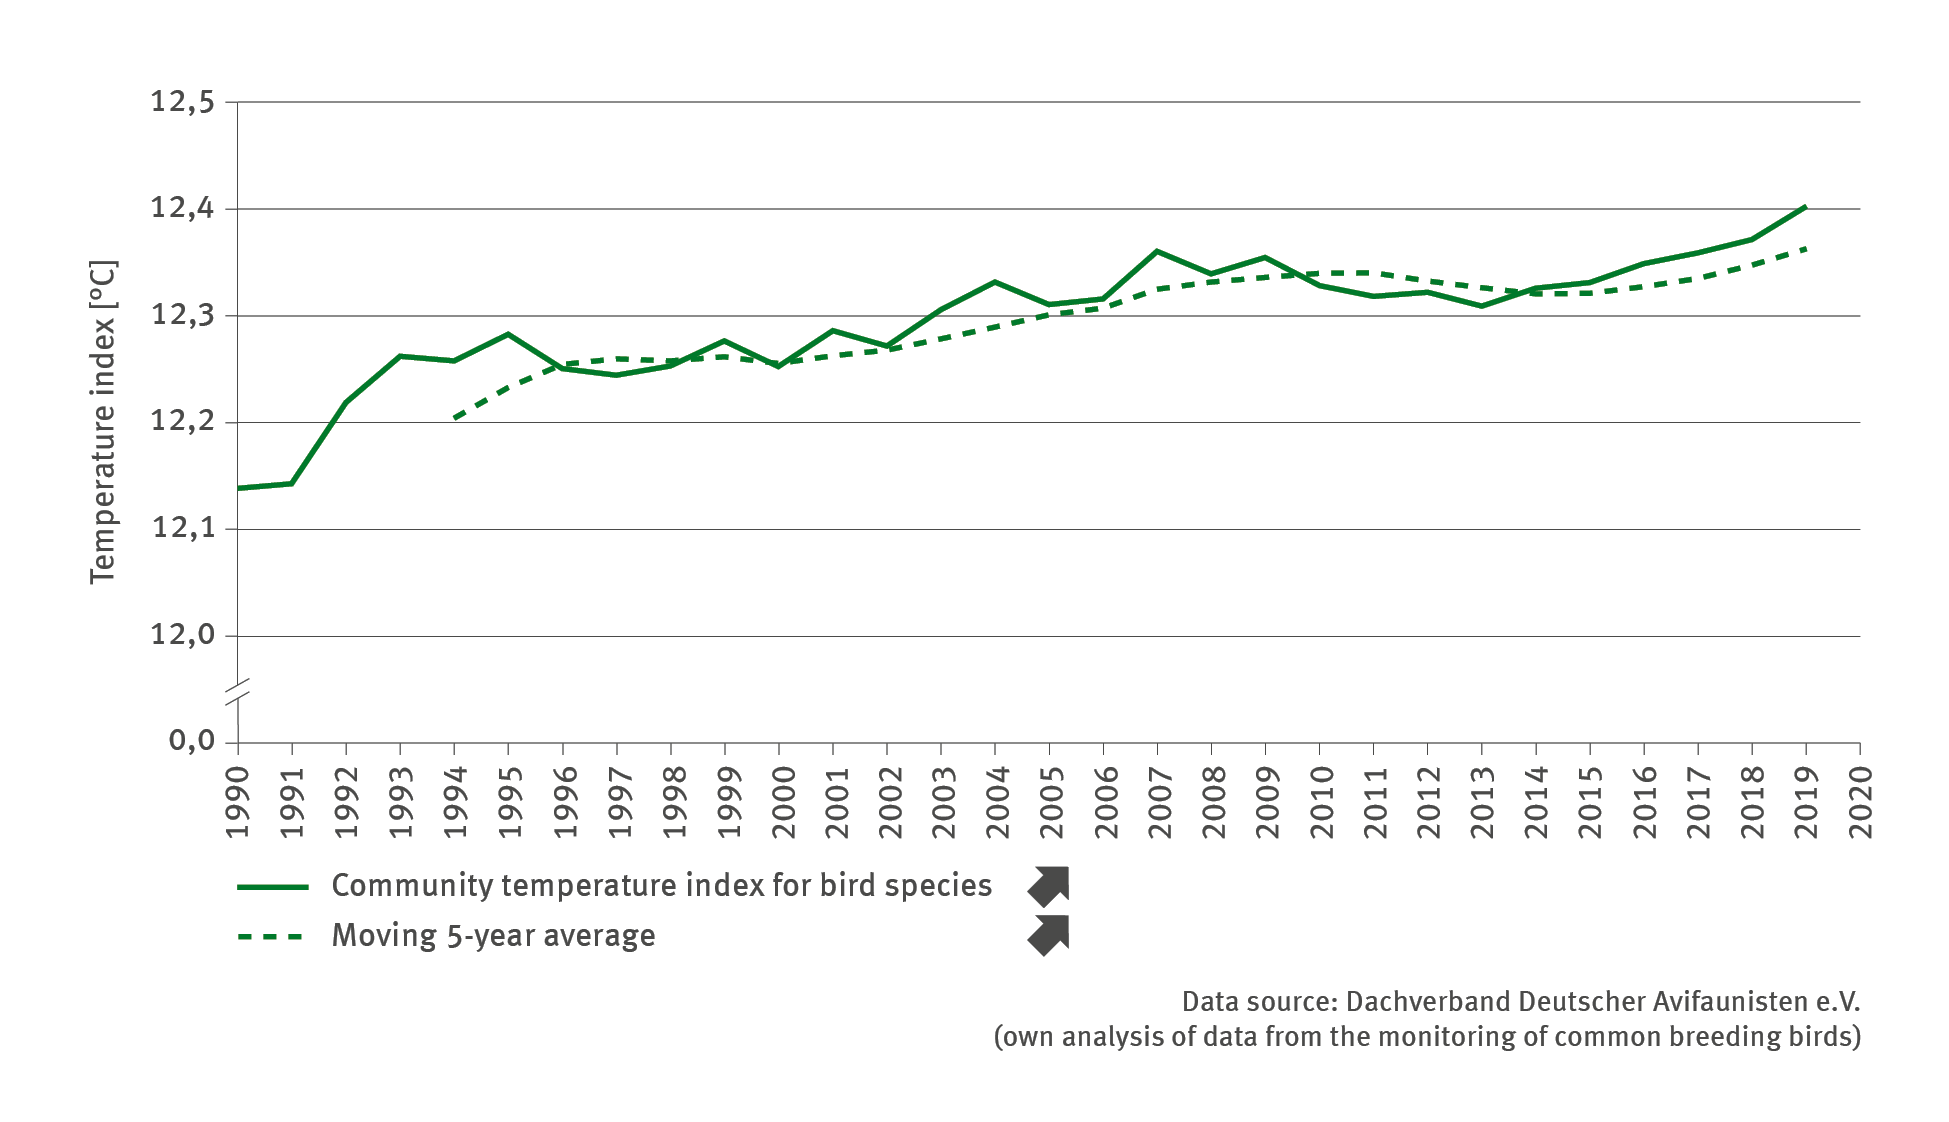
BD-I-2: Temperature index for bird species communities

  • Klima
  • Fläche, Boden, Land-Ökosysteme
  • Diagramme
Export data
PNG
The illustration contains a stacked column chart which shows the beginning and duration of the phenological seasons for the periods of 1951 to 1980, 1981 to 2010 and 1992 to 2021. This demonstrates that, by comparison, winter has become shorter which also applies to spring and high summer. The early summer has become longer by approximately two days.

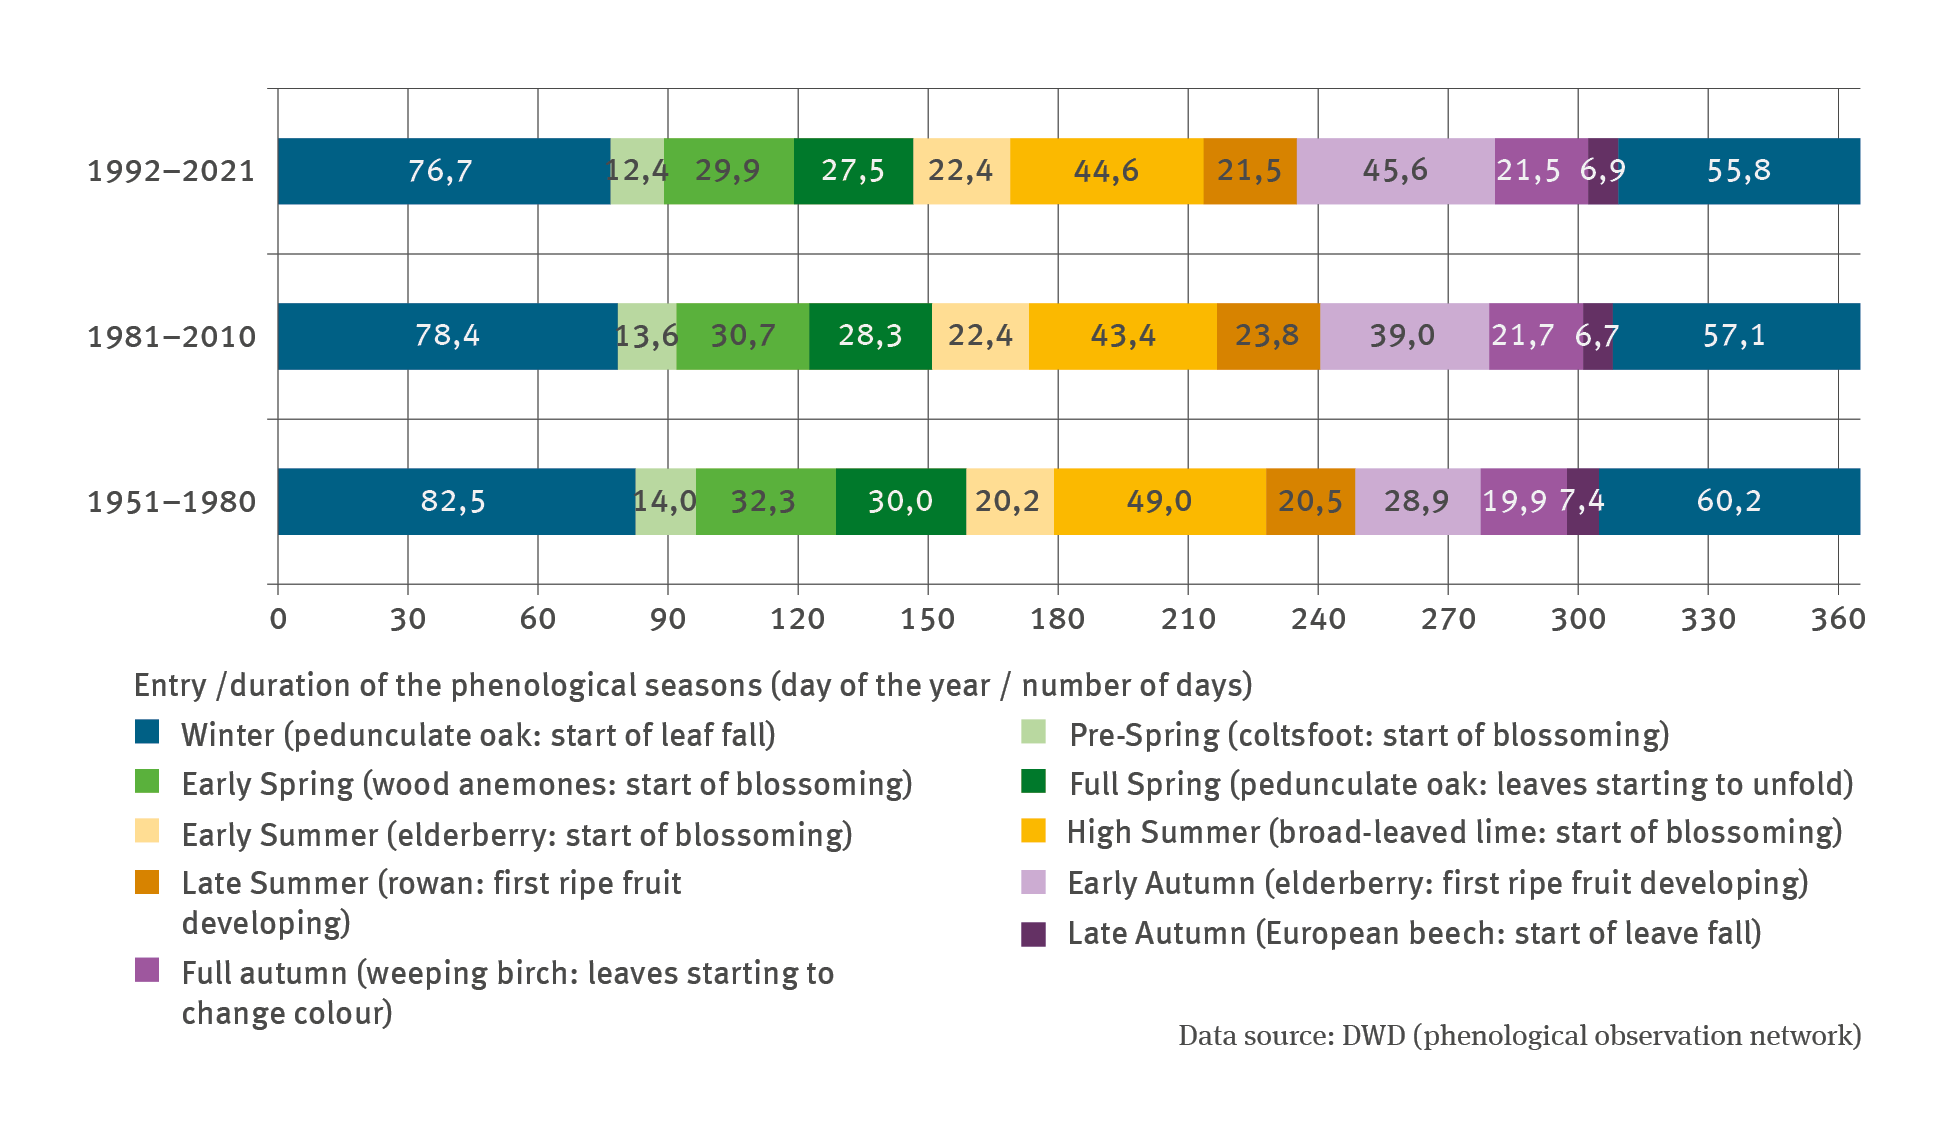
BD-I-1: Phenological changes in wild plant species

  • Klima
  • Fläche, Boden, Land-Ökosysteme
  • Diagramme
  • Infografiken
Export data
PNG
A graph shows the market shares of products with official eco-labelling. Between 2012 and 2022 this figure rose from 3.6 % to 12.2 %. In 2020 there was a significant increase from 7.9 % to 12.0 %. The target for 2030 is 34 % market share.

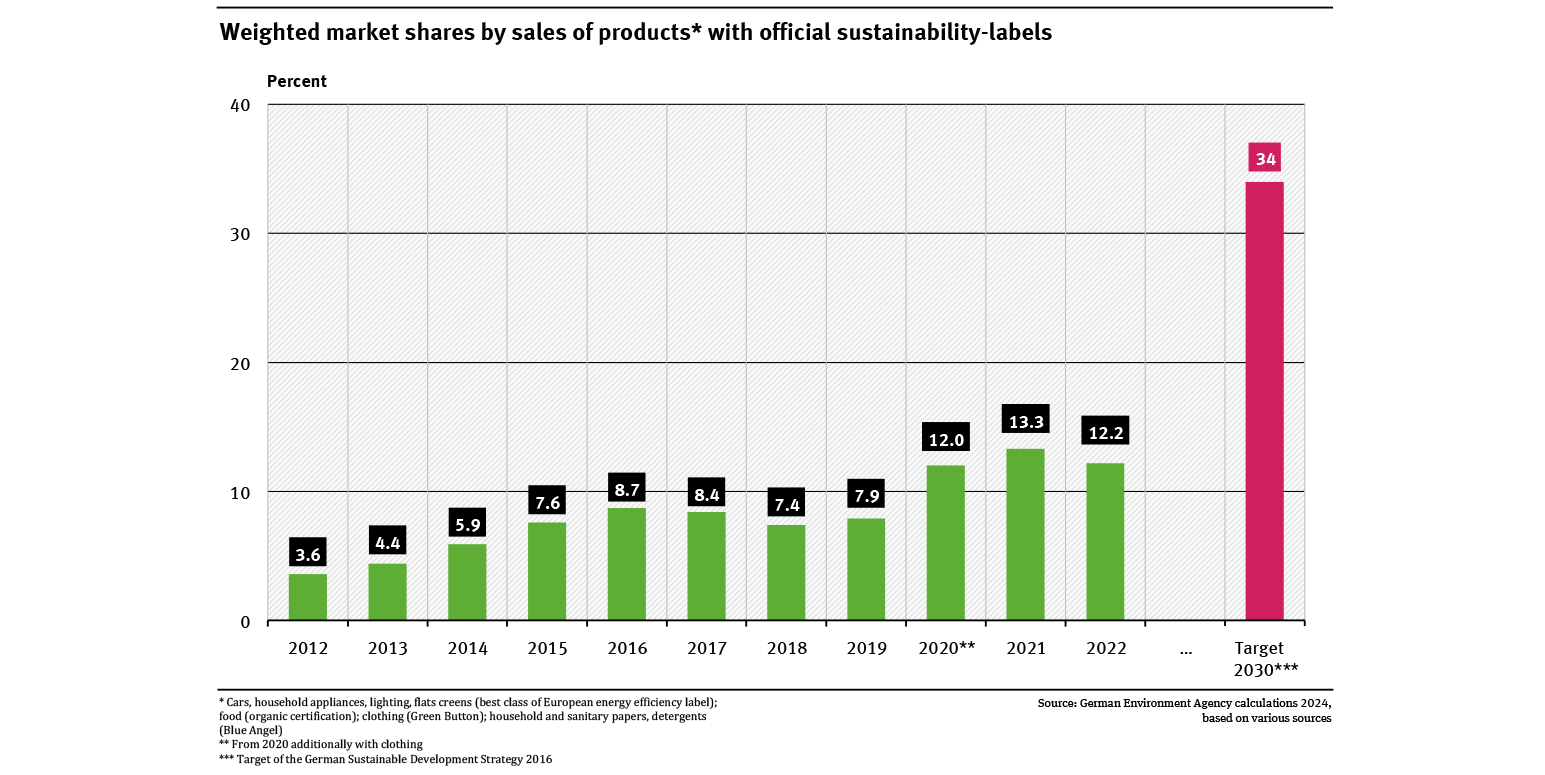
Weighted market shares by sales of products with official eco-labels

  • Private Haushalte und Konsum
  • Diagramme
  • Umwelt-Indikatoren
  • Daten und Tabellen
Export data
The bar chart FW-R-6 ’Silvicultural information on the subject of adaptation’ indicates the number of articles on the subject of climate change in the forestry journal ’AFZ – Der Wald’ published between 2002 and 2021. The time series shows a significant increase, especially between 2015 and 2019. Since that time, the number of annually published articles has stagnated at a level of roughly 65.

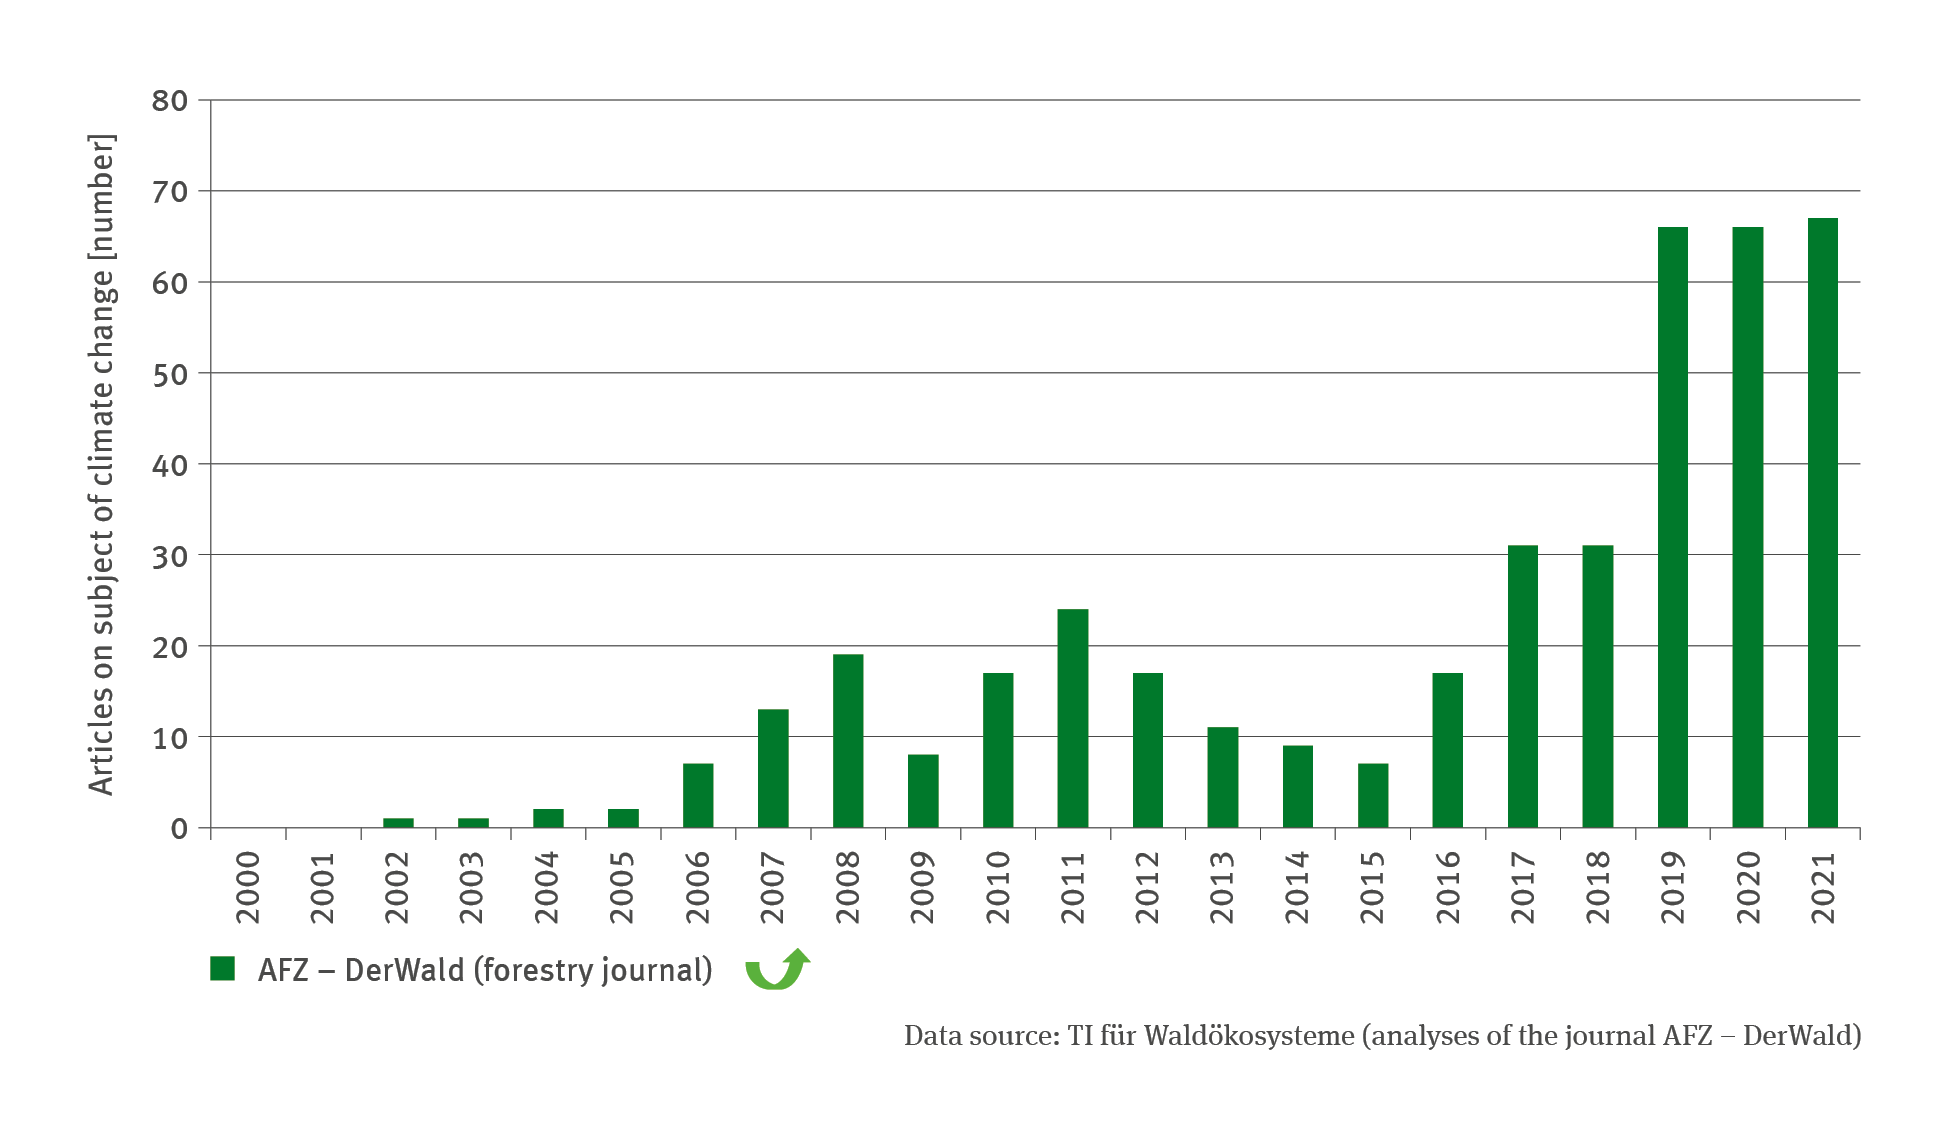
FW-R-6: Silvicultural information on the theme of adaptation

  • Klima
  • Land- und Forstwirtschaft
  • Diagramme
Export data
PNG
The biaxial chart FW-R-4 ’Utilisation of raw timber’ is divided into two thematic components. The upper part of the chart shows data on the utilisation of raw coniferous timber, whereas the lower part shows data on the utilisation of raw deciduous timber. The proportion of each type of subsequent utilisation compared to the total volume is indicated in stacked columns: material objects, energy production, exports, increase in storage.

FW-R-4: Utilisation of raw timber

  • Klima
  • Fläche, Boden, Land-Ökosysteme
  • Land- und Forstwirtschaft
  • Diagramme
Export data
PNG

You can also search in other data portals of the German Environment Agency

Short link: www.umweltbundesamt.de/n300701en