Skip to main content Skip to main menu Skip to footer

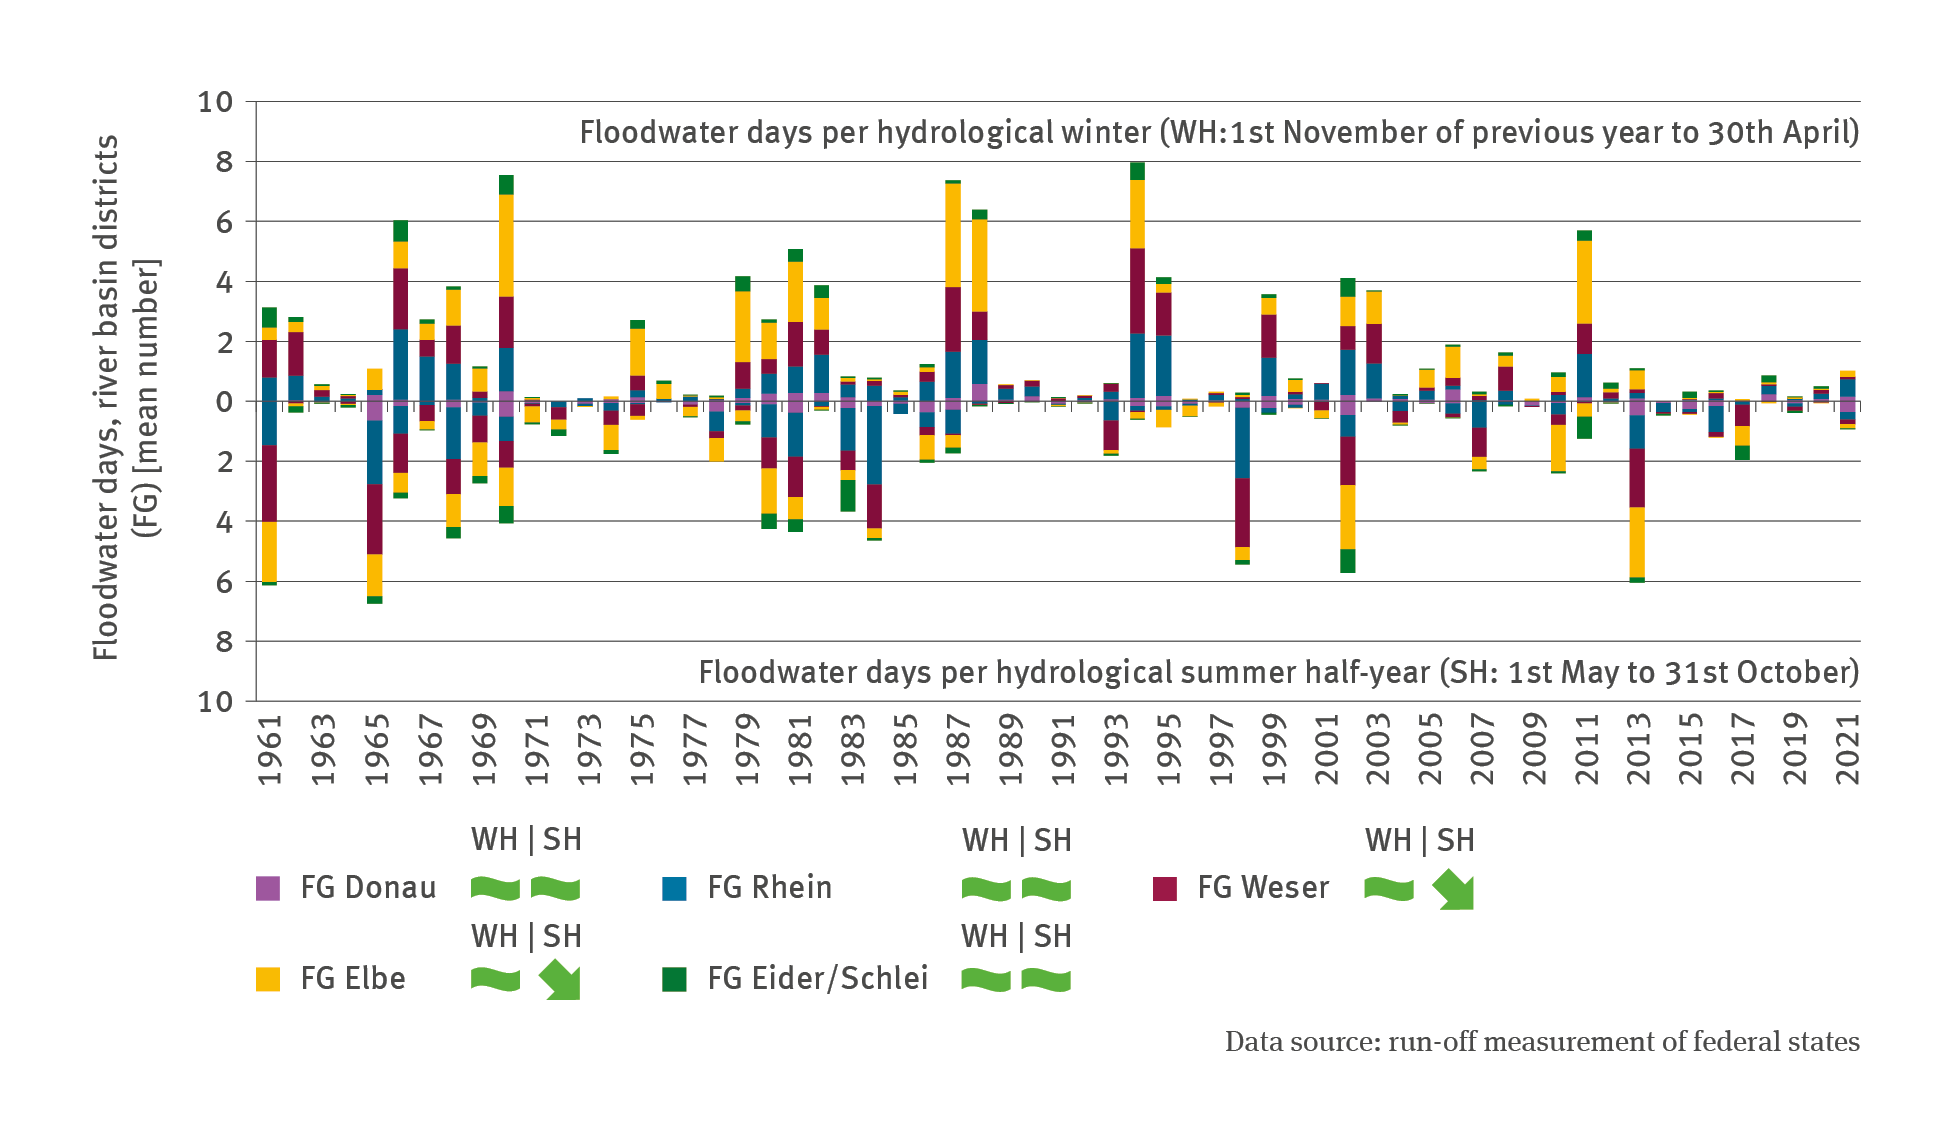
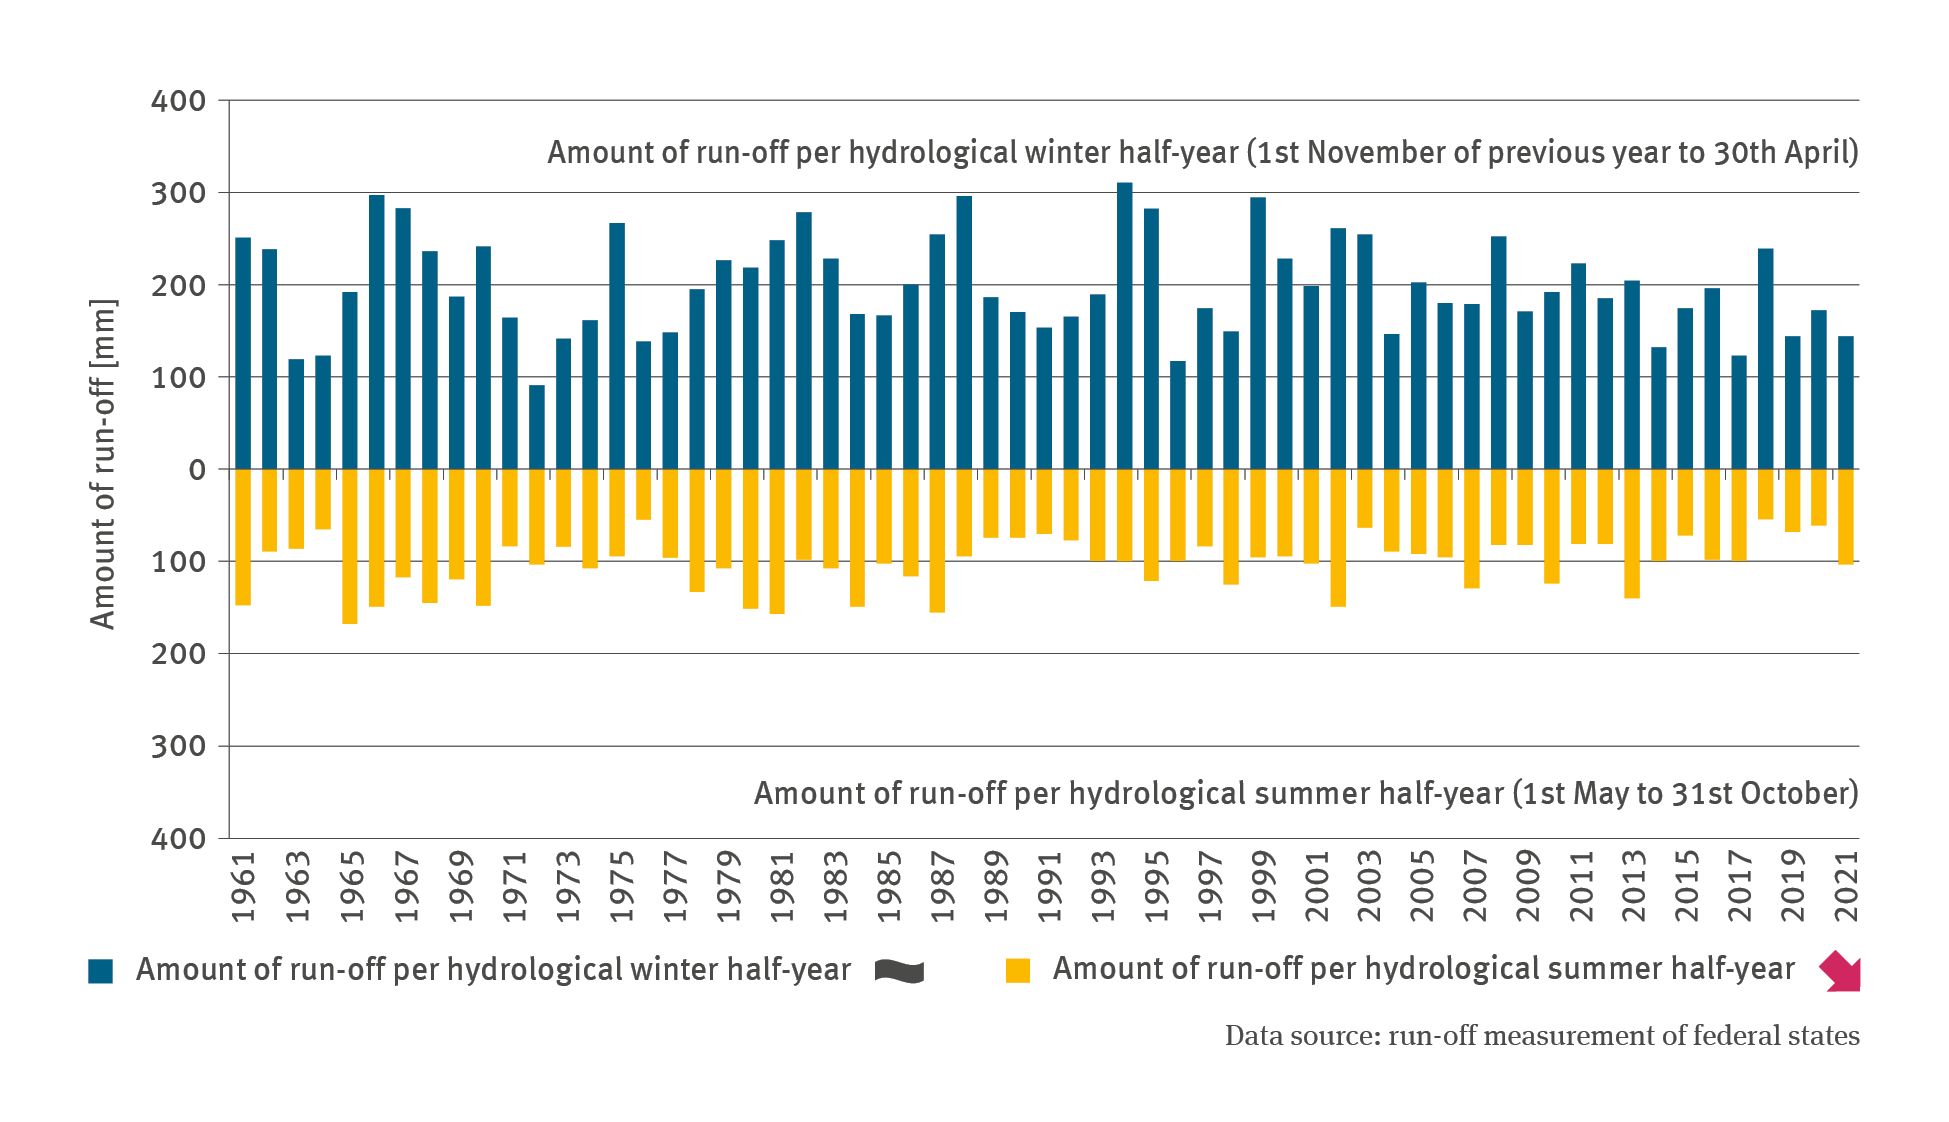
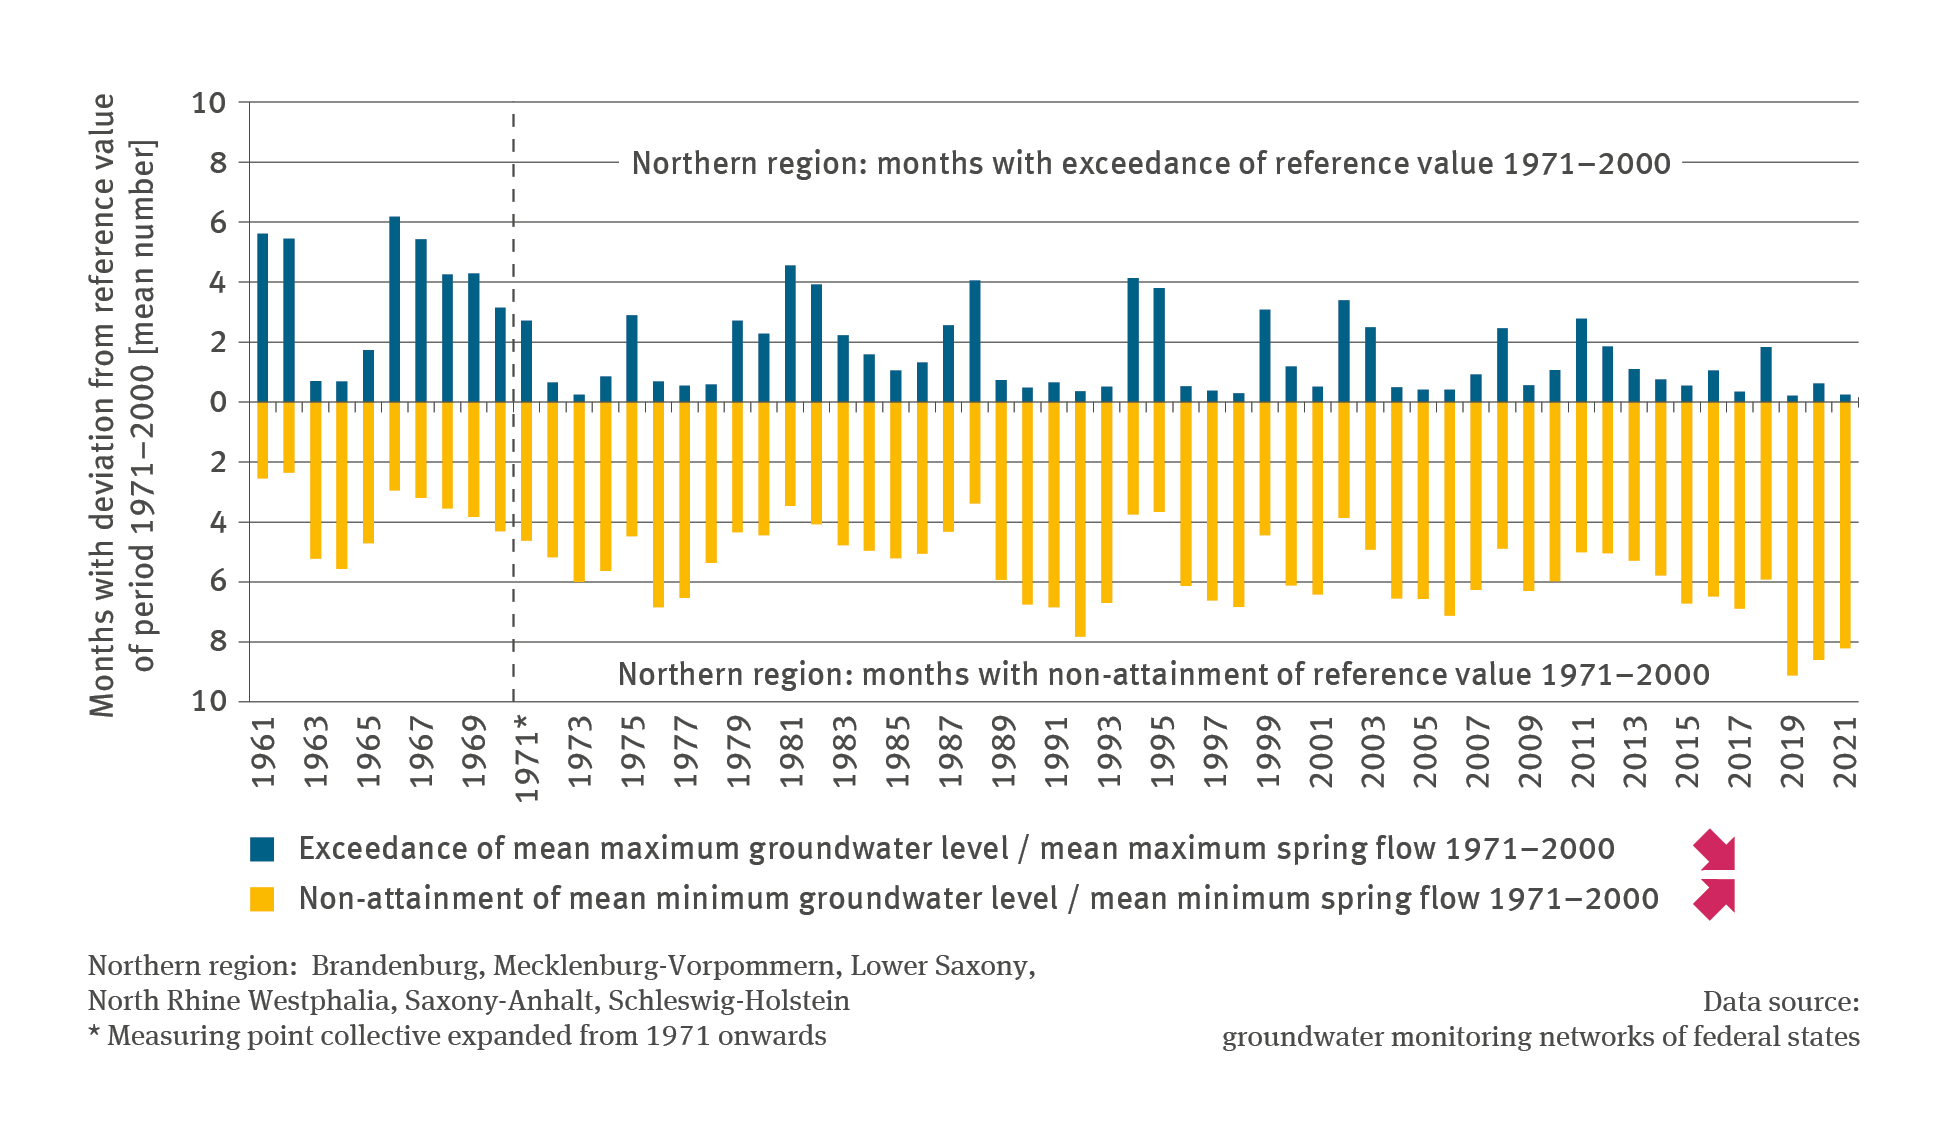
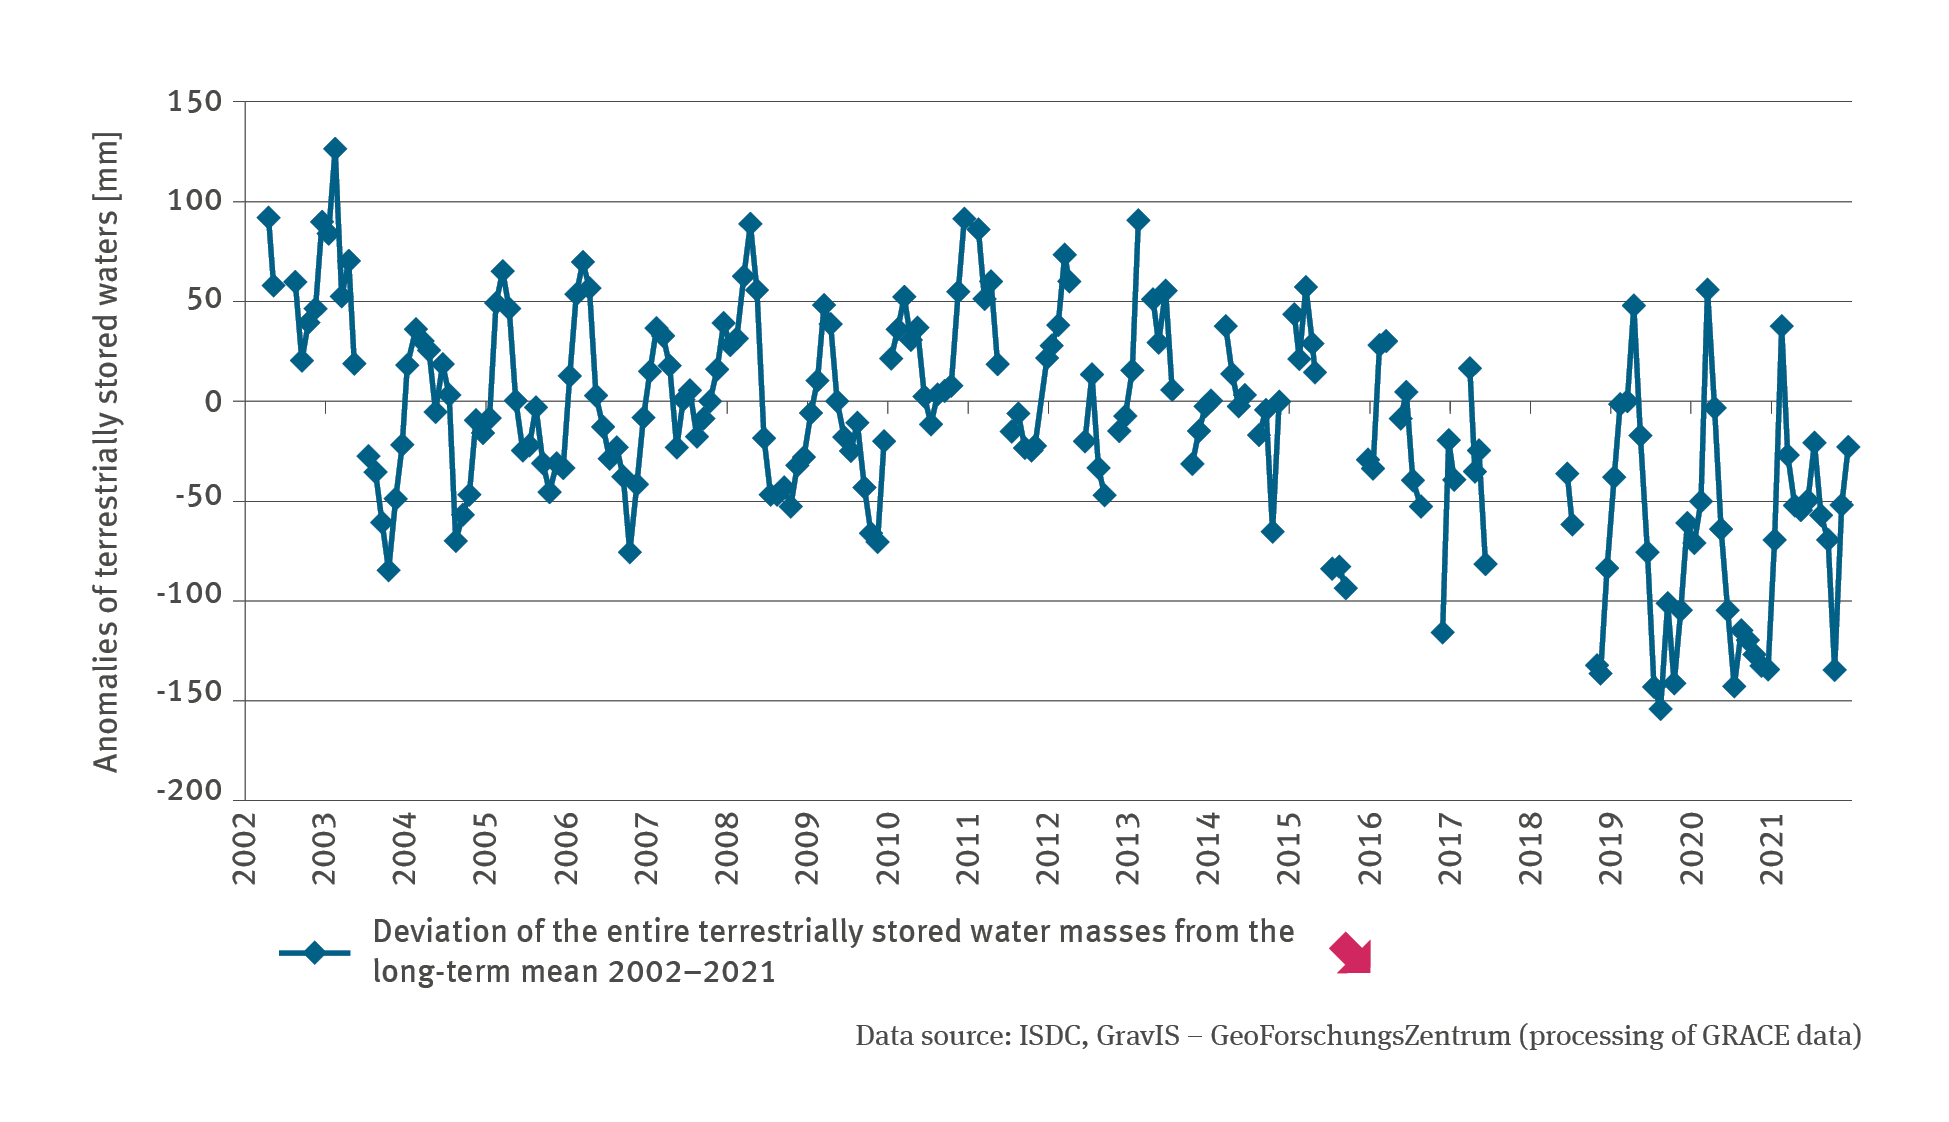
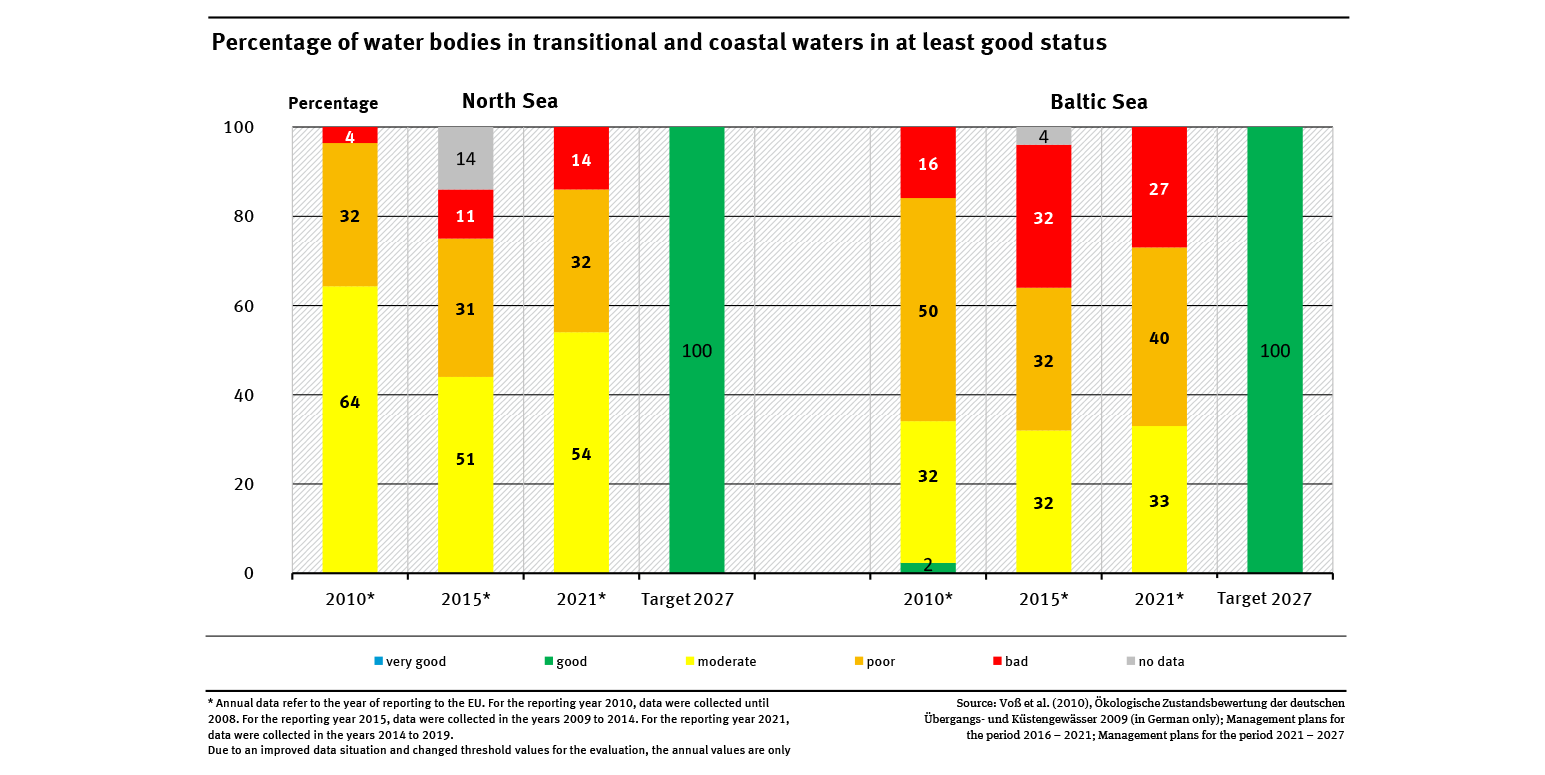
Data Search

Data Search

Here you will find diagrams, infographics, maps and tables for direct download.

Data Search

The line chart WW-I-8 ’Water temperature in lakes’ shows the annual deviation of the mean temperature of surface waters during the season, April to October, compared to the 2014 value for the watercourses in selected regions. The regions considered are the North German Plain – in one case including the river lakes, in another without the river lakes – as well as the uplands and the Alps-and-foothills.

WW-I-8: Water temperature in lakes

  • Klima
  • Wasser
  • Diagramme
Export data
PNG
The line chart WW-I-7 ’Water levels in lakes’ indicates the annual deviation of the water level in lakes in two regions – the North German Plain and the Alps-and-foothills for the years 1961 to 2021 from the water level in 2014 in centimetres. The water level of the lakes in the North German Plain receded significantly by 2021 compared to 2014; ultimately the deviation amounted to –20 cm compared to 2014.

WW-I-7: Water levels in lakes

  • Klima
  • Wasser
  • Diagramme
Export data
PNG
The bar chart WW-I-6 ‘Low water* shows – for the years of 1961 to 2021 – the number of low-water days in the water-balance related winter half-year (1st October of the previous year to 31st March) and in the water-balance related summer half-year (1st April to 30th September) respectively, prevailing in Germany’s river basins. The structure of the indicator is characterised by individual pronounced low-water events which occurred latterly in the period from 2018 to 2020.

WW-I-6: Low water

  • Klima
  • Wasser
  • Diagramme
Export data
PNG
The bar chart WW-I-5 ‘Peak discharge values in watercourses’ contains a biaxial diagram. The bar chart shows for the years 1961 to 2021 – separately for the hydrological winter half-year (1st November of the previous year to 30th April) and the hydrological summer half-year (1st May to 31st October) – on one hand the highest peak discharge at selected watercourse gauges as a multiple of MHQ.

WW-I-5: Peak discharge values in watercourses

  • Klima
  • Wasser
  • Diagramme
Export data
PNG
The bar chart WW-I-4 ’Floodwater’ shows – for the years of 1961 to 2021 – the number of floodwater days in the hydrological winter half-year (1st November of the previous year to 30th April) and in the hydrological summer half-year (1st May to 31st October) respectively, prevailing in the river basins of the Danube, Elbe, Rhine, Eider and Weser. The structure of the indicator is characterised by individual flood events which typically influence several river basins.

WW-I-4: Floodwater

  • Klima
  • Wasser
  • Diagramme
Export data
PNG
The bar chart WW-I-3 ’Mean discharge’ shows the mean runoff depth for all river basins in Germany in the hydrological winter half-year (1st November of the previous year till 30th April) and in the hydrological summer half-year (1st May till 31st October) in the years of 1961 to 2021 in millimetres. The runoff depth in the hydrological summer half-year of 2021 decreased significantly during the period of observation, in the amount of slightly more than 100 millimetres.

WW-I-3: Mean discharge

  • Klima
  • Wasser
  • Diagramme
Export data
PNG
The bar chart WW-I-2a ’Groundwater level and spring flow – Northern Region’ indicates – for the years of 1961 to 2021 – the annual number of months in which the highest mean groundwater level was exceeded in the period 1971-2000 and the highest mean spring flow, as well as the number of months in which the lowest mean groundwater level and/or the lowest mean spring flow in the period 1971–2000 were not attained.
Export data
PNG
The line chart WW-I-1 ’Terrestrially stored water’ shows the deviations of the entire terrestrially stored water masses from the long-term mean for the months of the period 2002–2021 in millimetres. The time series is marked by distinct fluctuations. While there is still a tendency towards positive anomalies at the beginning of the 2000s, it is clear that in Germany, the terrestrially stored water masses have been decreasing substantially since the beginning of 2010.

WW-I-1: Terrestrially stored water

  • Klima
  • Wasser
  • Diagramme
Export data
PNG
Kinder pflanzen in Dessau ein Blumenbeet.

Children plant flowers in Dessau

  • Klima
  • Fläche, Boden, Land-Ökosysteme
  • Wasser
Export data
JPG
A diagram shows the distribution of the ecological status/ecological potential of transitional and coastal waters for the North Sea and the Baltic Sea for the years 2010, 2015 and 2021. The target for 2027 is shown (100 % good or very good).

Percentage of water bodies in transitional and coastal waters in at least good status

  • Wasser
  • Diagramme
  • Umwelt-Indikatoren
  • Daten und Tabellen
Export data

You can also search in other data portals of the German Environment Agency

Short link: www.umweltbundesamt.de/n300701en