Skip to main content Skip to main menu Skip to footer

Data Search

Data Search

Here you will find diagrams, infographics, maps and tables for direct download.

Data Search

A graph for three air pollutants shows the extent to which the WHO recommendations from 2021 will be exceeded on average in urban areas between 2000 and 2024. The development of the various pollutants varies. Between 2000 and 2024, values for NO2 are between 172 and 28 percent, for ozone between 44 and 28 percent and for PM2.5 between 255 and 61 percent

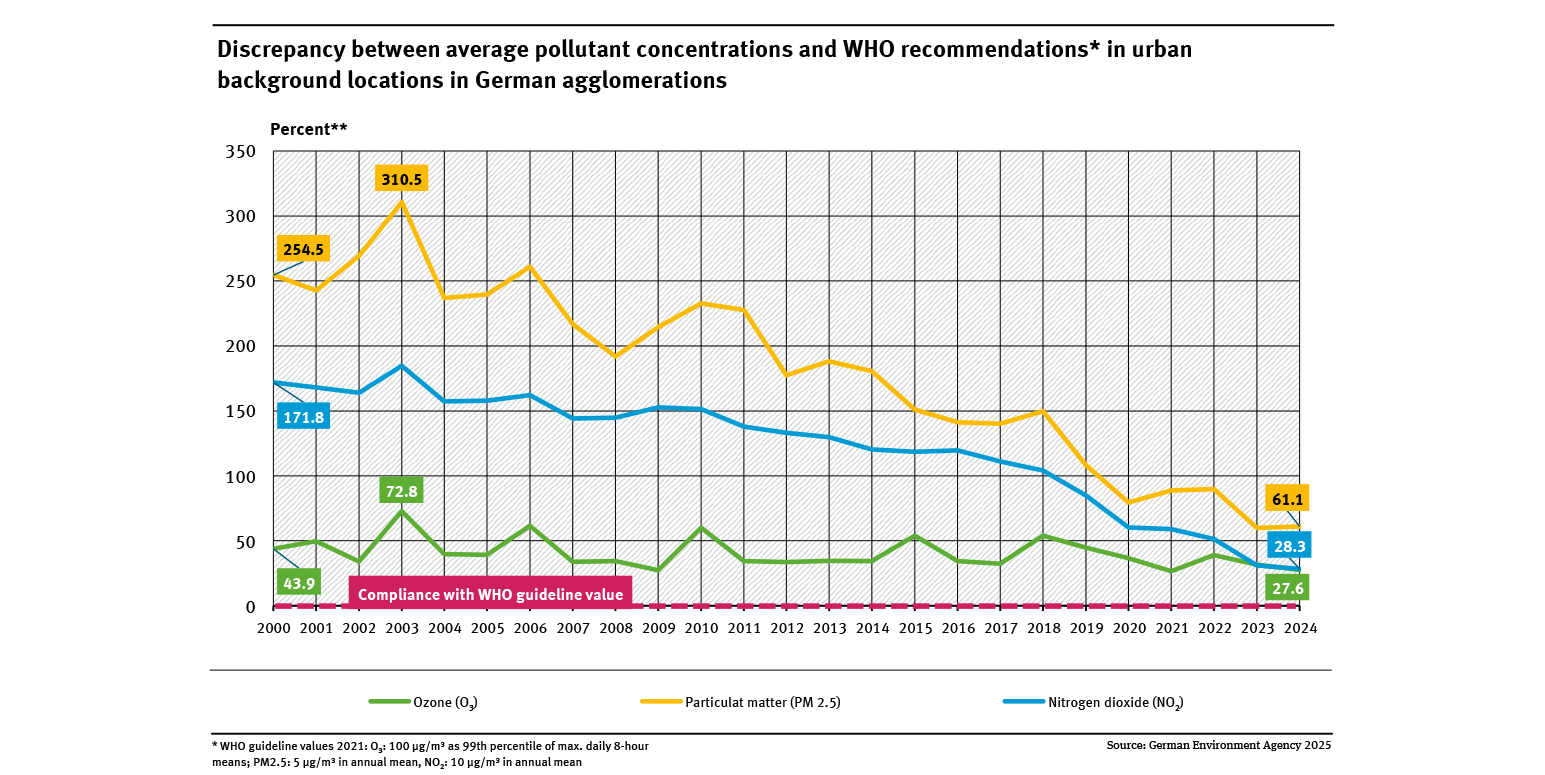
Discrepancy between average pollutant concentrations and WHO recommendations ...

  • Luft
  • Umwelt und Gesundheit
  • Diagramme
  • Umwelt-Indikatoren
  • Daten und Tabellen
Export data
A graph shows the development of environmental costs energy generation and road transport between 2017 and 2022. They were 300.3 billion euros in 2017 and 301.1 billion in 2022.

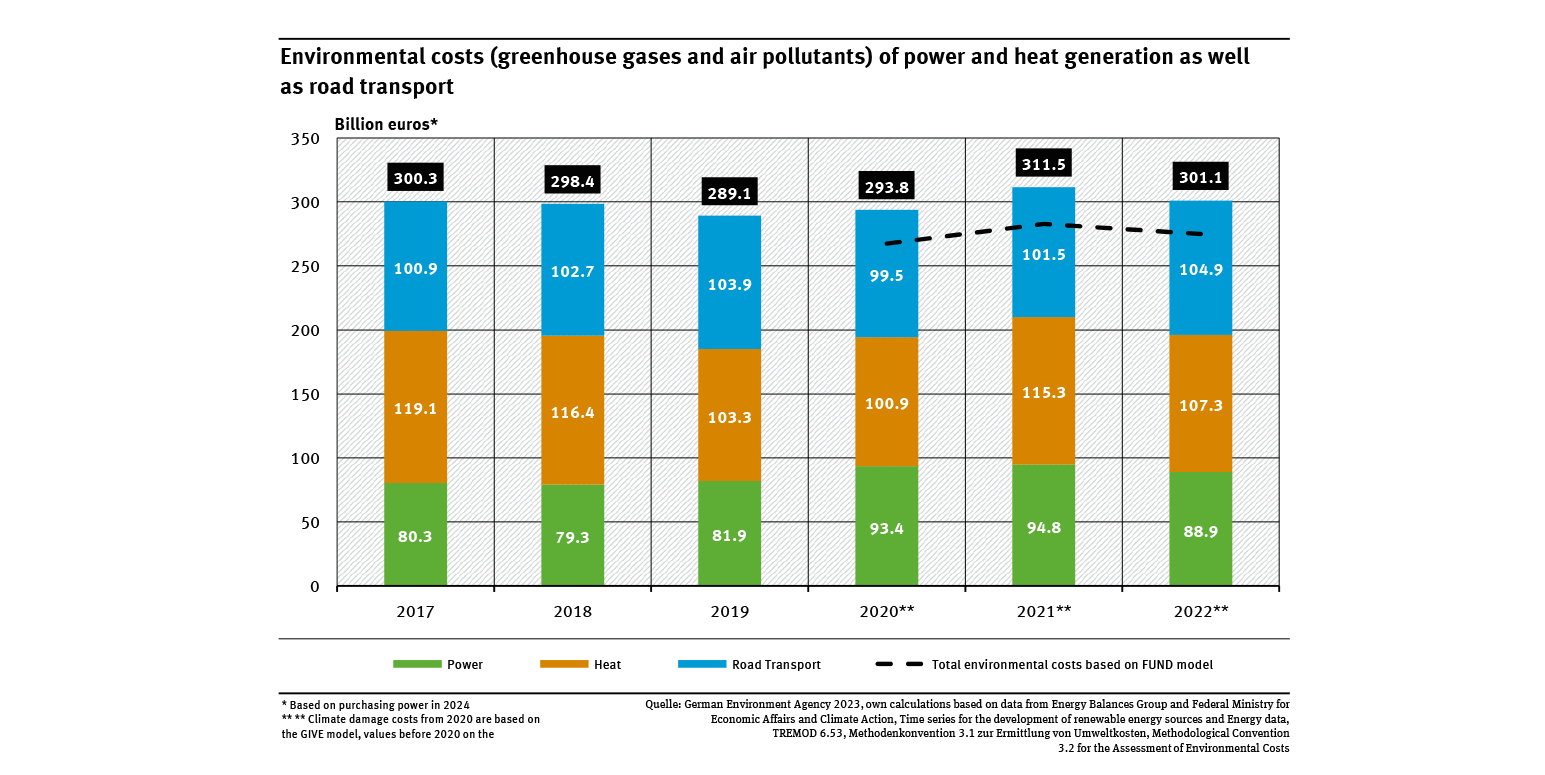
Environmental costs (greenhouse gases and air pollutants) of power and heat generation ...

  • Luft
  • Umwelt und Wirtschaft
  • Diagramme
  • Umwelt-Indikatoren
  • Daten und Tabellen
Export data
Arsenic in PM10 - annual mean values 2007 - 2021
Export data
PNG
CCE Other Reports

CCE Other Reports

  • Luft
Export data
PNG

You can also search in other data portals of the German Environment Agency

Short link: https://www.uba.de/n300701en